Earth
ID: 4855
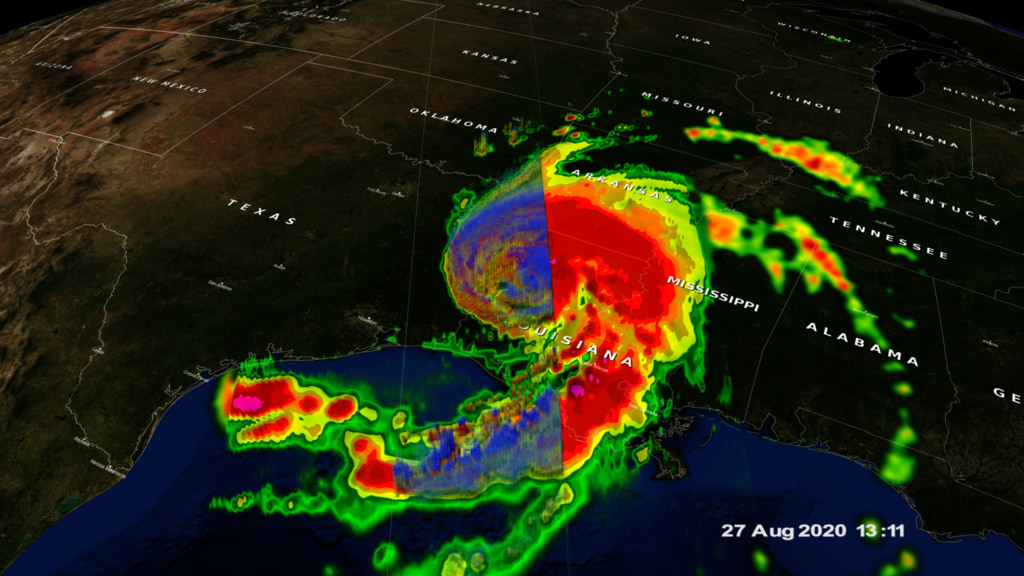
After crossing western Cuba, Tropical Storm Laura emerged into the Gulf of Mexico where warm water, low wind shear and a moist environment made conditions ideal for intensification. As it made its way through the Gulf of Mexico Laura strengthened - from a category 1 hurricane with sustained winds of 75 mph on the morning of Tuesday August 25th, to a powerful category 4 storm, with sustained winds of 150 mph on the evening of Wednesday August 26th - an increase of 75 mph in just 36 hours. At this point Laura was nearing the coast of western Louisiana, and made landfall near Cameron, Louisiana at around 1:00 a.m. CDT at the same 150 mph intensity. As it moved inland heading north over western Louisiana, Laura was overflown by the NASA / JAXA GPM Core Observatory satellite at 10:00 p.m. CDT on Wednesday August 26th, shortly before the storm made landfall, then again at 8:11 a.m. CDT on Thursday August 27th, about 7 hours after making landfall, as shown in the animation below.
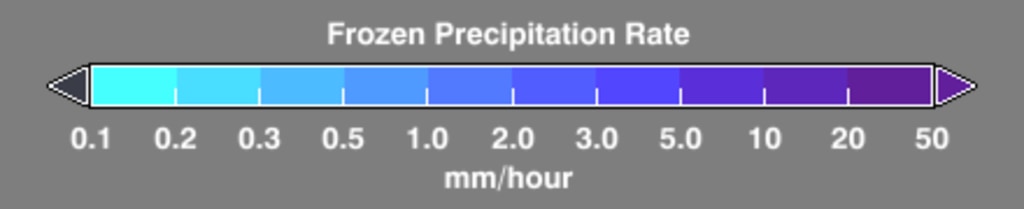
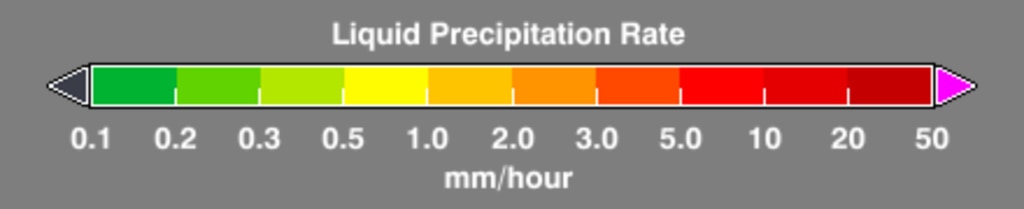
Rainfall rates derived directly from the GPM Microwave Imager (GMI) and Dual-frequency Precipitation Radar (DPR) instruments show heavy rain (in red) pushing up into northern Louisiana and southern Arkansas as strong southerly winds drew moisture from the Gulf of Mexico on the eastern side of the storm’s strong cyclonic circulation. With its ability to penetrate through the clouds using active radar, the DPR also provided a detailed look at Laura’s structure. Precipitation cloud-top heights from the DPR (highlighted in blue, indicating frozen precipitation) show Laura still had the overall structure of a powerful hurricane, as evidenced by both the symmetry of the outer rainbands that still wrap completely around the storm, as well as the residual structure of a strong core near the center containing elements of very heavy rain (shown in pink). At the time of this GPM overpass, Laura’s maximum sustained winds were still reported at 100 mph by the National Hurricane Center, the equivalent of a category 2 hurricane.
GPM data is archived at https://pps.gsfc.nasa.gov/
NASA's GPM captures powerful Hurricane Laura over Louisiana
Rainfall rates derived directly from the GPM Microwave Imager (GMI) and Dual-frequency Precipitation Radar (DPR) instruments show heavy rain (in red) pushing up into northern Louisiana and southern Arkansas as strong southerly winds drew moisture from the Gulf of Mexico on the eastern side of the storm’s strong cyclonic circulation. With its ability to penetrate through the clouds using active radar, the DPR also provided a detailed look at Laura’s structure. Precipitation cloud-top heights from the DPR (highlighted in blue, indicating frozen precipitation) show Laura still had the overall structure of a powerful hurricane, as evidenced by both the symmetry of the outer rainbands that still wrap completely around the storm, as well as the residual structure of a strong core near the center containing elements of very heavy rain (shown in pink). At the time of this GPM overpass, Laura’s maximum sustained winds were still reported at 100 mph by the National Hurricane Center, the equivalent of a category 2 hurricane.
GPM data is archived at https://pps.gsfc.nasa.gov/
Related
Visualization Credits
Alex Kekesi (Global Science and Technology, Inc.): Lead Data Visualizer
Greg Shirah (NASA/GSFC): Data Visualizer
George Huffman (NASA/GSFC): Lead Scientist
Dalia B Kirschbaum (NASA/GSFC): Scientist
Jacob Reed (Telophase): Scientist
Scott Braun (NASA/GSFC): Scientist
Ryan Fitzgibbons (USRA): Lead Producer
Stephen Lang (SSAI): Lead Writer
Greg Shirah (NASA/GSFC): Data Visualizer
George Huffman (NASA/GSFC): Lead Scientist
Dalia B Kirschbaum (NASA/GSFC): Scientist
Jacob Reed (Telophase): Scientist
Scott Braun (NASA/GSFC): Scientist
Ryan Fitzgibbons (USRA): Lead Producer
Stephen Lang (SSAI): Lead Writer
Please give credit for this item to:
NASA's Scientific Visualization Studio
NASA's Scientific Visualization Studio
Short URL to share this page:
https://svs.gsfc.nasa.gov/4855
Mission:
Global Precipitation Measurement (GPM)
Data Used:
Note: While we identify the data sets used in these visualizations, we do not store any further details nor the data sets themselves on our site.
This item is part of this series:
GPM Animations
Keywords:
DLESE >> Atmospheric science
DLESE >> Hydrology
DLESE >> Natural hazards
SVS >> Tropical Storm
GCMD >> Earth Science >> Atmosphere >> Atmospheric Phenomena >> Hurricanes
GCMD >> Earth Science >> Atmosphere >> Precipitation >> Rain
SVS >> Hyperwall
NASA Science >> Earth
GCMD >> Earth Science >> Human Dimensions >> Natural Hazards >> Floods
NASA Earth Science Focus Areas >> Weather and Atmospheric Dynamics
GCMD keywords can be found on the Internet with the following citation: Olsen, L.M., G. Major, K. Shein, J. Scialdone, S. Ritz, T. Stevens, M. Morahan, A. Aleman, R. Vogel, S. Leicester, H. Weir, M. Meaux, S. Grebas, C.Solomon, M. Holland, T. Northcutt, R. A. Restrepo, R. Bilodeau, 2013. NASA/Global Change Master Directory (GCMD) Earth Science Keywords. Version 8.0.0.0.0
https://svs.gsfc.nasa.gov/4855
Mission:
Global Precipitation Measurement (GPM)
Data Used:
GPM/GMI/Surface Precipitation also referred to as: Rain Rates
8/27/2020 13:11Z
Credit:
Data provided by the joint NASA/JAXA GPM mission.
Data provided by the joint NASA/JAXA GPM mission.
GPM/DPR/Ku also referred to as: Volumetric Precipitation data
Observed Data - JAXA - 8/27/2020 13:11Z
Credit:
Data provided by the joint NASA/JAXA GPM mission.
Data provided by the joint NASA/JAXA GPM mission.
also referred to as: IMERG
Data Compilation - NASA/GSFC - 8/27/2020This item is part of this series:
GPM Animations
Keywords:
DLESE >> Atmospheric science
DLESE >> Hydrology
DLESE >> Natural hazards
SVS >> Tropical Storm
GCMD >> Earth Science >> Atmosphere >> Atmospheric Phenomena >> Hurricanes
GCMD >> Earth Science >> Atmosphere >> Precipitation >> Rain
SVS >> Hyperwall
NASA Science >> Earth
GCMD >> Earth Science >> Human Dimensions >> Natural Hazards >> Floods
NASA Earth Science Focus Areas >> Weather and Atmospheric Dynamics
GCMD keywords can be found on the Internet with the following citation: Olsen, L.M., G. Major, K. Shein, J. Scialdone, S. Ritz, T. Stevens, M. Morahan, A. Aleman, R. Vogel, S. Leicester, H. Weir, M. Meaux, S. Grebas, C.Solomon, M. Holland, T. Northcutt, R. A. Restrepo, R. Bilodeau, 2013. NASA/Global Change Master Directory (GCMD) Earth Science Keywords. Version 8.0.0.0.0


