Earth Information Center (EIC)
Overview
For more than 50 years, NASA satellites have provided data on Earth's land, water, air, temperature, and climate. The Earth Information Center (EIC) allows visitors to see how our planet is changing in nine key areas: sea level change, air quality, biodiversity, wildfires, greenhouse gases, energy, disasters, water resources, and agriculture. This information supports decision makers in developing the tools they need to mitigate, adapt, and respond to our changing planet.
Drawing from insight provided by NASA centers from coast to coast, and in close coordination with other government agencies, industry partners and communities, the Earth Information Center delivers critical data directly into the hands of people in ways that they can immediately use.
Through the Earth Information Center discover how NASA sees the unseen and consider why this information matters to us all.
This gallery consists of content used in the hyperwall display in the Earth Information Center at NASA Headquarters.
EIC Dashboards
- ID: 40509 Gallery
Earth Now Dashboard
Go to this pageNASA satellites provide data on Earth's land, ecosystems, water, air temperature, and climate - and have done so for more than 50 years. Earth information from space supports decision makers, partners, and people in developing the tools they need to mitigate, adapth, and respond to our changing planet. The visualizations featured on this dashboard show the latest imagery available.
- ID: 40473 Gallery
Climate Vital Signs Dashboard
Go to this pageNASA monitors the health of our planet to benefit human kind. Our missions track key climate indicators and we share these with the world.
- ID: 40477 Gallery
Greenhouse Gases Dashboard
Go to this pageNASA and its partner agencies track greenhouse gases for space, air, and ground. our scientists model the flow of these gases around our planet.
- ID: 40479 Gallery
Carbon Dioxide Sources and Sinks
Go to this pageNASA models the flow of carbon dioxide; its emission, its transport around the globe, and its absorption by the ocean and biosphere.
- ID: 40529 Gallery

Air Quality Dashboard
Go to this pageNASA's fleet of Earth observing satellites monitor our planet's oceans, biosphere, and atmosphere. Instruments onboard satellites observe air pollutants around the world. The data collected are used by air quality experts and researchers studying the impact of air pollution on human health.
- ID: 40531 Gallery

Wildland Fires Dashboard
Go to this pageClimate change continues to cause longer fire seasons and more severe wildfires. NASA's Earth observing satellites and its robust network of interagency partners work together to help communities manage the impacts of fire, and reduce risks before, during and after fire events.
EIC Videos
Videos produced for NASA's Earth Information Center.
- ID: 40487 Gallery
NASA and Hurricanes
Go to this pageHurricanes are getting stronger due to climate change warming the air and oceans. NASA atmospheric scientist Mara Fuentes says NASA sees deep into hurricanes to better their power, track storms through the night, and precisely map flooding in real time. NASA shares this information with partners like NOAA for weather forecasts and FEME to support emergency responders. Before, during, and after a hurricane, NASA data is put to use by decision makers to make critical decisions.
- ID: 40484 Gallery
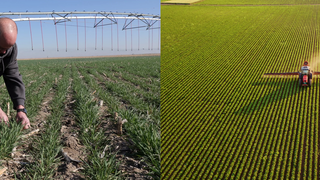
NASA and Agriculture Video
Go to this pageThe farmers responsible for the food that reaches your plate need a lot of a very precious and limited resource, water. NASA works with farmers like Dwane Roth of Kansas to help them track their water use. Roth says that farmers like him are seeing more frequent, hotter days with less rain. “We need to grow more with less and get as much out of each drop of water we can,” he says. NASA helps to promote the use of Earth observations to strengthen food security. One solution is OpenET, a system that puts near-real-time water data into the hands of farmers in the United States.
- ID: 14700 Produced Video
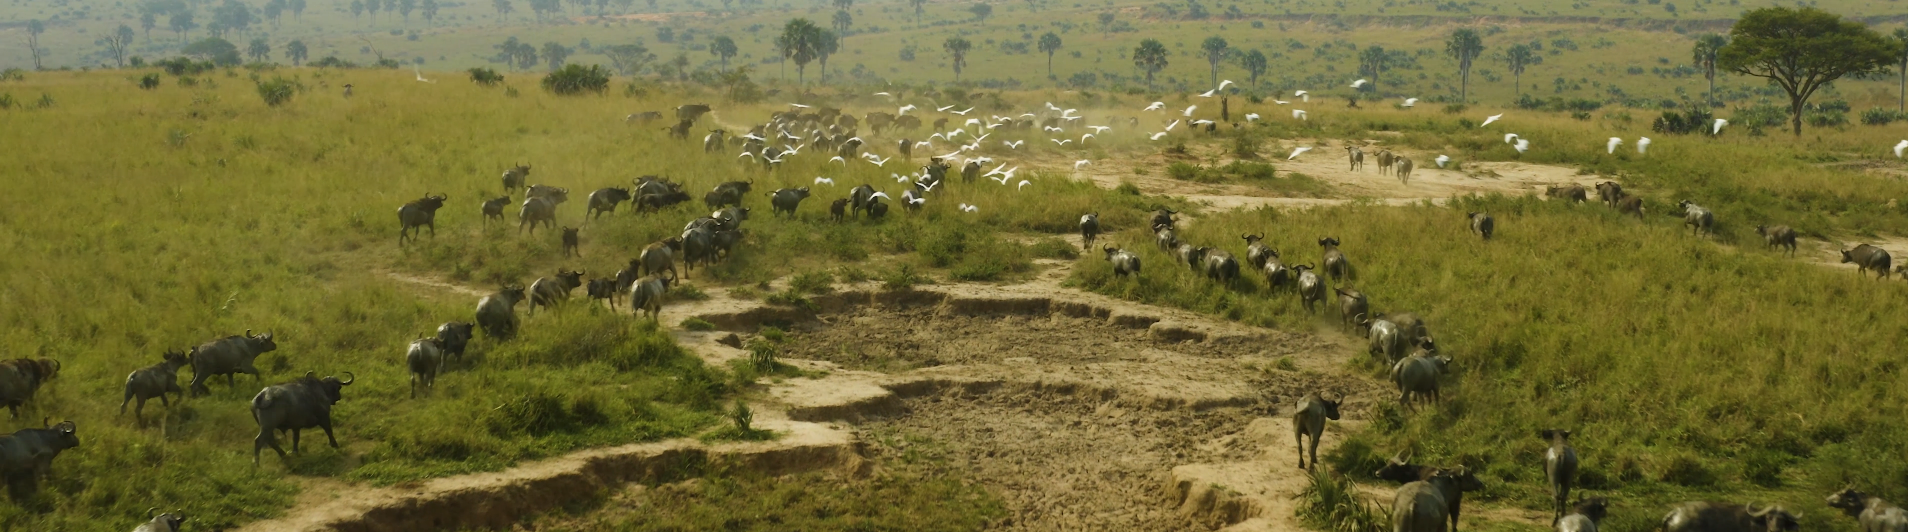
NASA + The Smithsonian: Biodiversity
Go to this pageBiodiverse ecosystems need protection. Through fieldwork, coordination with local partners, and satellite observations, NASA and the Smithsonian are working hard to protect them. Using NASA Earth science satellite and other data, the Goodall Institute puts imagery and data into the hands of local communities to drive conservation efforts. The Scimitar-horned oryx went from extinct in the wild to endangered in the wild thanks to the Smithsonian’s work with partners to re-introduce the species.
- ID: 14606 Produced Video
![Full 8K resolution. Optimized for Earth Information Center display.
Music credit: "Magical Moments by Liam Joseph Hennessy [ PRS ]" and “Strategy Meeting by Brice Davoli [ SACEM ]” from Universal Production MusicThis video can be freely shared and downloaded at https://svs.gsfc.nasa.gov/14606. While the video in its entirety can be shared without permission, the music and some individual imagery may have been obtained through permission and may not be excised or remixed in other products. Specific details on such imagery may be found here: https://svs.gsfc.nasa.gov/14606. For more information on NASA’s media guidelines, visit https://nasa.gov/multimedia/guidelines.](/vis/a010000/a014600/a014606/EIC_NASAandFire_Main_Image_4K.jpg)
NASA and Fire
Go to this pageWildland fires, which are natural and essential for many ecosystems, have increased in frequency and size due to longer fire seasons, climate change, and the expanding interface between communities and wild vegetation. Using fire strategically—through prescribed burns and natural ignitions—can mitigate future severe fires that might burn more intensely under hotter, drier conditions.
- ID: 14696 Produced Video
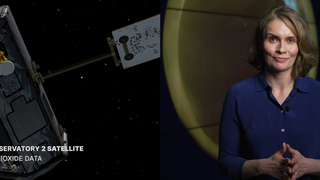
NASA + Smithsonian and Greenhouse Gases
Go to this pageFull 8K resolution. Optimized for Earth Information Center display at the National Museum of Natural History (Smithsonian).Universal Production Music France: "Human Endeavor" by Oliver Grim, Koka Media; "Accuracy" by Laurent Levesque.Universal Production Music: "Feelings of Pride" by Kathryn Louise Maclennan, Label-Aurora Production Music.This video can be freely shared and downloaded. While the video in its entirety can be shared without permission, some individual imagery provided by Pond5, Shutterstock and Smithsonian is obtained through permission and may not be excised or remixed in other products. For more information on NASA’s media guidelines, visit https://www.nasa.gov/multimedia/guidelines/index.htmlComplete transcript available.Watch this video on the NASA Scientific Visualization Studio YouTube channel. || Smithsonian_GHG.png (3825x1076) [2.8 MB] || Smithsonian_GHG_searchweb.png (320x180) [63.7 KB] || Smithsonian_GHG_thm.png (80x40) [6.2 KB] || GHG_Smithsonian.en_US.srt [5.8 KB] || GHG_Smithsonian.en_US.vtt [5.5 KB] || Smithsonian_GHG_v5_small.mp4 (7680x2160) [472.3 MB] || Smithsonian_GHG_v5_medium.mp4 (7680x2160) [859.9 MB] || Smithsonian_GHG_v5_h.264.mp4 (7680x2160) [4.5 GB] ||
- ID: 14568 Produced Video
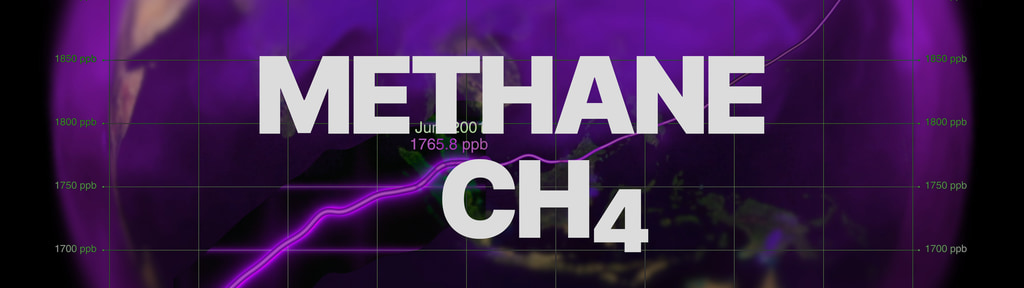
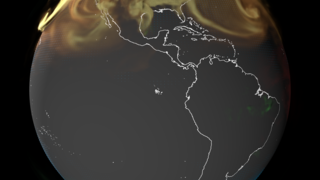
Tracking the Greenhouse Gas Methane, Earth Information Center Videos
Go to this pageFull 8K resolution. Optimized for Earth Information Center display.Universal Production Music: "Passing By" by Miguel D'Oliveira, "Simple Story" by Fred Dubois, and "Whispers of Hope" by Sam Connelly, This video can be freely shared and downloaded. While the video in its entirety can be shared without permission, some individual imagery provided by Pond5 and The Raleigh Drone Company is obtained through permission and may not be excised or remixed in other products. For more information on NASA’s media guidelines, visit https://www.nasa.gov/multimedia/guidelines/index.html || GHGMain.png (7680x2160) [5.4 MB] || GHGMain_print.jpg (1024x288) [68.0 KB] || GHGMain_searchweb.png (320x180) [64.0 KB] || GHGMain_thm.png (80x40) [6.8 KB] || GHG.en_US.srt [4.0 KB] || GHG.en_US.vtt [3.8 KB] || GHG_Main_7680x2160.mp4 (7680x2160) [586.6 MB] || GHG_Main.mp4 (7680x2160) [1.1 GB] || GHG_Main_h.264.mov (7680x2160) [1.1 GB] ||
- ID: 14507 Produced Video
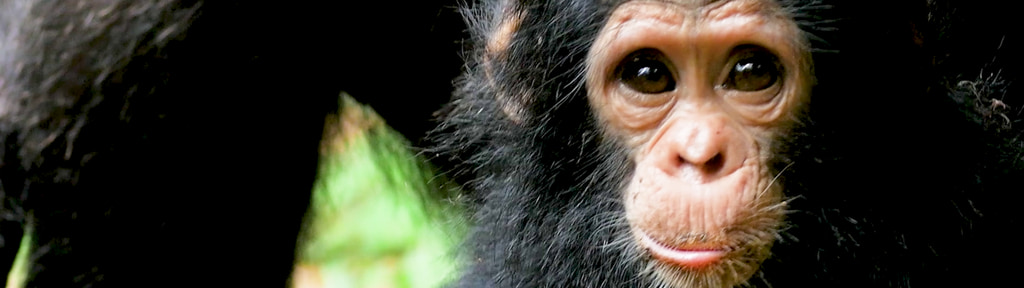
NASA Joins the Jane Goodall Institute to Conserve Chimpanzee Habitat, Earth Information Center Videos
Go to this pageAfter years of forest loss, chimpanzee habitats are recovering. This is, in part, due to a collaboration between NASA and the Jane Goodall Institute (JGI). Using NASA Earth science satellite and other data, the Goodall Institute puts data into the hands of local communities to drive conservation across Africa’s equatorial forest belt.
- ID: 14713 Produced Video

Building Coastal Resilience with NASA Data
Go to this pageThe city of Mobile, AL is working with NASA’s Sea Level Change Team to plan for future infrastructure projects and to protect Mobile’s coastal resources. As sea levels change globally, coastal cities feel the effects of more frequent and more severe storms and flooding. NASA’s sea level change data helps Mobile and other coastal communities plan for a more resilient future.
EIC Beauty Pieces
- Section
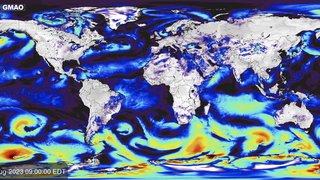
Global Sea Surface Currents and Temperature
Go to this sectionThis visualization shows sea surface current flows. The flows are colored by corresponding sea surface temperature data. This visualization is rendered for display on very high resolution devices like hyperwalls or for print media.This visualization was produced using model output from the joint MIT/JPL project entitled Estimating the Circulation and Climate of the Ocean, Phase II (ECCO2). ECCO2 uses the MIT general circulation model (MITgcm) to synthesize satellite and in-situ data of the global ocean and sea-ice at resolutions that begin to resolve ocean eddies and other narrow current systems, which transport heat and carbon in the oceans. The ECCO2 model simulates ocean flows at all depths, but only surface flows are used in this visualization.
- ID: 4950 Visualization
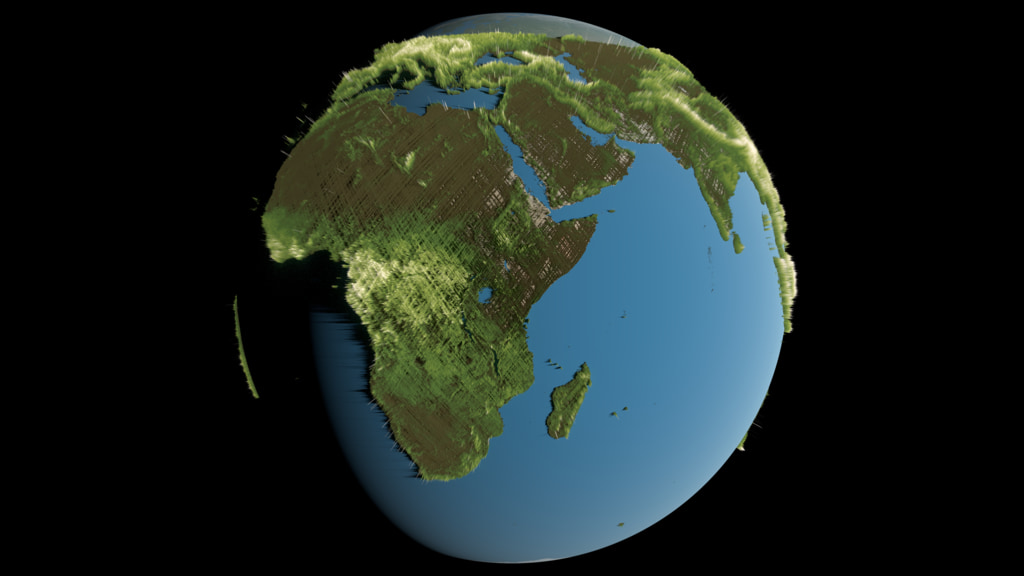
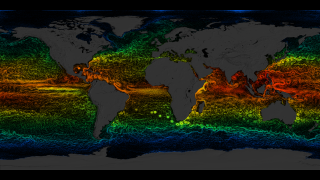
GEDI Forest Height
Go to this pageThis visualization depicts a global view of forest height data collected by the GEDI instrument aboard the International Space Station. Brown and dark green represent shorter vegetation. Bright green and white represent taller vegetation. This visualization uses data collected between April 2019 and April 2020. Height is exaggerated to depict variation at this scale.Coming soon to our YouTube channel. || GEDI_global_w_colorbar_0900_print.jpg (1024x576) [83.4 KB] || GEDI_global_w_colorbar_0900_searchweb.png (320x180) [42.8 KB] || GEDI_global_w_colorbar_0900_thm.png (80x40) [4.0 KB] || GEDI_global_w_colorbar_1080p60.mp4 (1920x1080) [17.7 MB] || GEDI_global_w_colorbar_1080p60.webm (1920x1080) [6.0 MB] || GEDI_global_w_colorbar (3840x2160) [0 Item(s)] || GEDI_global_w_colorbar_2160p30.mp4 (3840x2160) [61.5 MB] || GEDI_global_w_colorbar_2160p60.mp4 (3840x2160) [65.5 MB] || captions_silent.31845.en_US.srt [43 bytes] ||
- ID: 4993 Visualization
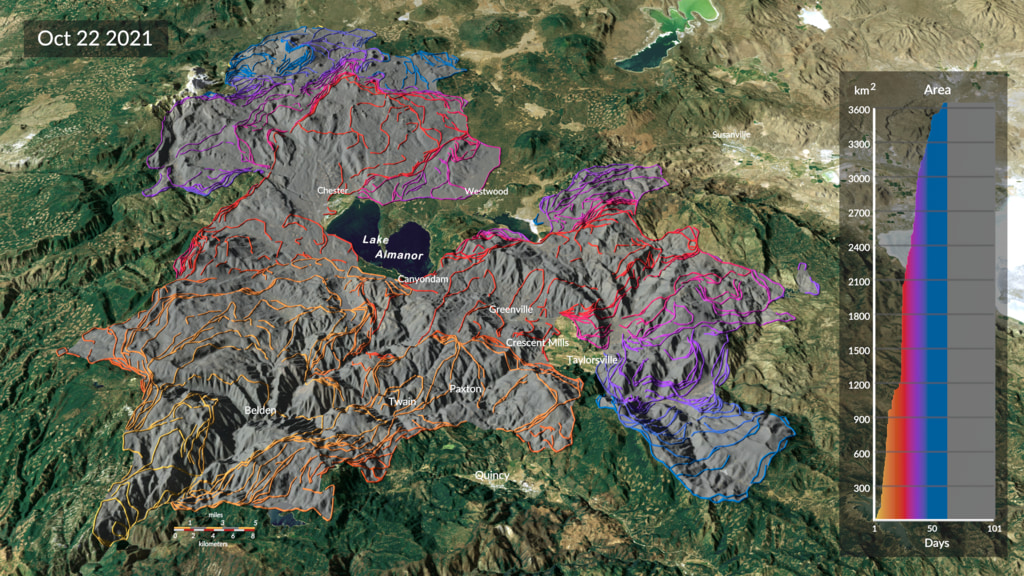
Spread of the Dixie Fire - 2021
Go to this pageThis visualization shows the spread of the Dixie fire between July 14 and October 22, 2021, updated every 12 hours based on new satellite active fire detections. The yellow outlines track the position of the active fire lines for the last 60 hours, with the latest location of the fire front in the brightest shade of yellow. The red points show the location of active fire detections, while the grey region shows the estimated total area burned. The graph shows the cumulative burned area in square kilometers.Coming soon to our YouTube channel. || Dixie_fire_2021.7135_print.jpg (1024x576) [369.5 KB] || Dixie_fire_2021.7135_searchweb.png (320x180) [139.8 KB] || Dixie_fire_2021.7135_thm.png (80x40) [8.3 KB] || Dixie_fire_2021_p30_1080p30.mp4 (1920x1080) [172.9 MB] || Dixie_fire_2021_1080p60.mp4 (1920x1080) [190.8 MB] || 3840x2160_16x9_60p (3840x2160) [0 Item(s)] || captions_silent.32827.en_US.srt [43 bytes] || Dixie_fire_2021_p30_2160p30.mp4 (3840x2160) [477.6 MB] || Dixie_fire_2021_2160p60.mp4 (3840x2160) [513.8 MB] || Dixie_fire_2021_p30_1080p30.mp4.hwshow || Dixie_fire_animation_only_2021_1080p60.hwshow ||
- ID: 4960 Visualization
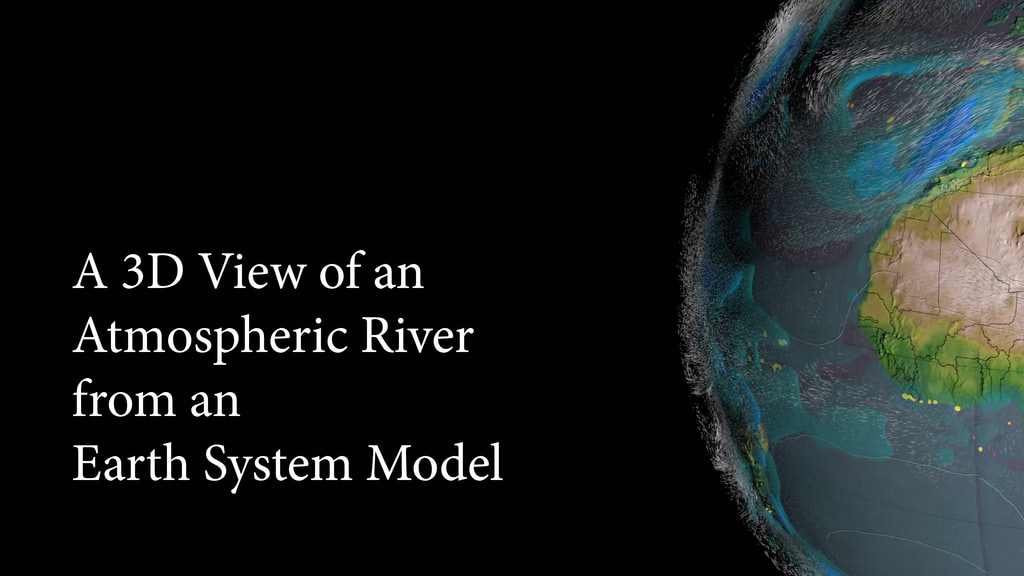
A 3D View of an Atmospheric River from an Earth System Model
Go to this pageNarrated atmospheric rivers movie. || atmos_rivers_narrated_4k.00090_print.jpg (1024x576) [88.5 KB] || atmos_rivers_narrated_4k.00090_print_searchweb.png (320x180) [46.0 KB] || atmos_rivers_narrated_HD.webm (1920x1080) [68.6 MB] || atmos_rivers_narrated_HD.mp4 (1920x1080) [410.9 MB] || atmos_river_narrated_4k.en_US.srt [6.3 KB] || atmos_river_narrated_4k.en_US.vtt [6.3 KB] || atmos_rivers_4k.en_US.vtt [6.3 KB] || atmos_rivers_narrated_4k.mp4 (3840x2160) [646.9 MB] ||
- ID: 5011 Visualization
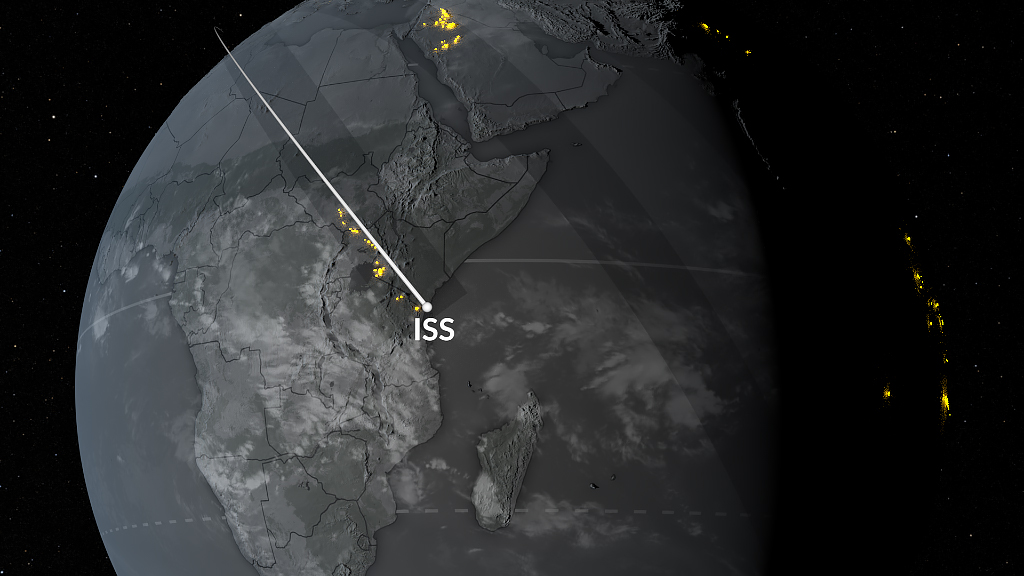
Lightning Events Detected from the International Space Station (ISS) 2017-2023
Go to this pageLightning events detected by the LIS sensor on the ISS between January 2017 and July 2023 using a 10-day roving window. Data is from the quality controlled science dataset. Available resolution in the download menu are 1920x1080, 3840x2160 (4k), and 7680x2160 (created for EIC display). || iss_lightning_preview.jpg (1024x576) [260.7 KB] || iss_lightning_preview_searchweb.png (320x180) [59.3 KB] || iss_lightning_preview_thm.png (80x40) [4.9 KB] || iss_lightning_sphere_07312023.mp4 (1920x1080) [127.0 MB] || iss_lightning_sphere_07312023_60p4k.mp4 (3840x2160) [414.2 MB] || iss_lightning_eic_display_2160p30_h2652.mp4 (7680x2160) [579.9 MB] || iss_lightning_sphere_07312023.mp4.hwshow ||
- ID: 5313 Visualization

Change in Night Lights between 2012 and 2023 - EIC Version
Go to this pageThis global, flat map view of night lights data begins with a time series depicting annual averages from 2012 to 2023. The lights then fade away to reveal night lights change between 2012 and 2023, with regions of more light depicted in purple and regions with less light depicted in orange. The sequence then repeats with pop-out, zoomed-in views of India, Ukraine, Western Europe, and the Eastern Mediterranean region. || nightlights_flat_series_and_change_wZooms_13_EIC.02599_print.jpg (1024x288) [62.0 KB] || nightlights_flat_series_and_change_wZooms_13_EIC.02599_searchweb.png (320x180) [49.9 KB] || nightlights_flat_series_and_change_wZooms_13_EIC.02599_thm.png (80x40) [4.6 KB] || nightlights_2012-2023_change_flat_eic [0 Item(s)] || nightlights_flat_series_and_change_wZooms_13_EIC_2160p30_h265.mp4 (7680x2160) [32.7 MB] || nightlights_flat_series_and_change_wZooms_13_EIC_prores.mov (7680x2160) [4.0 GB] ||
- ID: 5196 Visualization
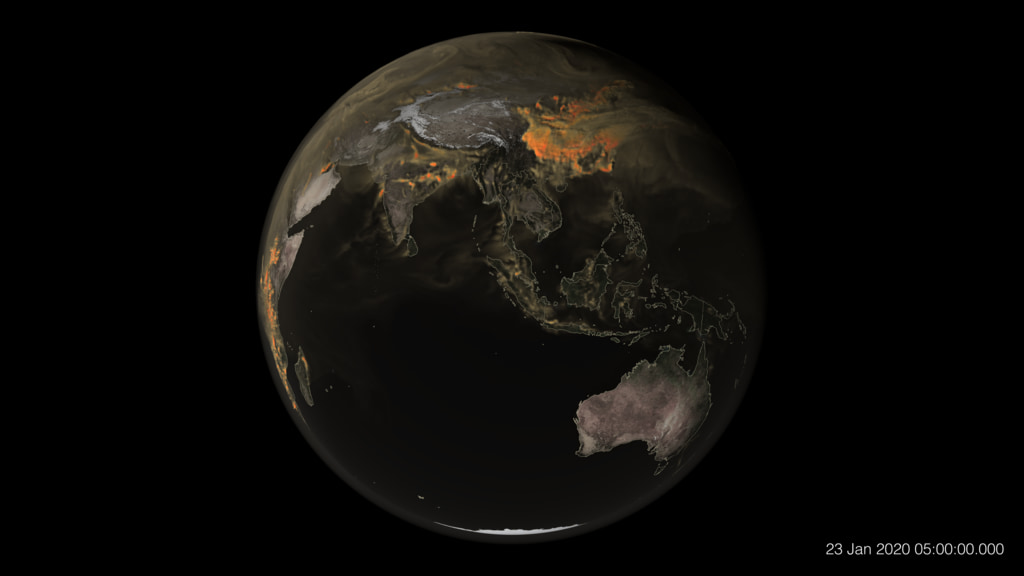
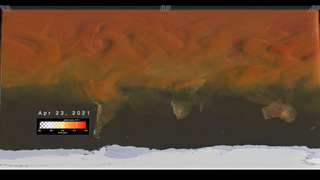
DYAMOND Global Carbon Dioxide
Go to this pageGlobal CO2 ppm for January-March of 2020. This camera move orbits the Earth from a distance. || dyamondPointCloud_12-1-2023b_dyamond_co2_anim_globe_orbit_3x3Hyperwall.00200_print.jpg (1024x576) [46.2 KB] || dyamondPointCloud_12-1-2023b_dyamond_co2_anim_globe_orbit_3x3Hyperwall.00200_searchweb.png (320x180) [31.3 KB] || dyamondPointCloud_12-1-2023b_dyamond_co2_anim_globe_orbit_3x3Hyperwall.00200_web.png (320x180) [31.3 KB] || dyamondPointCloud_12-1-2023b_dyamond_co2_anim_globe_orbit_3x3Hyperwall.00200_thm.png (80x40) [3.0 KB] || dyamondPointCloud_12-1-2023b_dyamond_co2_anim_globe_orbit_1080p30_h265.mp4 (1920x1080) [6.9 MB] || dyamondPointCloud_12-1-2023b_dyamond_co2_anim_globe_orbit_3x3Hyperwall (5760x3240) [0 Item(s)] || dyamondPointCloud_12-1-2023b_dyamond_co2_anim_globe_orbit_2160p30.mp4 (3840x2160) [68.4 MB] ||
- ID: 5425 Visualization
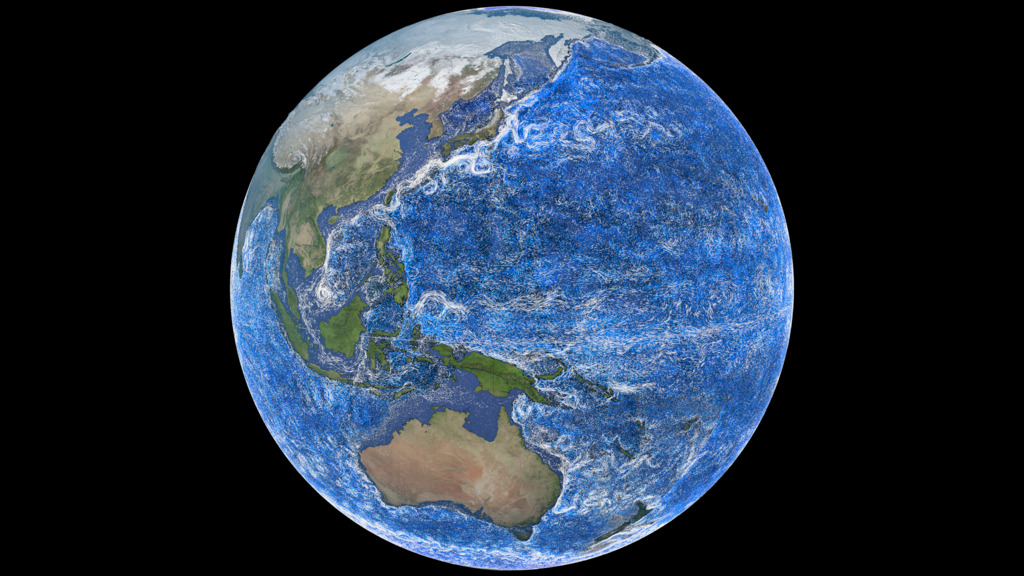
Perpetual Ocean 2: Western Boundary Currents
Go to this pageThis is the 'beauty shot version' of Perpetual Ocean 2: Western Boundary Currents. The visualization starts with a rotating globe showing ocean currents. The camera then zooms into the Kuroshio current, moves over the Indian Ocean to the Agulhas Current, then over to the Gulf Stream. The flows from the surface down to 600 meters deep are all white. Flows below 600 meters depth use the blue-cyan-white color table below.
- ID: 5533 Visualization
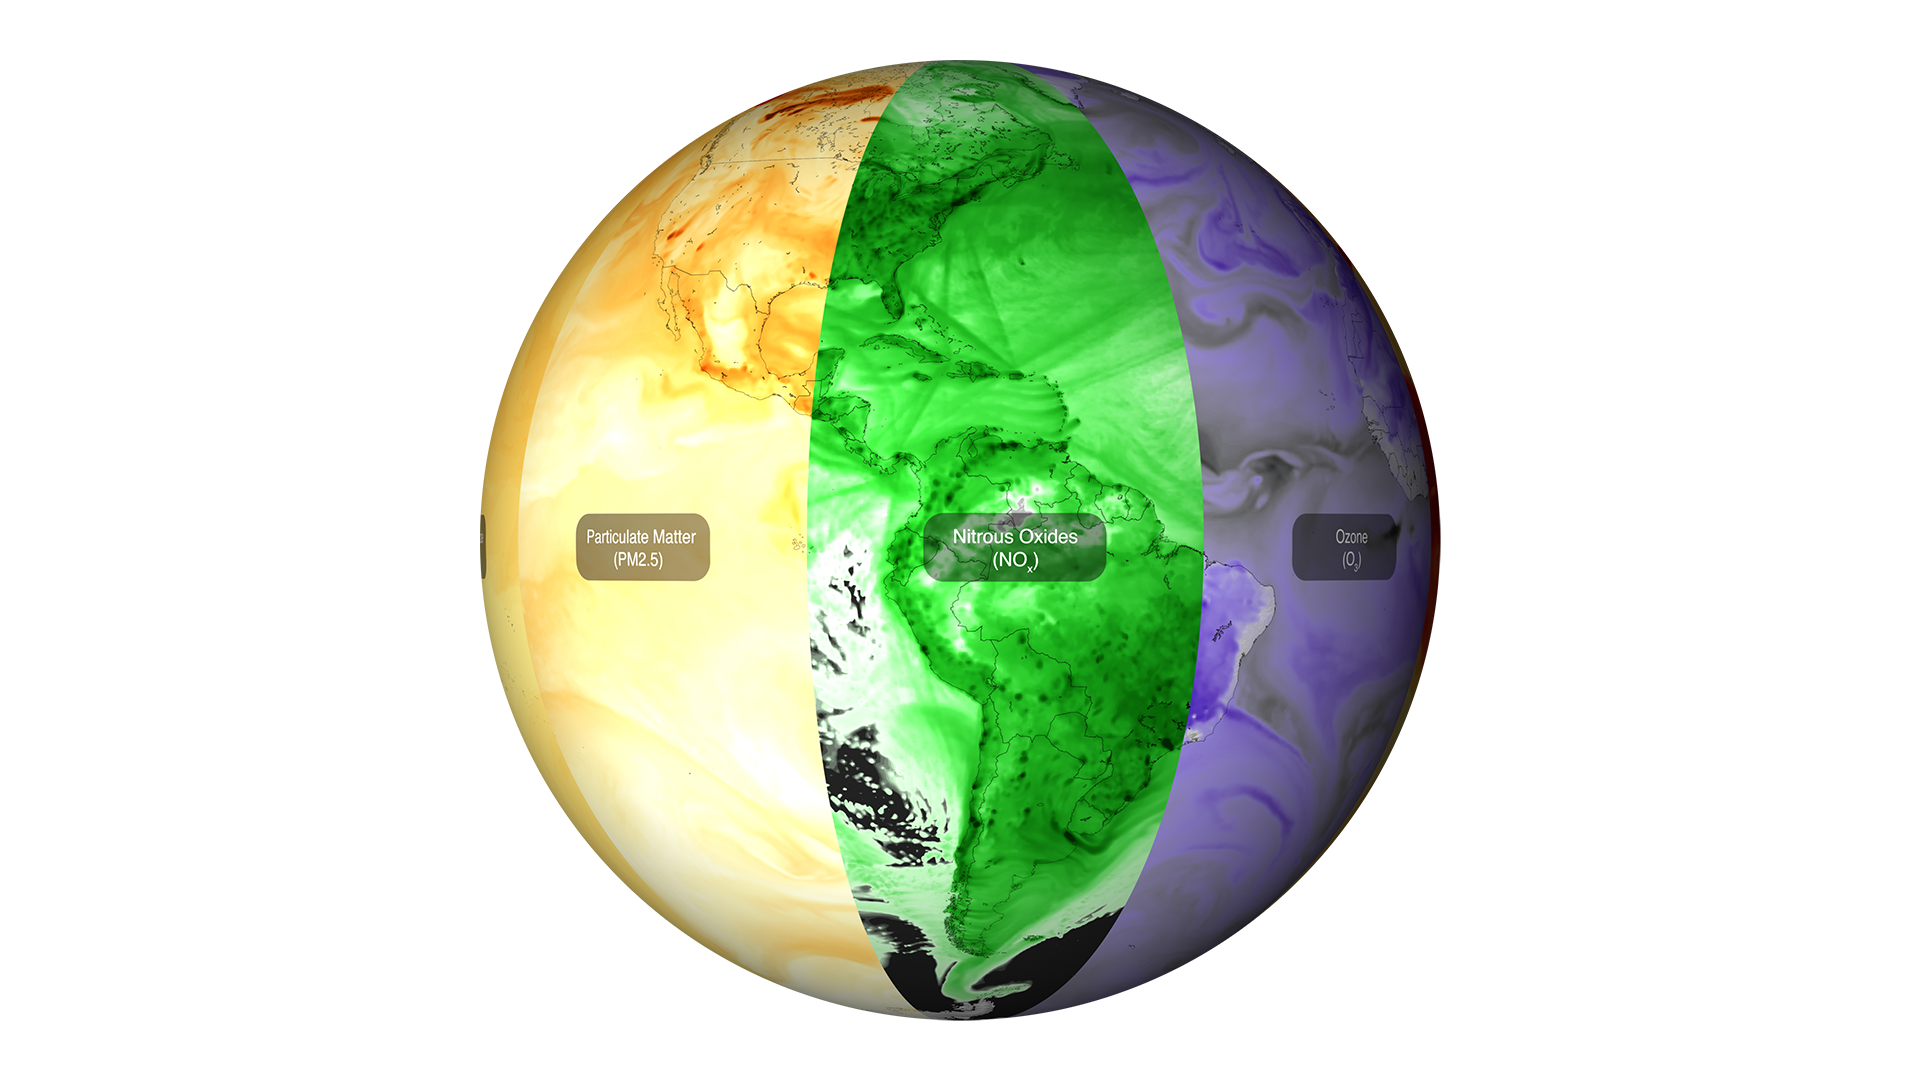
Air Quality Model Runs
Go to this pageNASA utilizes satellite instruments and models to monitor sources of air pollutants and their movement through the atmosphere. This visualization shows concentrations of air pollutants, such as Particulate Matter (PM2.5, fine particles smaller than 2.5 micrometers), Ozone (O3), Carbon Monoxide (CO), and Nitrogen Oxides (NOx) as they are tracked from NASA's Goddard Earth Observing System Composition Forecasting (GEOS-CF) system.
Media Resources
- ID: 14371 B-Roll

Earth Information Center Media B-Roll
Go to this pageThe Earth Information Center is a physical and virtual space that showcases NASA Earth information and how our partners and everyday people use Earth observations to solve our planet’s most pressing issues. It provides a view of our home planet down to local neighborhoods, from outer space. It shows how our planet is changing and provides easy-to-use information and resources we need to mitigate, adapt, and respond to climate change. The Earth Information Center at NASA’s headquarters building is a physical space that includes various parts: an Earth Pulse sculpture of lights showing NASA Earth data, a Hyperwall that showcases awe-inspiring visualizations and stories told by people using NASA Earth data, the Space for Earth immersive experience surrounding you with science, and an Eyes on Earth interactive kiosk.Images of the June 21, 2023 ribbon cutting ceremony can be found on the NASA Flickr account ||
Daily Visualizations
- ID: 40512 Gallery
Daily Visualizations
Go to this pageThis gallery brings together the data visualizations that are updated daily for NASA's Earth Information Center (EIC).