ABoVE
Overview
The Arctic Boreal Vulnerability Experiment, or ABoVE, is a NASA-led, 10-year field experiment designed to better understand the ecological and social consequences of environmental change in one of the most rapidly changing regions on Earth. Satellite, airborne, and ground observations across Alaska and Canada will help us better understand the local and regional effects of changing forests, permafrost, and ecosystems – and how these changes could ultimately affect people and places beyond the Arctic.
General Scenery
 Link
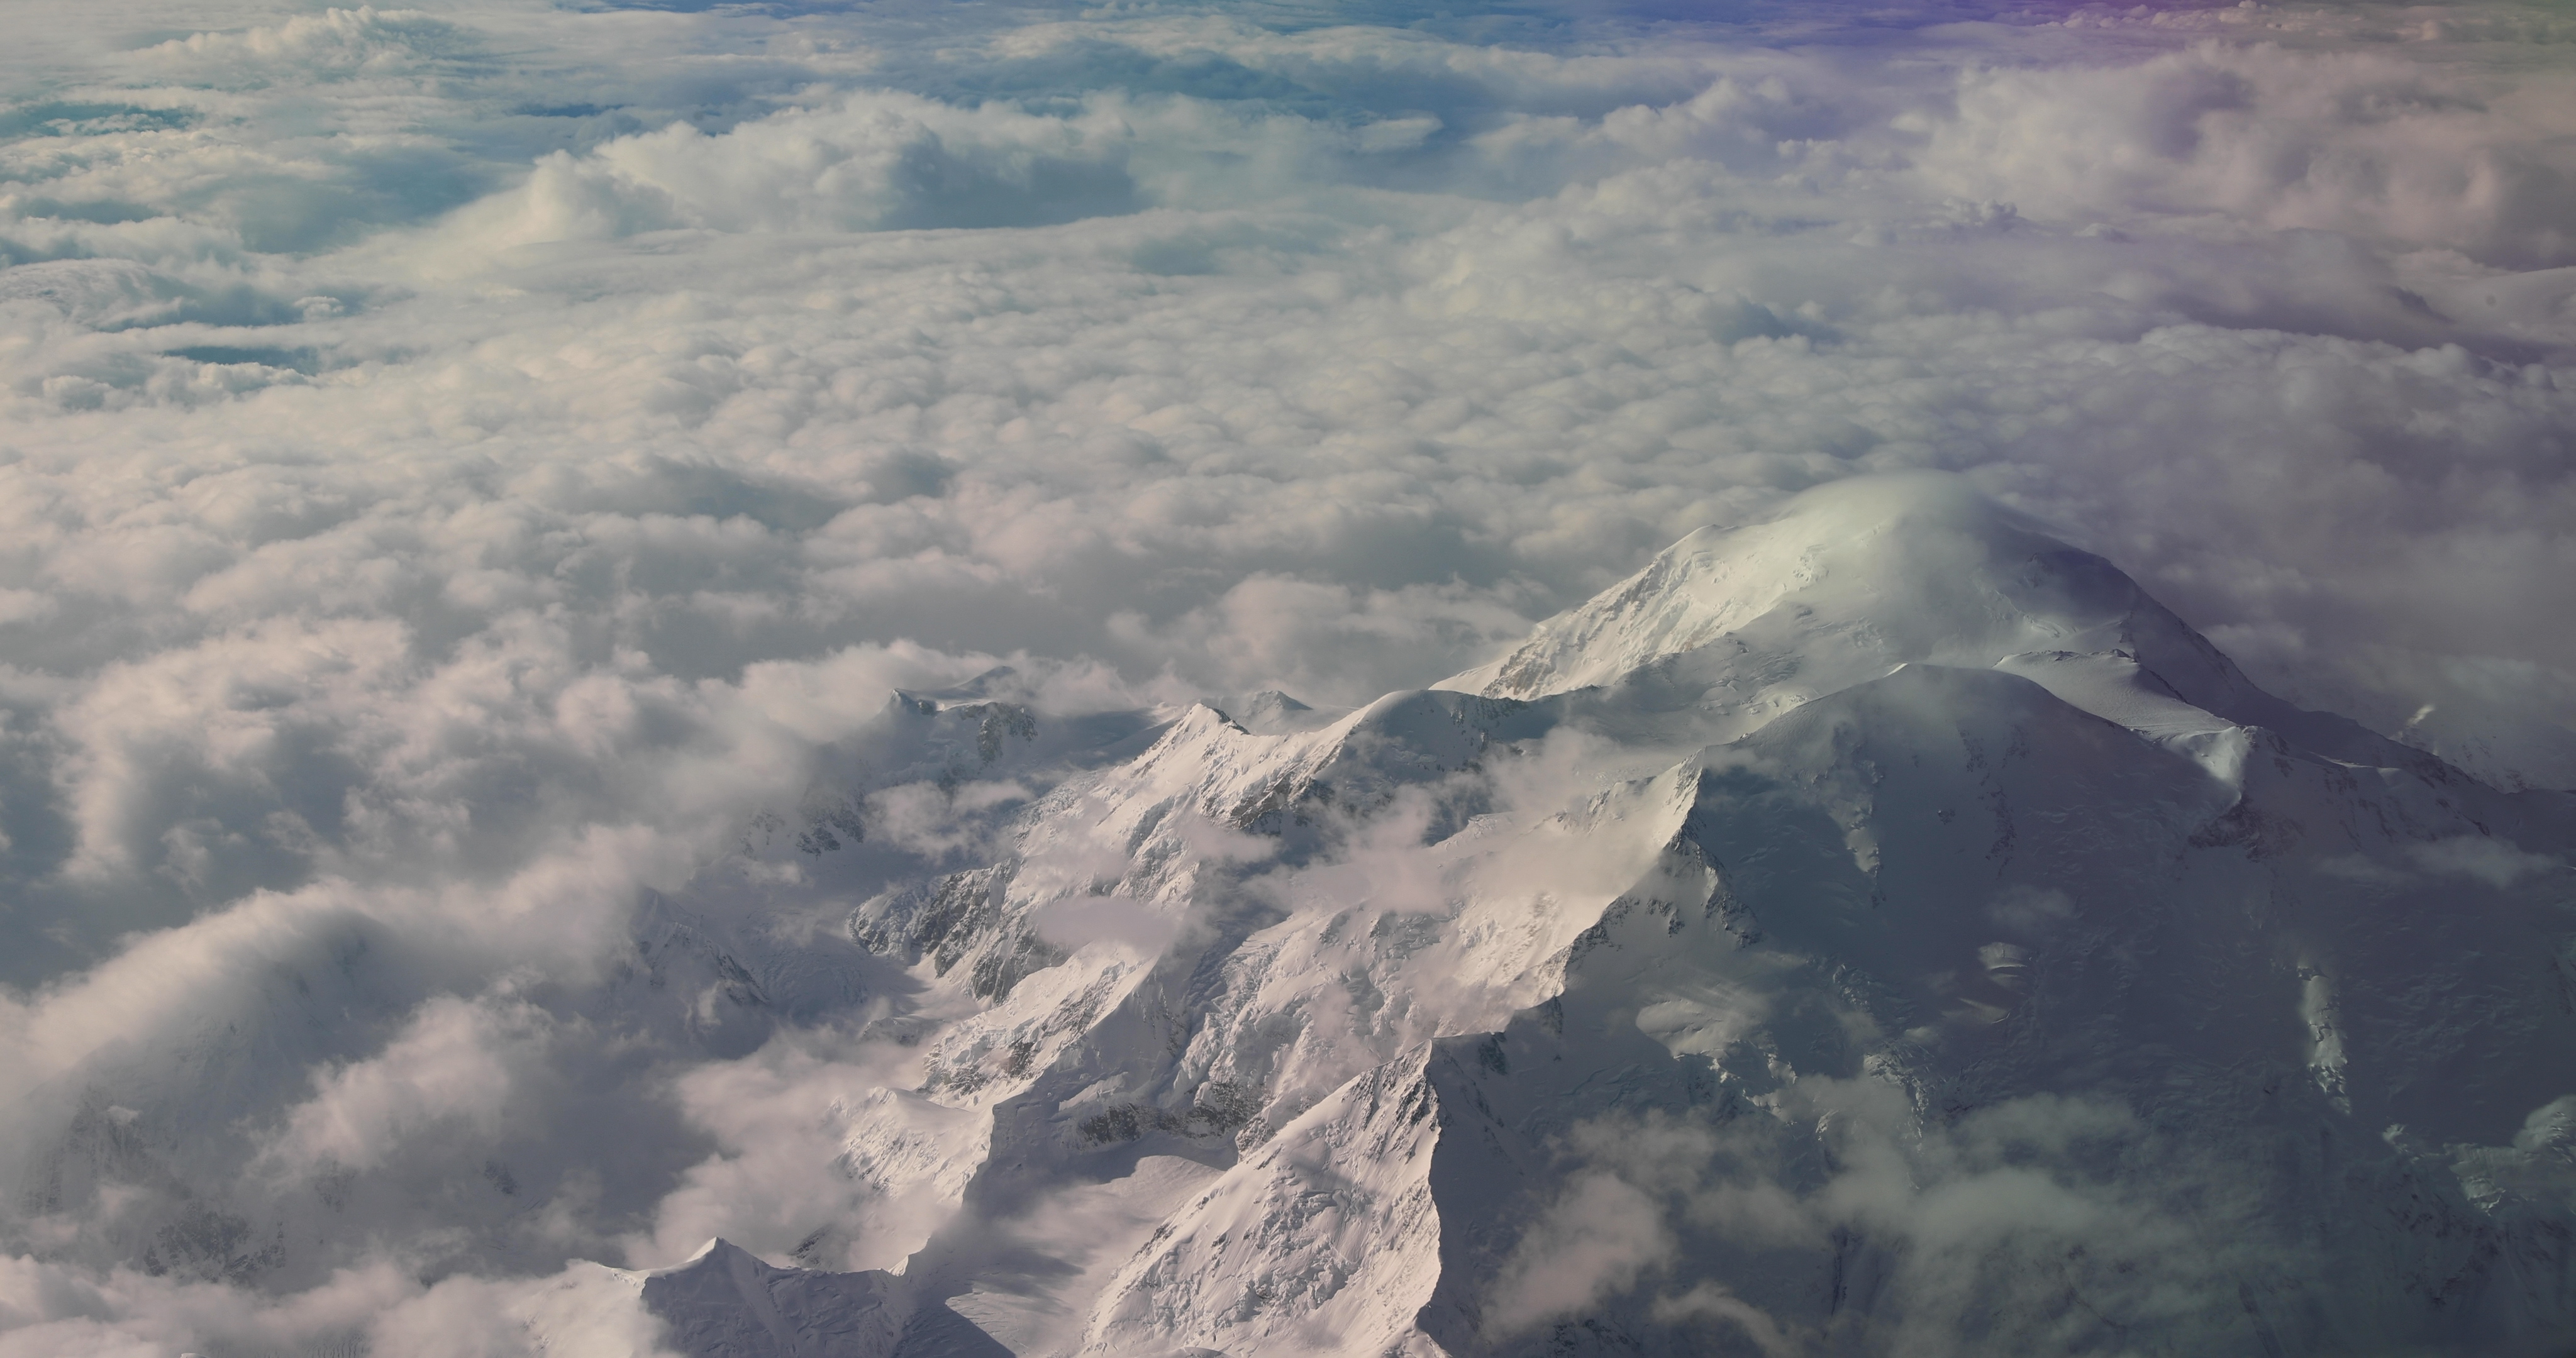
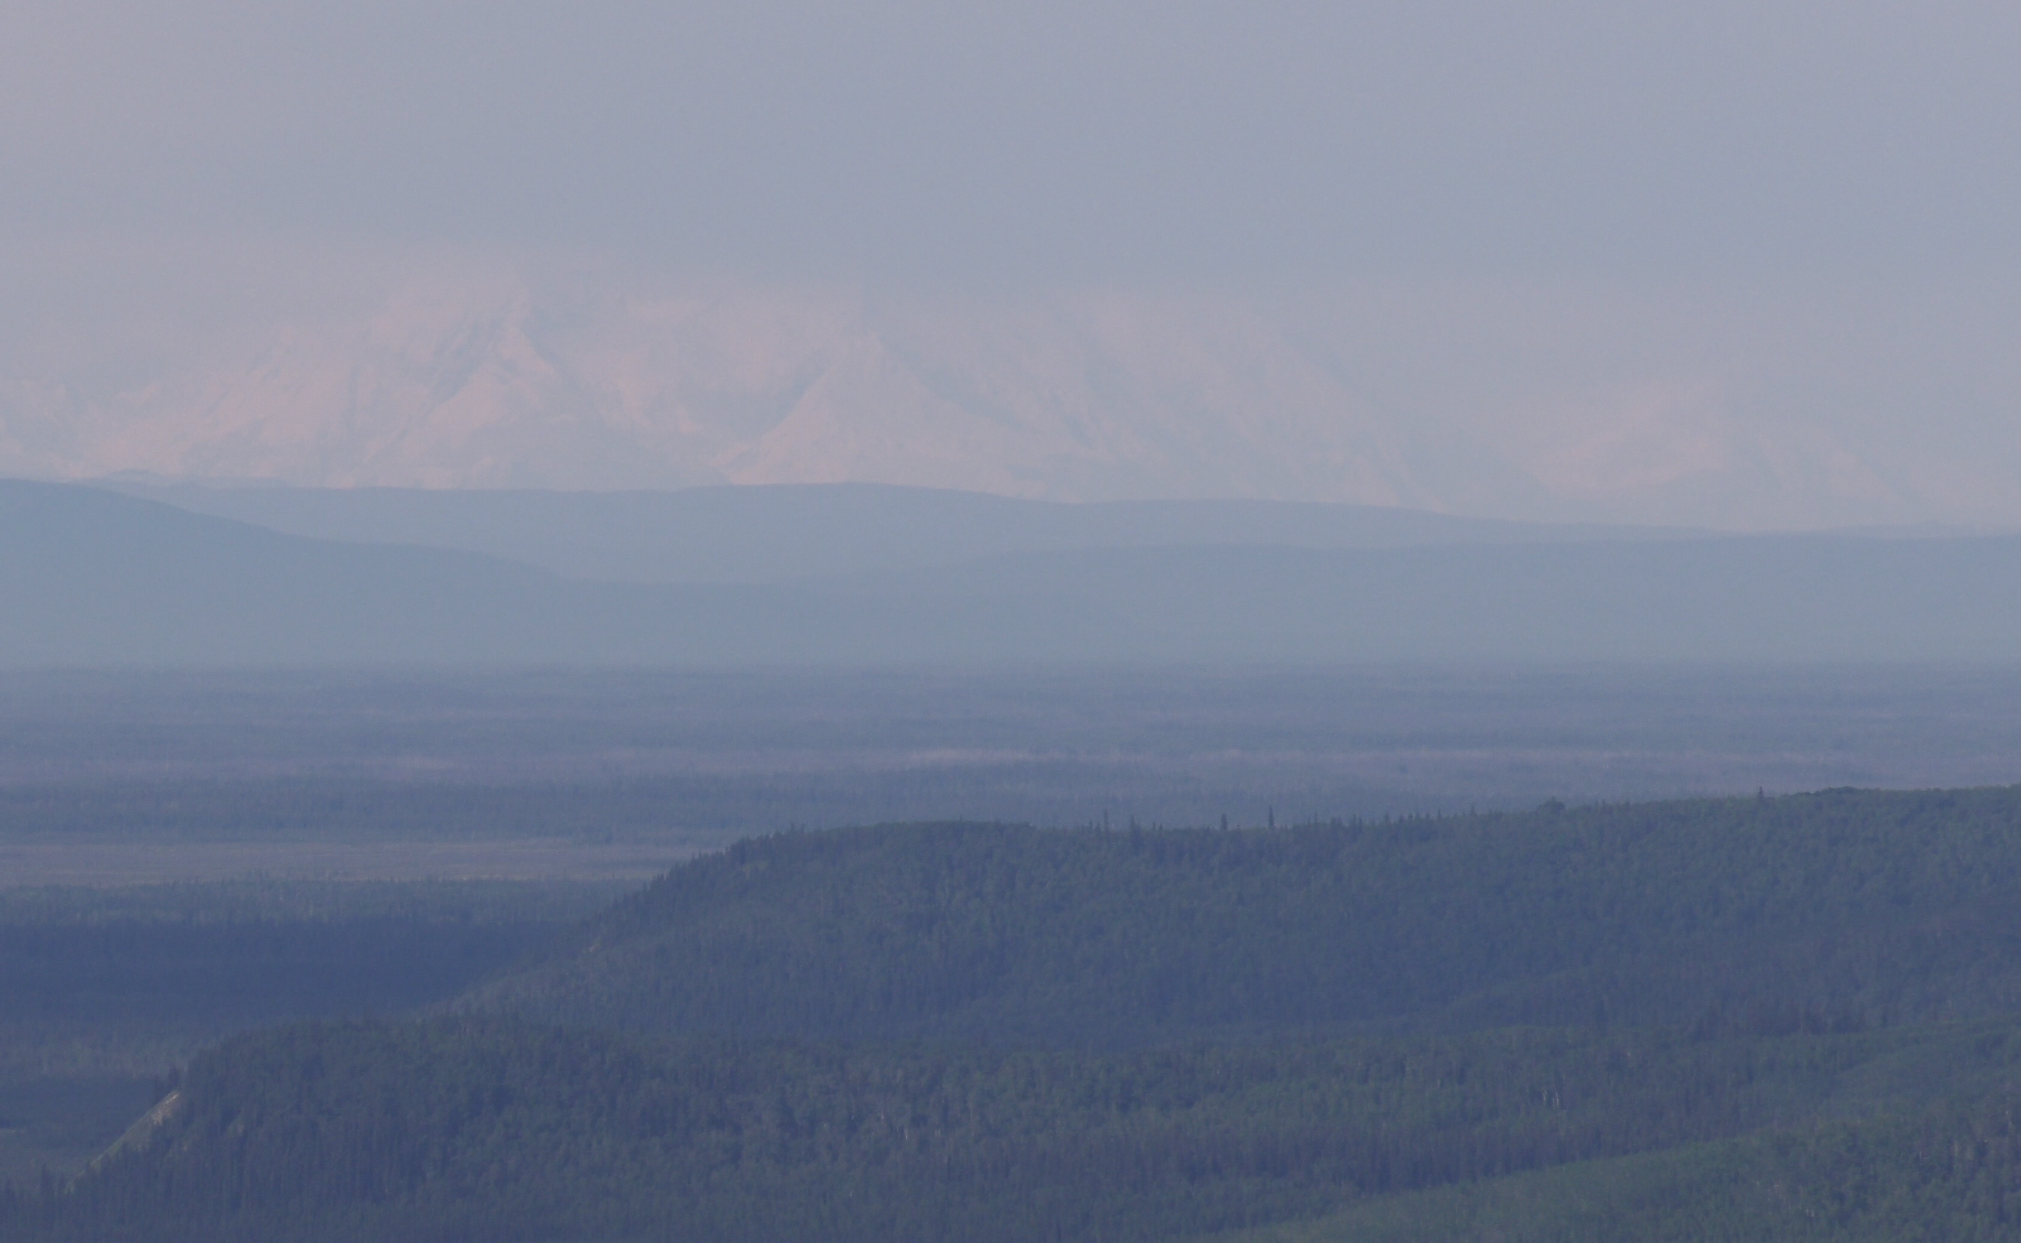
LinkDenali as seen From NASA's Gulfstream-V aircraft
NOTE: The audio on this clip varies widely and includes loud noise. We advise turning down/off sound when previewing this item.
Go to this link

Airborne Science
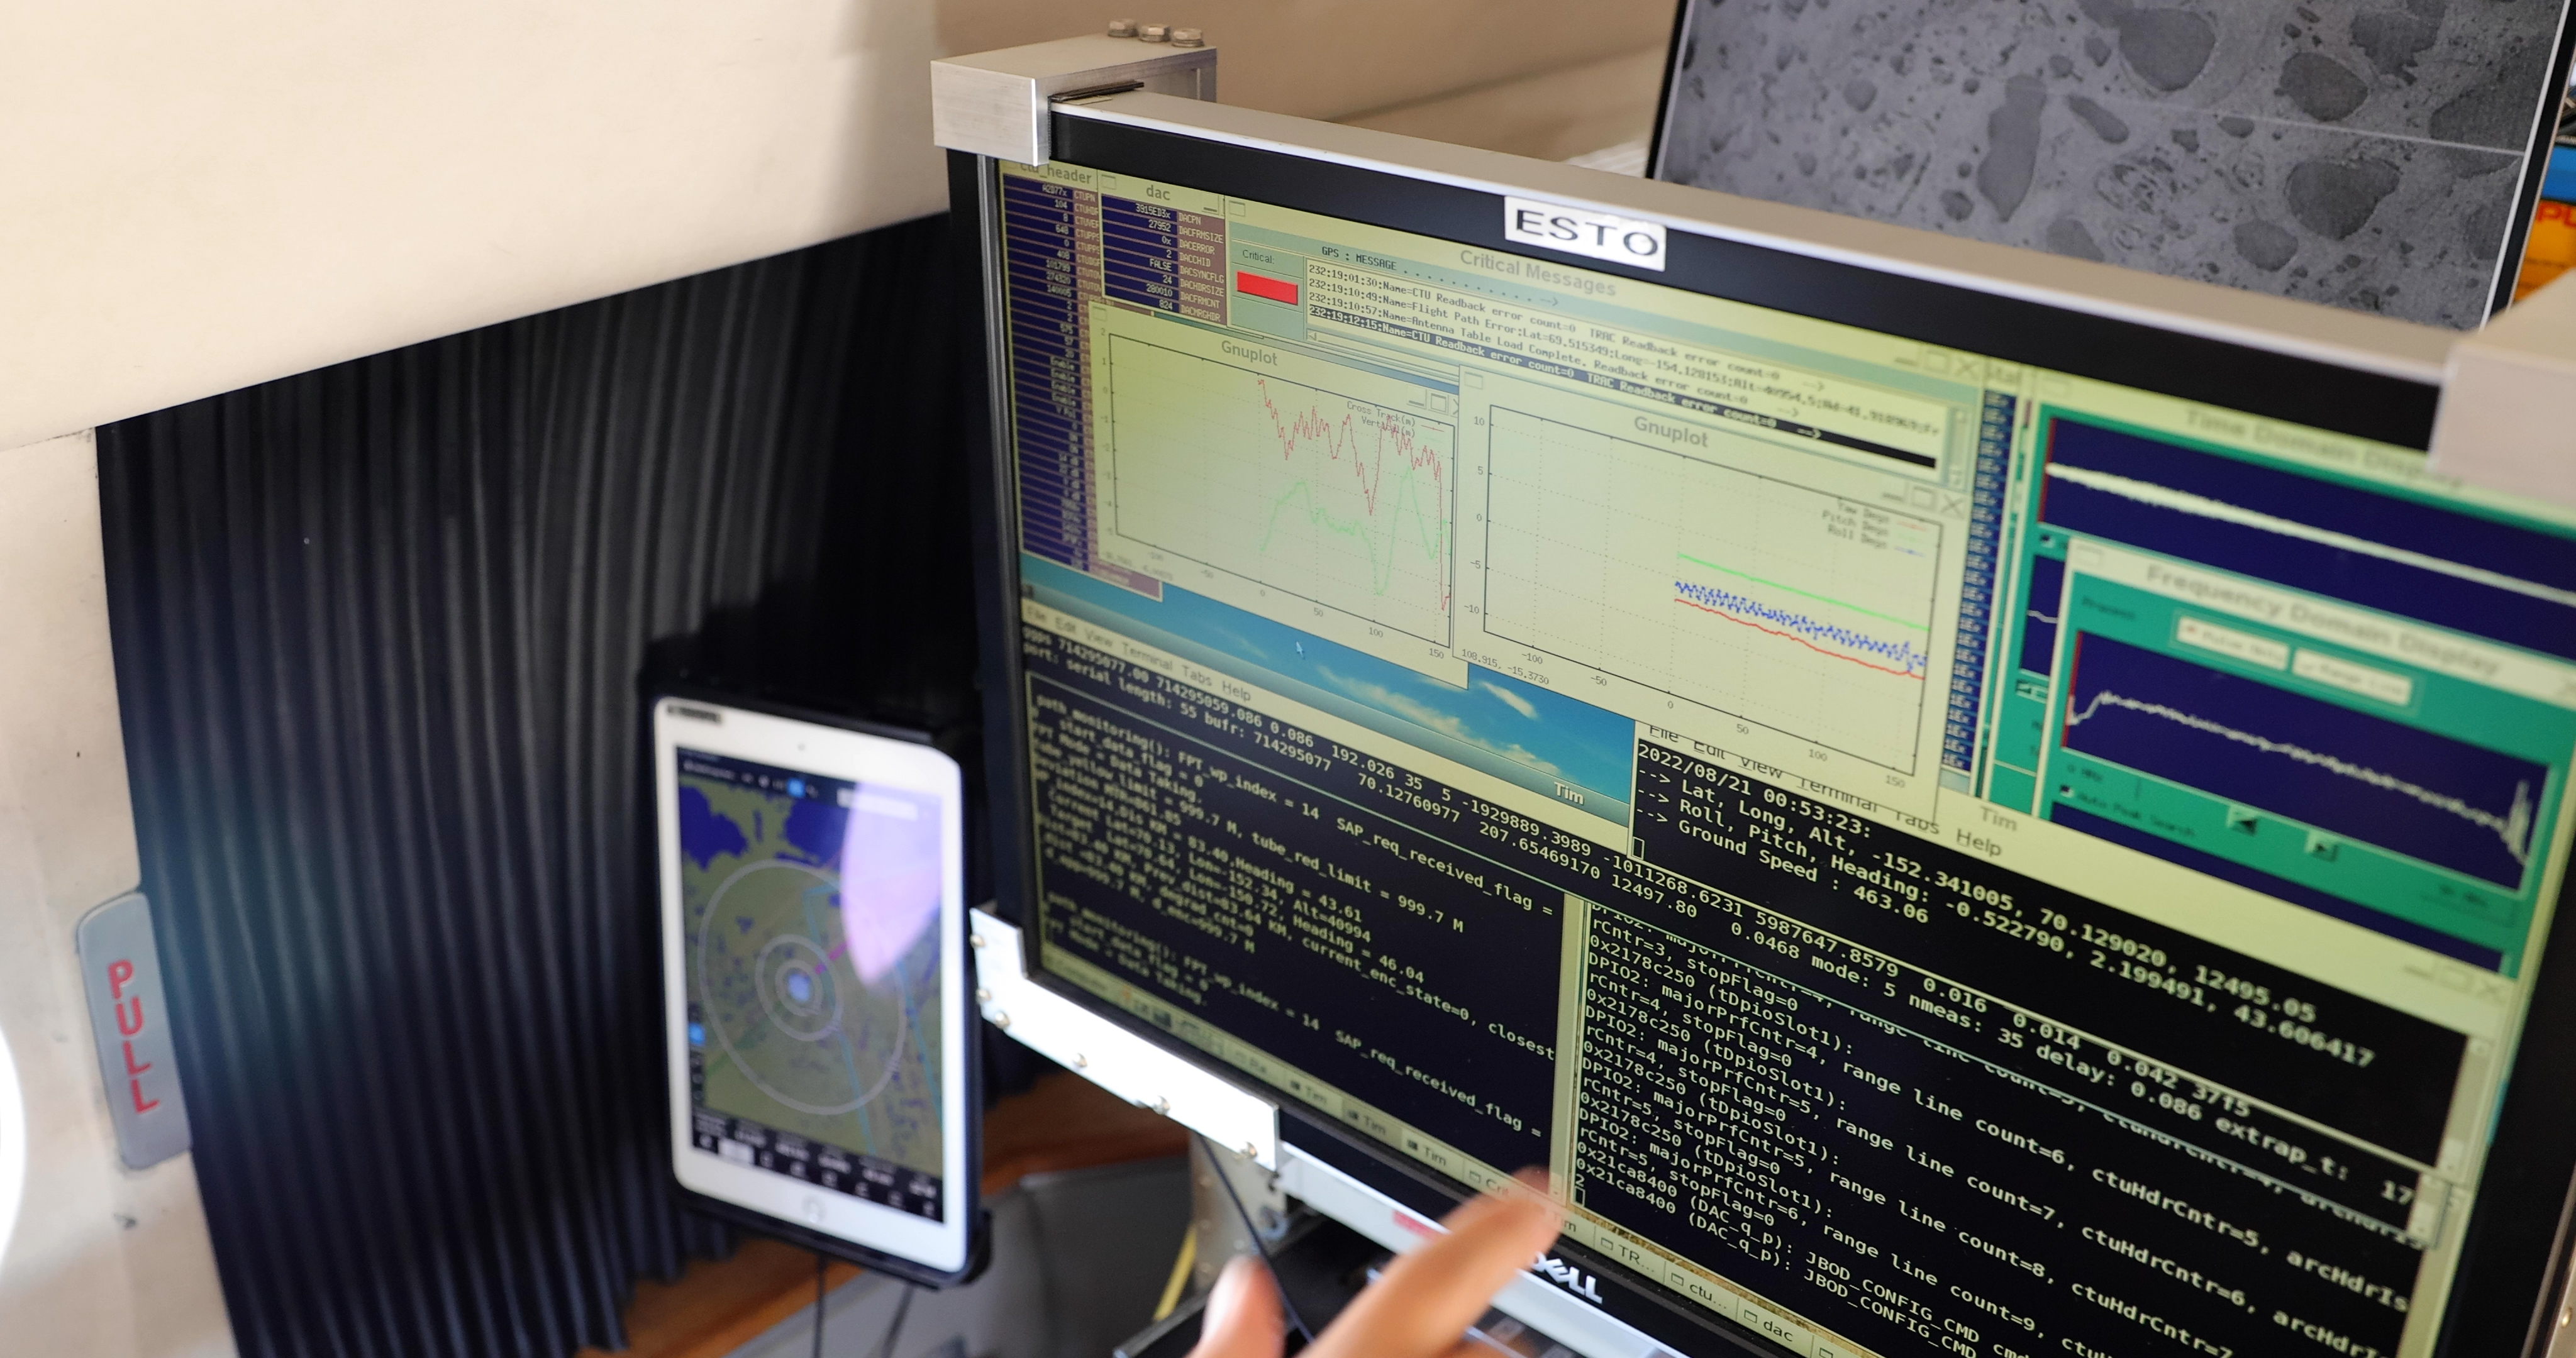
A primary component of ABoVE's study includes an intensive series of research flights. Aircrafts outfitted with a variety of sensors fly primarily from Fairbanks, Alaska and Yellowknife, Canada. This ambitious airborne campaign seeks to capture new insights into vegetation structure and function, permafrost thaw, and the exchange of water vapor, energy, carbon dioxide and methane between land-water surface and the atmosphere.
 Link
LinkFootage selects from ABoVE's UAVSAR flights over Fairbanks, Alaska. Featuring Dr. Liz Hoy and Dr. Chip Miller.
NOTE: The audio on this clip varies widely and includes loud noise. We advise turning down/off sound when previewing this item.
Go to this link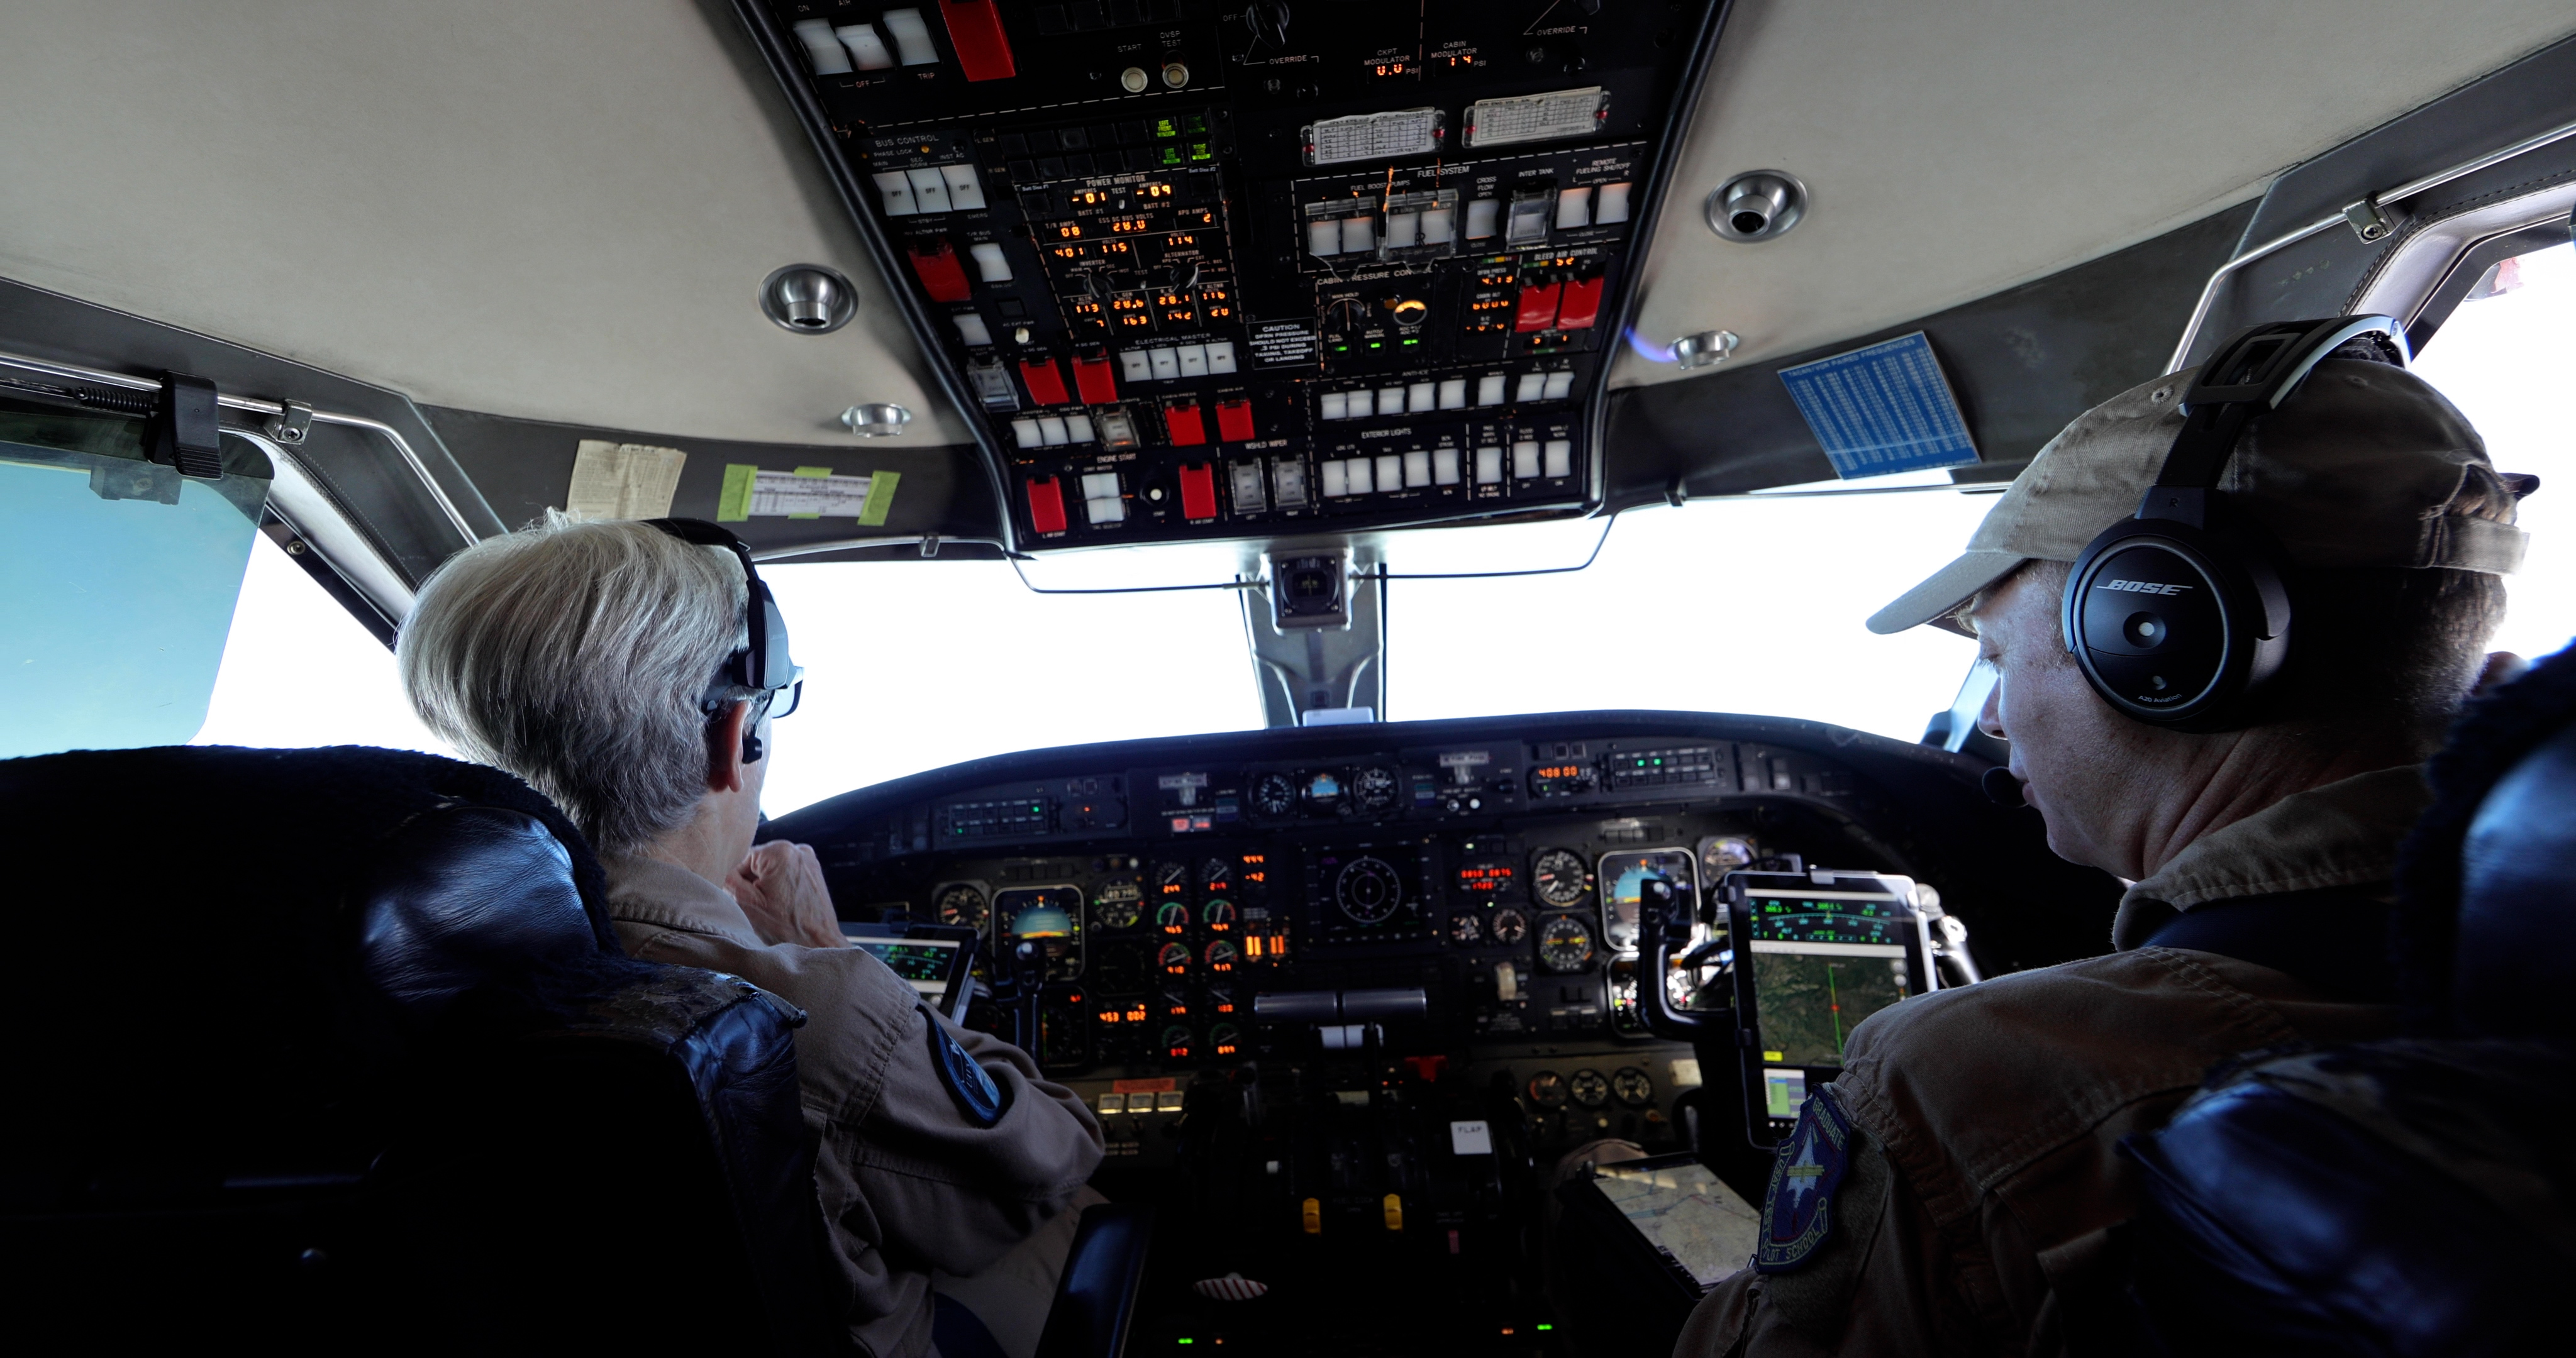
 Link
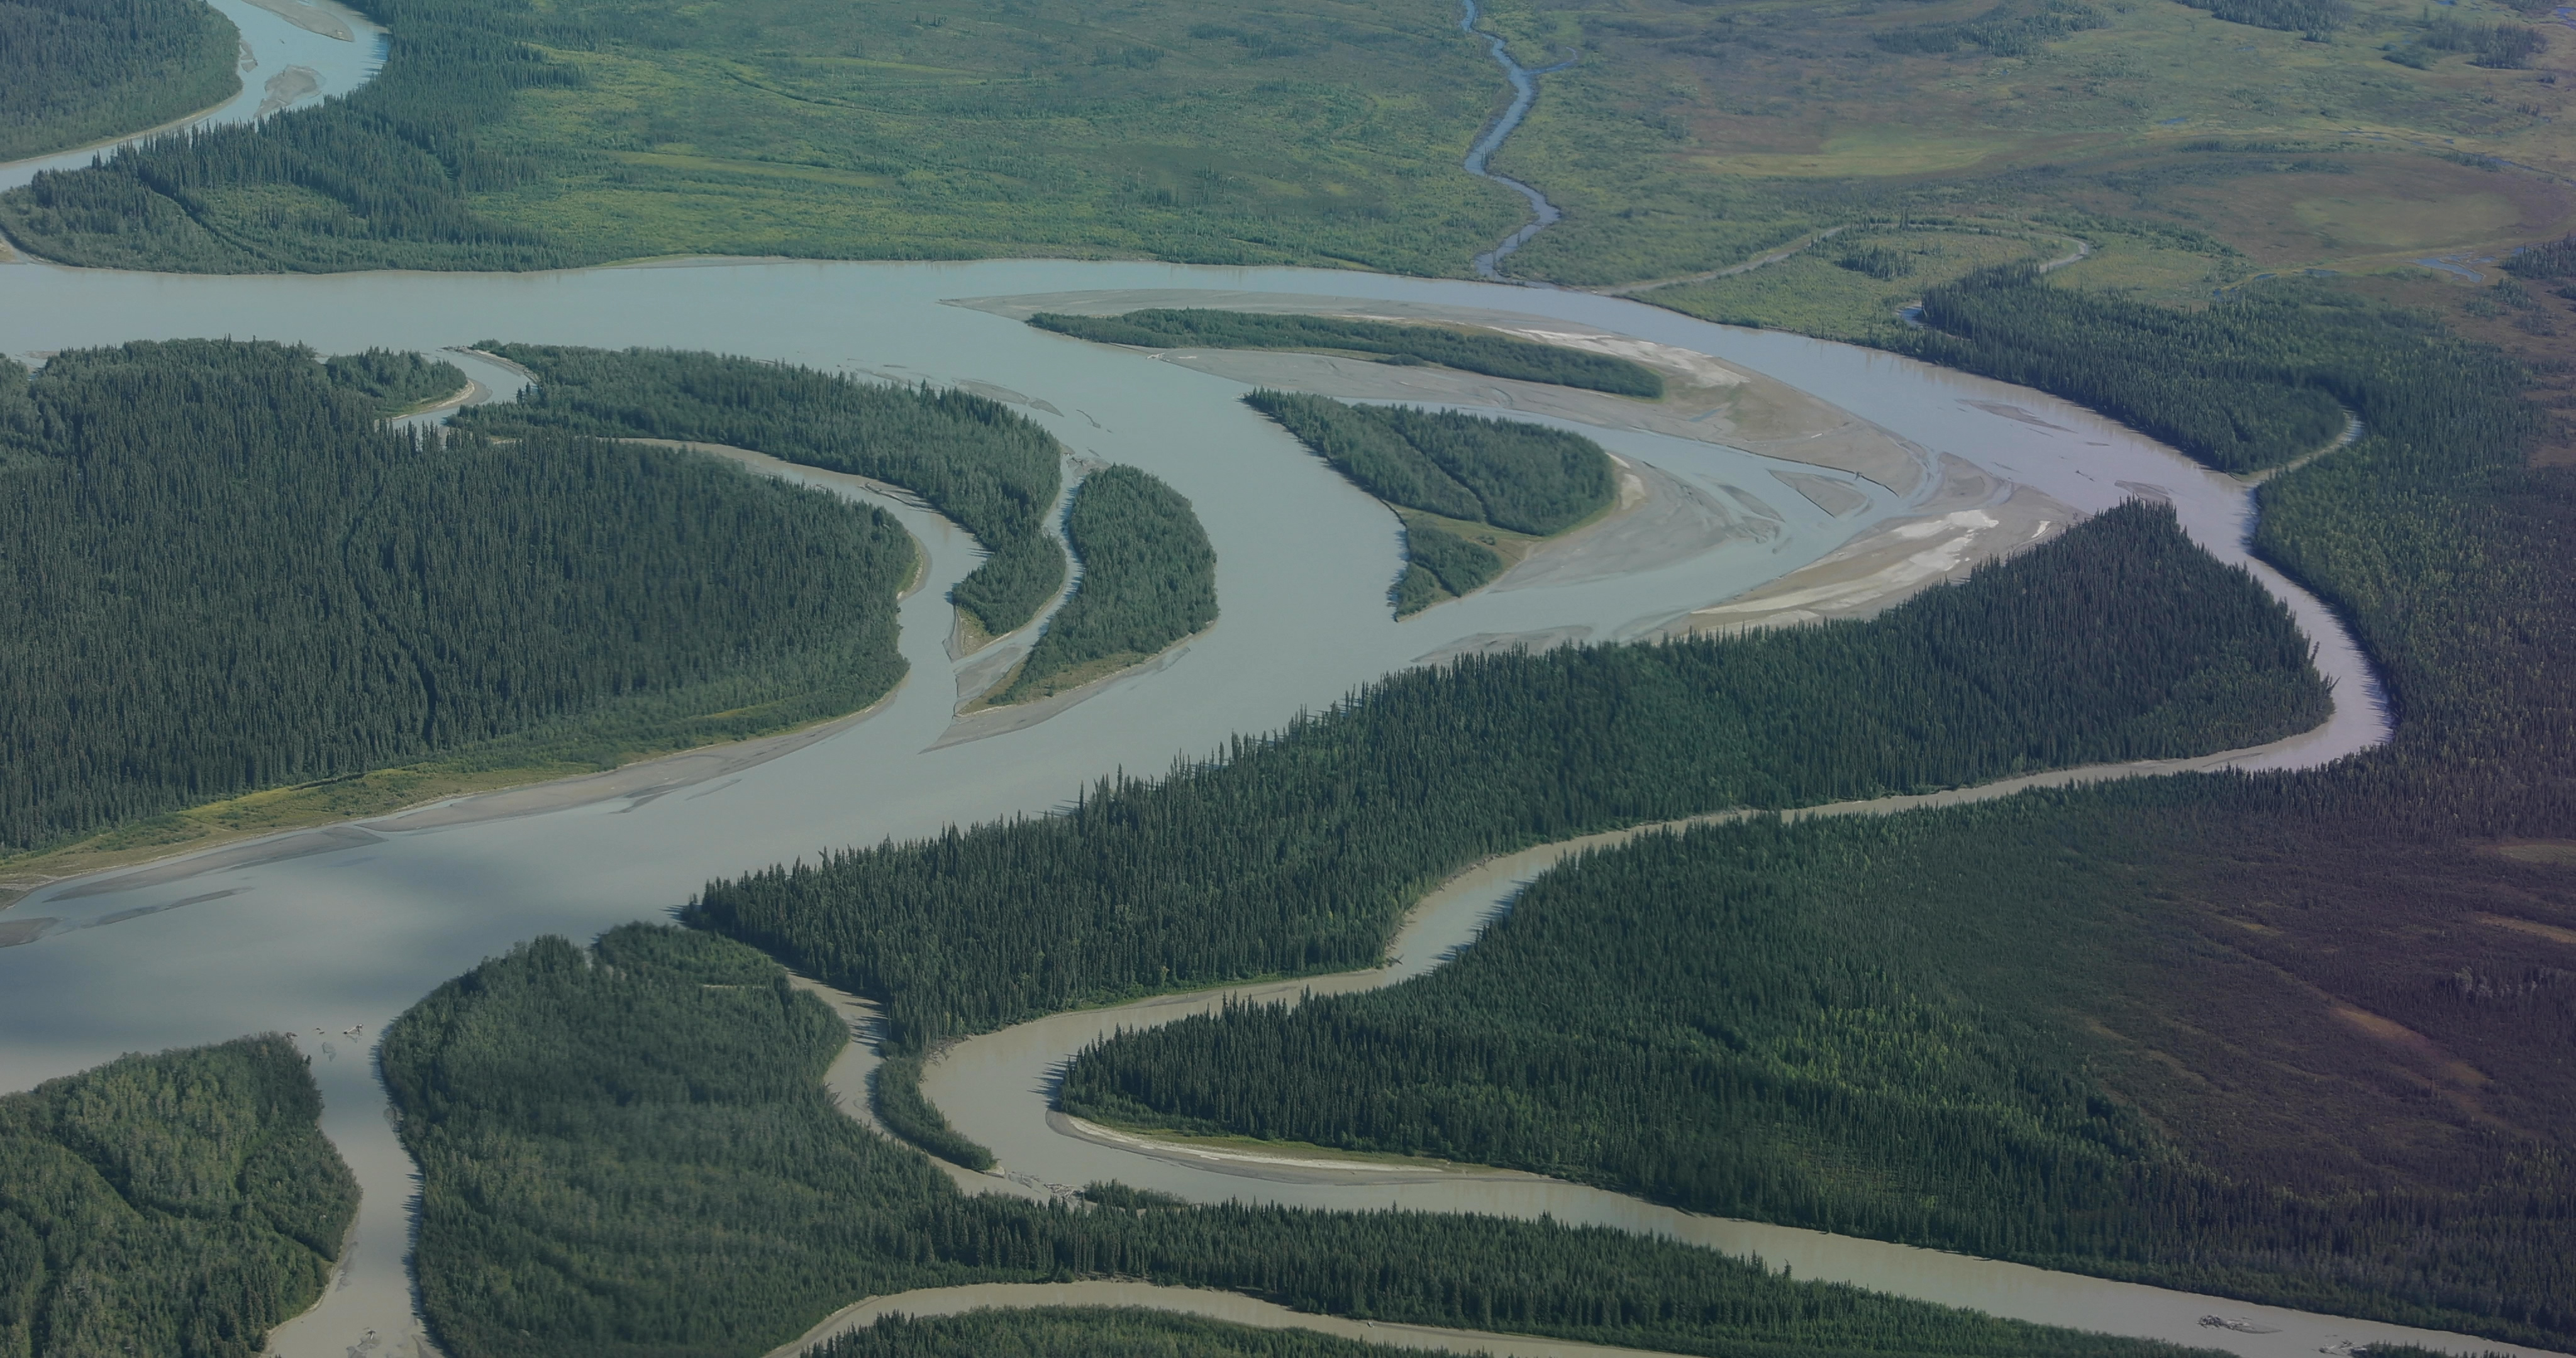
LinkLandscape outside of Fairbanks, Alaska as seen from NASA's Gulfstream-V aircraft
NOTE: The audio on this clip varies widely and includes loud noise. We advise turning down/off sound when previewing this item.
Go to this link- ID: 31219 Hyperwall Visual
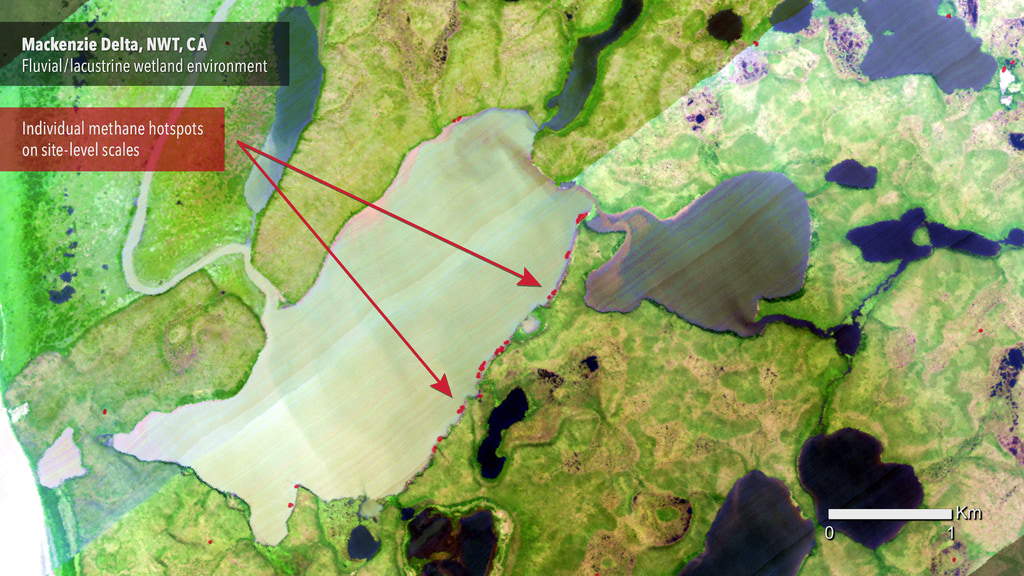
ABoVe Methane Airborne
Go to this pageABoVE video and visualization || ABoVe_Methane_airborne.00180_print.jpg (1024x576) [298.9 KB] || ABoVe_Methane_airborne.00180_searchweb.png (320x180) [121.2 KB] || ABoVe_Methane_airborne.00180_thm.png (80x40) [7.7 KB] || ABoVE-update_1080p30.webm (1920x1080) [17.1 MB] || ABoVE-update_1080p30.mp4 (1920x1080) [131.4 MB] || v2 (3840x2160) [0 Item(s)] || ABoVE-update_2160p30.mp4 (3840x2160) [426.5 MB] ||
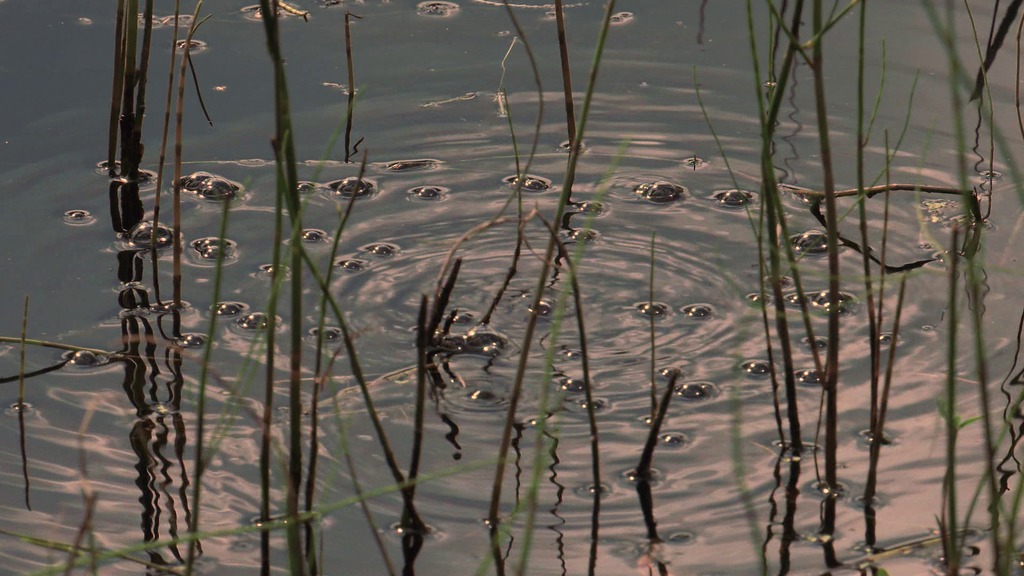
Methane Lakes
Many lakes in the boreal regions of Alaska are emitting methane, the product of decomposing organic matter left over from the Ice Age. Thawing permafrost has caused areas of land to slump and fill up with water, creating these bodies of water called thermokarst lakes. The water then exacerbates the thawing, expanding the size of the lake and producing even more methane. In the early cold season, ice covers the lakes and traps methane in large pockets just beneath the surface. University of Alaska Fairbanks scientists, working as part of the ABoVE campaign, find and measure the methane gas in these pockets seep-by-seep and lake-by-lake. ABoVE combines precise methane measurements from individual lakes with satellite data that can monitor lakes like these across the Arctic, to accurately model how much methane sub-lake seeps are adding to the atmosphere.
Arctic & Boreal Fires
 Link
LinkFootage selects from fire scar at Murphy Dome - outside of Fairbanks, Alaska.
Featuring Dr. Liz Hoy, Senior Scientist for NASA's ABoVE mission.
Go to this link
No Sound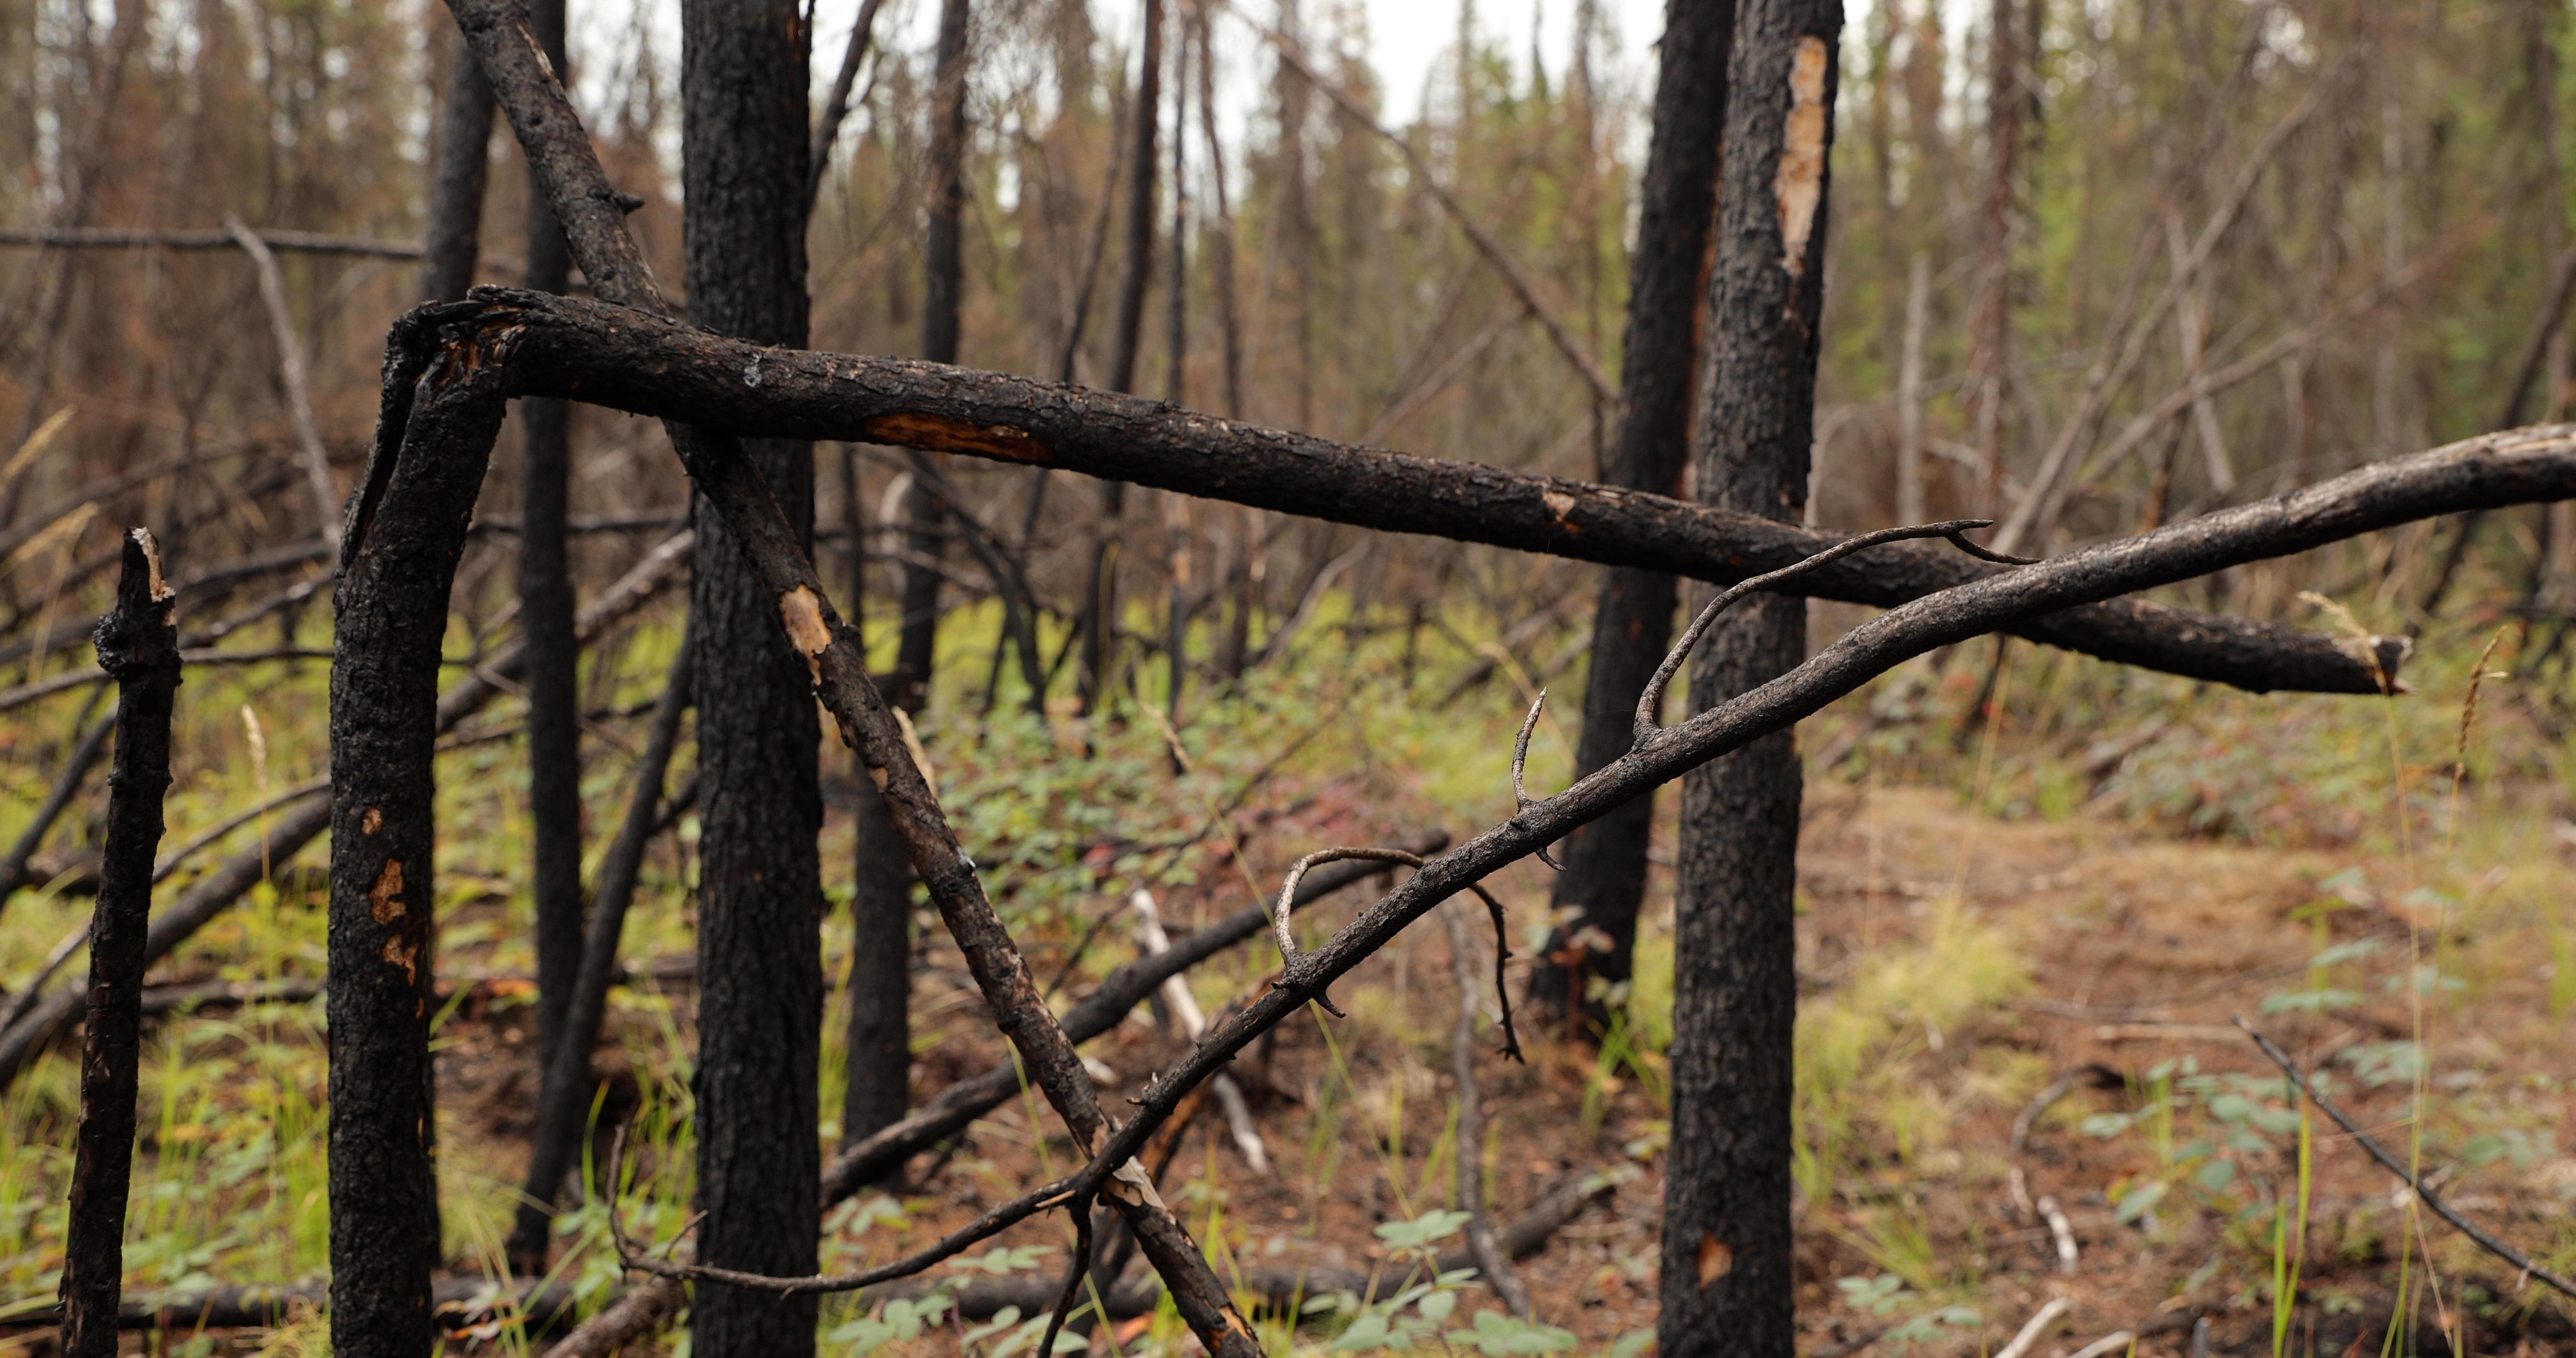

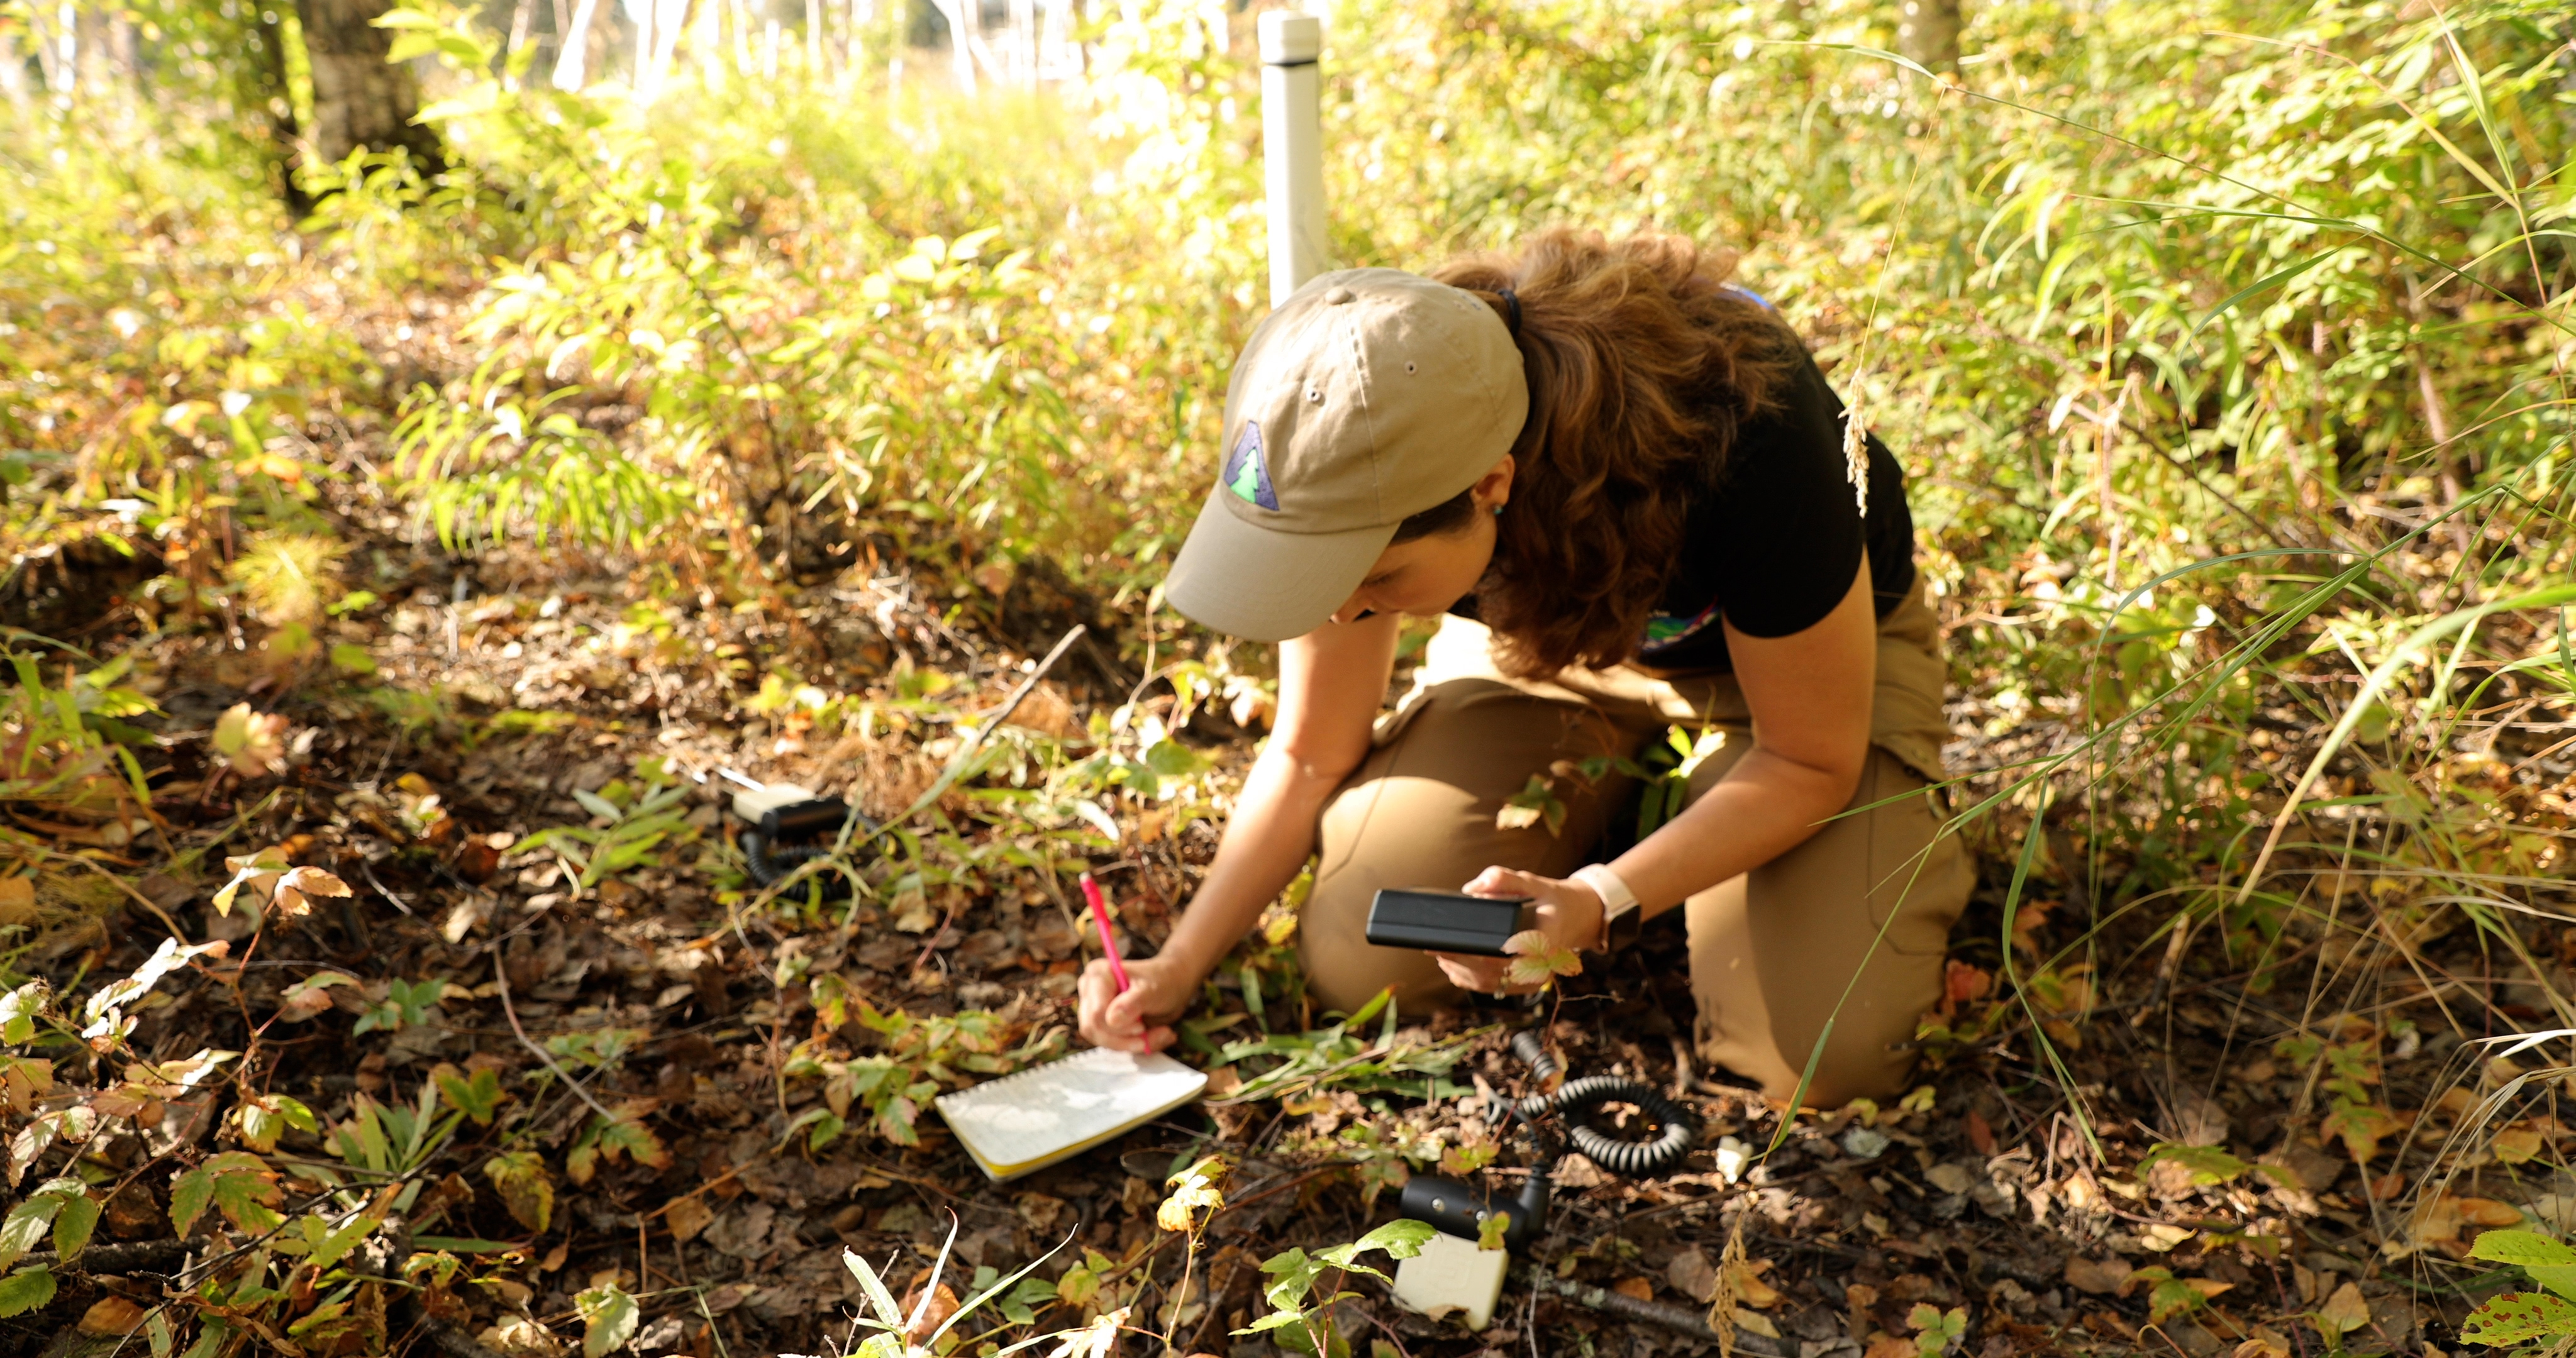
Permafrost & Soil Moisture
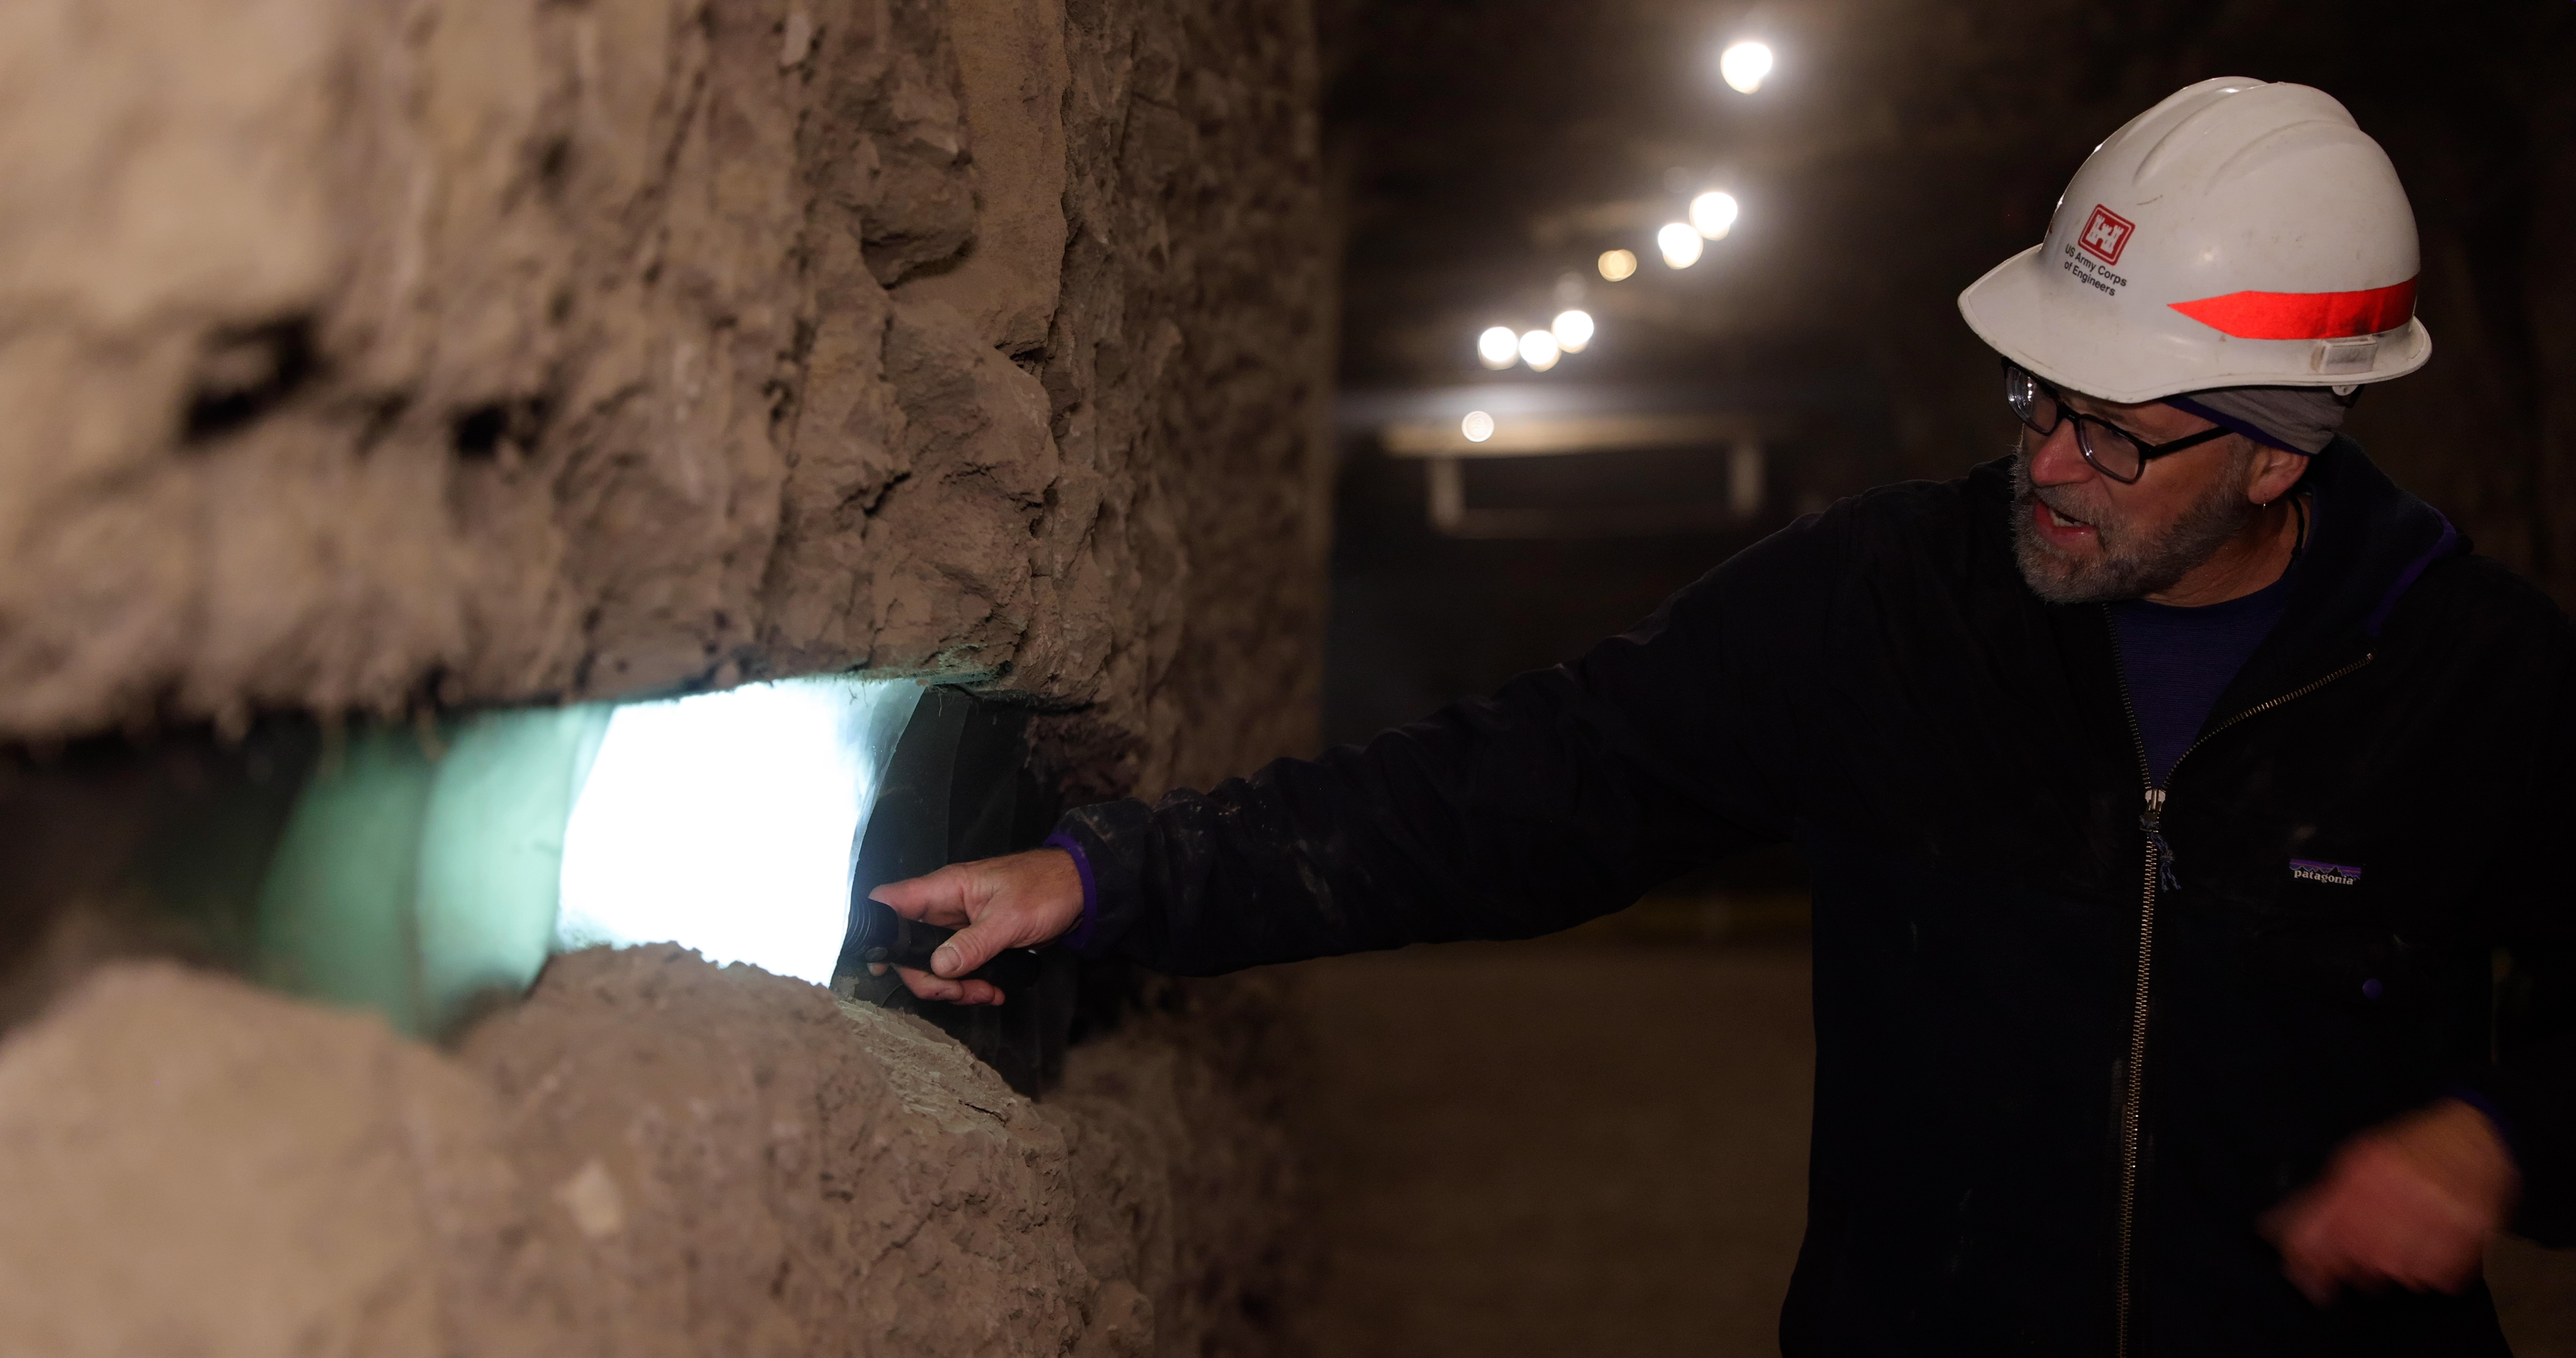 Link
LinkFootage selects of the Permafrost Tunnel Research Facility outside of Fairbanks, Alaska.
NOTE: The audio on this clip varies widely and includes loud noise. We advise turning down/off sound when previewing this item.
Go to this link
2022 Field Season
- ID: 14222 B-Roll
ABoVE Summer 2022 B-Roll
Go to this pageThe Arctic Boreal Vulnerability Experiment, or ABoVE, is a NASA-led, 10-year field experiment designed to better understand the ecological and social consequences of environmental change in one of the most rapidly changing regions on Earth. Satellite, airborne, and ground observations across Alaska and Canada will help us better understand the local and regional effects of changing forests, permafrost, and ecosystems – and how these changes could ultimately affect people and places beyond the Arctic. These videos were filmed during the summer 2022 field campaign in Fairbanks, Alaska. ||
- ID: 14221 Produced Video
![Universal Production Music: Home To You by William Baxter Noon [PRS], Pluck Up Courage by John Griggs [PRS], Philip Michael Guyler [PRS], Wafer Thin by Adam Leslie Gock [APRA], Dinesh David Wicks [APRA], Mitchell Stewart [APRA], The Magpie's Pie by Quentin Bachelet [SACEM], Romain Sanson [SACEM], Ticking Tension by Quentin Bachelet [SACEM], Romain Sanson [SACEM], Reward Drawer by Ehren Ebbage [BMI] Additional images courtesy of Alaska Satellite Facility - University of Alaska FairbanksThis video can be freely shared and downloaded. While the video in its entirety can be shared without permission, some individual imagery provided by ASF is obtained through permission and may not be excised or remixed in other products. For more information on NASA’s media guidelines, visit https://www.nasa.gov/multimedia/guidelines/index.htmlComplete transcript available.](/vis/a010000/a014200/a014221/ABoVE_Title.jpg)
How NASA Decodes the Secrets of the Arctic
Go to this pageUniversal Production Music: Home To You by William Baxter Noon [PRS], Pluck Up Courage by John Griggs [PRS], Philip Michael Guyler [PRS], Wafer Thin by Adam Leslie Gock [APRA], Dinesh David Wicks [APRA], Mitchell Stewart [APRA], The Magpie's Pie by Quentin Bachelet [SACEM], Romain Sanson [SACEM], Ticking Tension by Quentin Bachelet [SACEM], Romain Sanson [SACEM], Reward Drawer by Ehren Ebbage [BMI] Additional images courtesy of Alaska Satellite Facility - University of Alaska FairbanksThis video can be freely shared and downloaded. While the video in its entirety can be shared without permission, some individual imagery provided by ASF is obtained through permission and may not be excised or remixed in other products. For more information on NASA’s media guidelines, visit https://www.nasa.gov/multimedia/guidelines/index.htmlComplete transcript available. || ABoVE_Title.jpg (1920x1080) [623.7 KB] || ABoVE_Title_searchweb.png (180x320) [91.6 KB] || ABoVE_Title_thm.png (80x40) [7.6 KB] || ABoVE_FINAL.webm (1920x1080) [66.4 MB] || TWITTER_ABoVE_FINAL.mp4 (1920x1080) [341.3 MB] || ABoVE.en_US.srt [12.5 KB] || ABoVE.en_US.vtt [11.8 KB] || ABoVE_FINAL.mp4 (1920x1080) [1.4 GB] ||
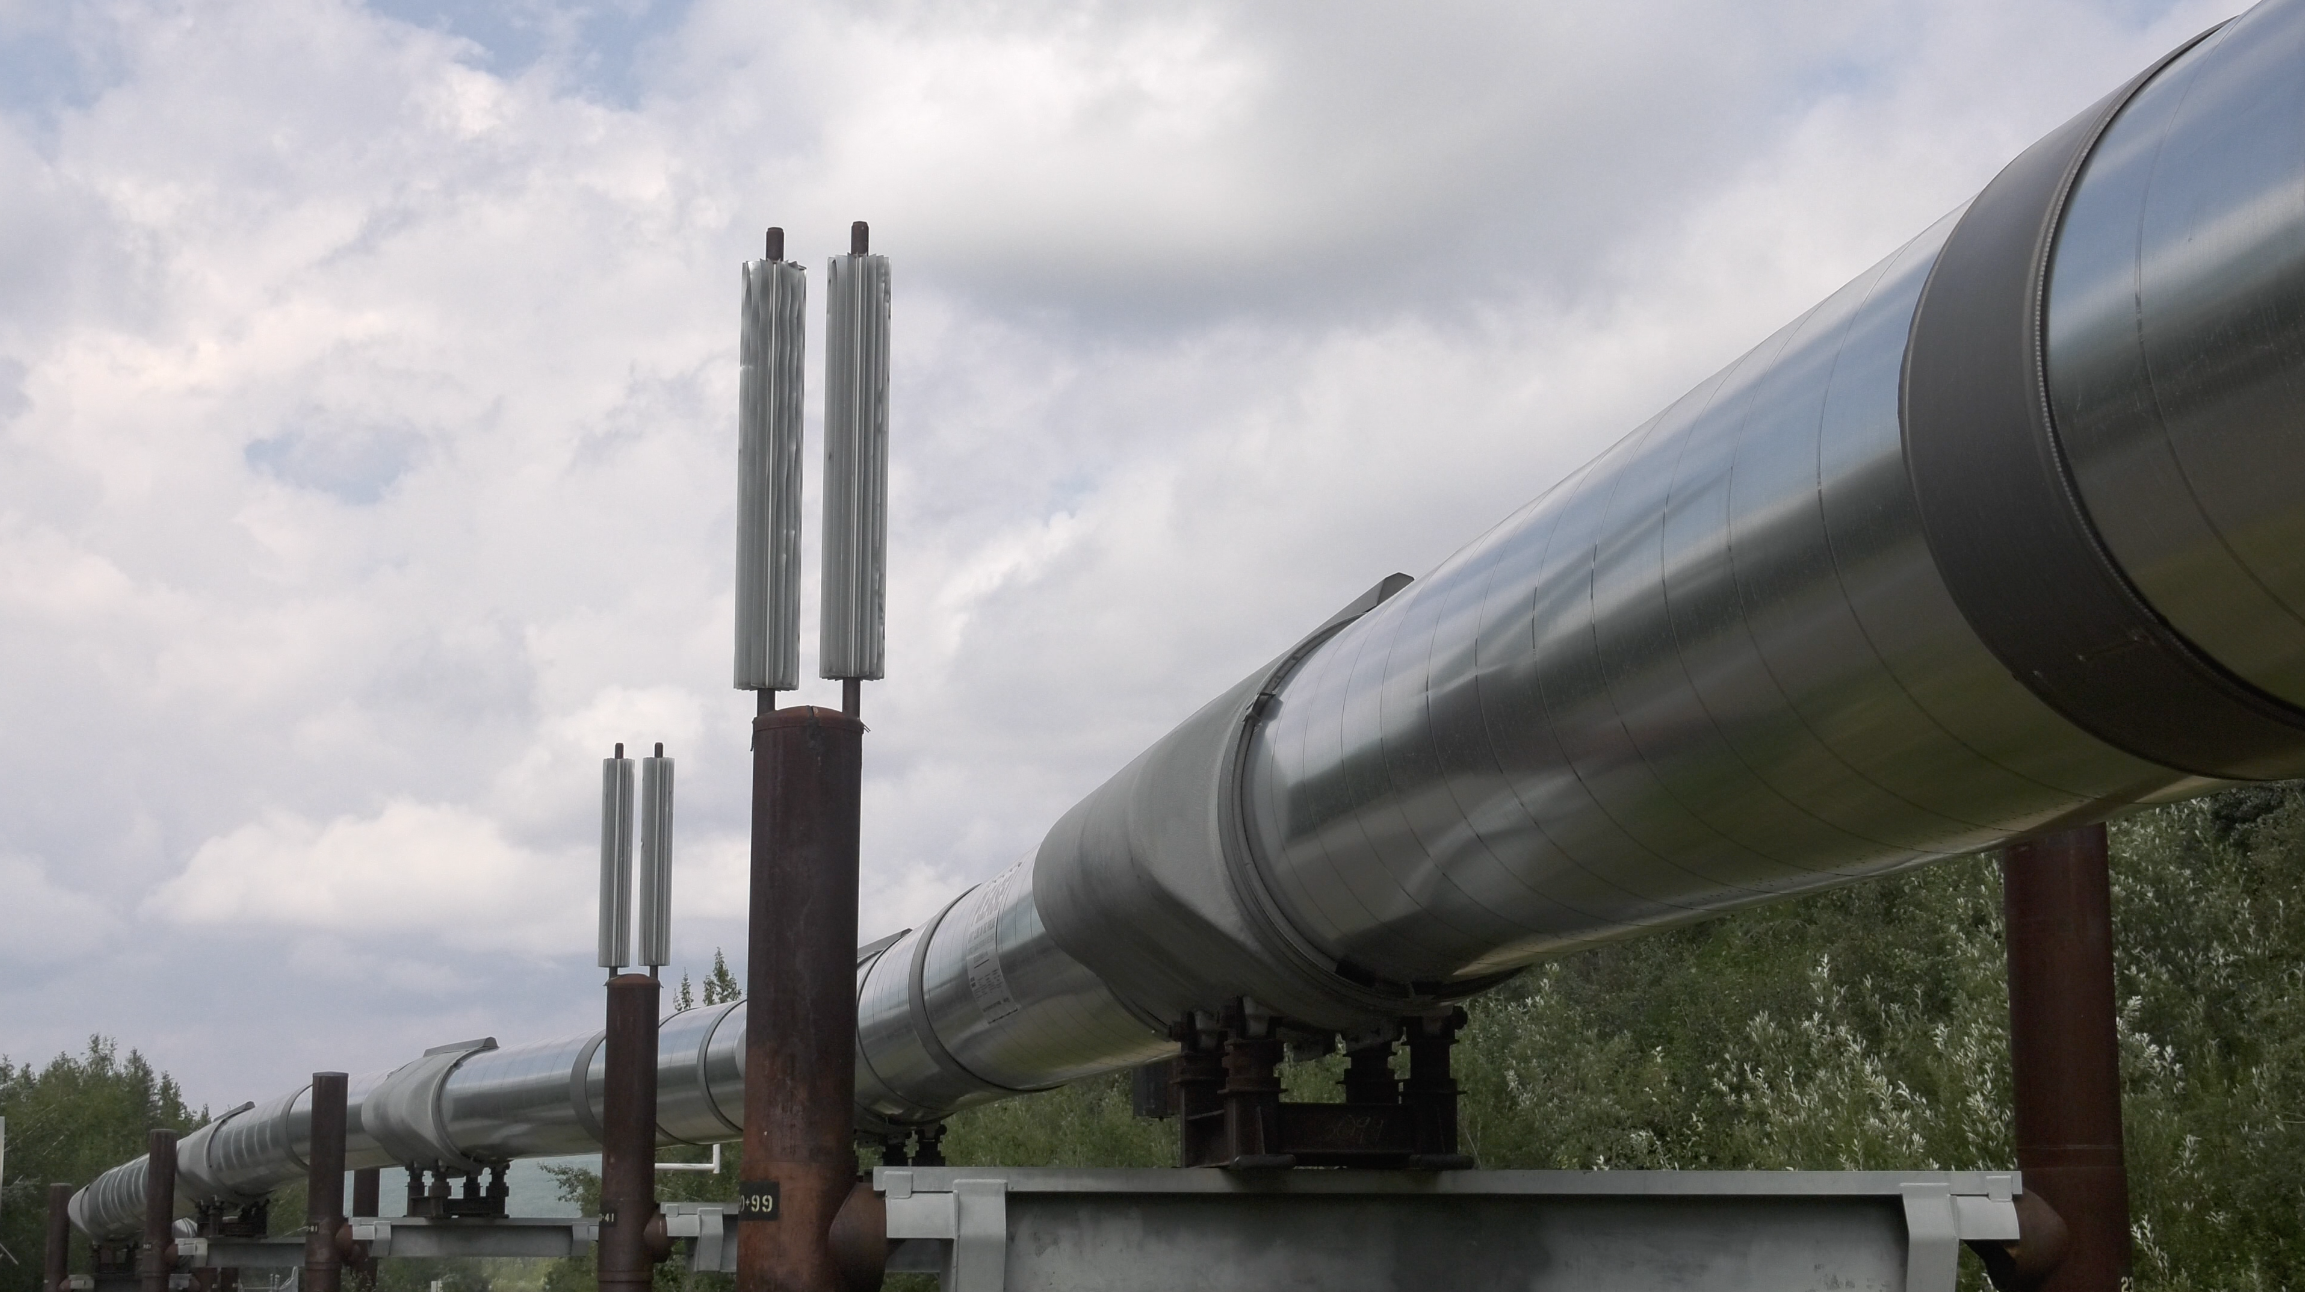
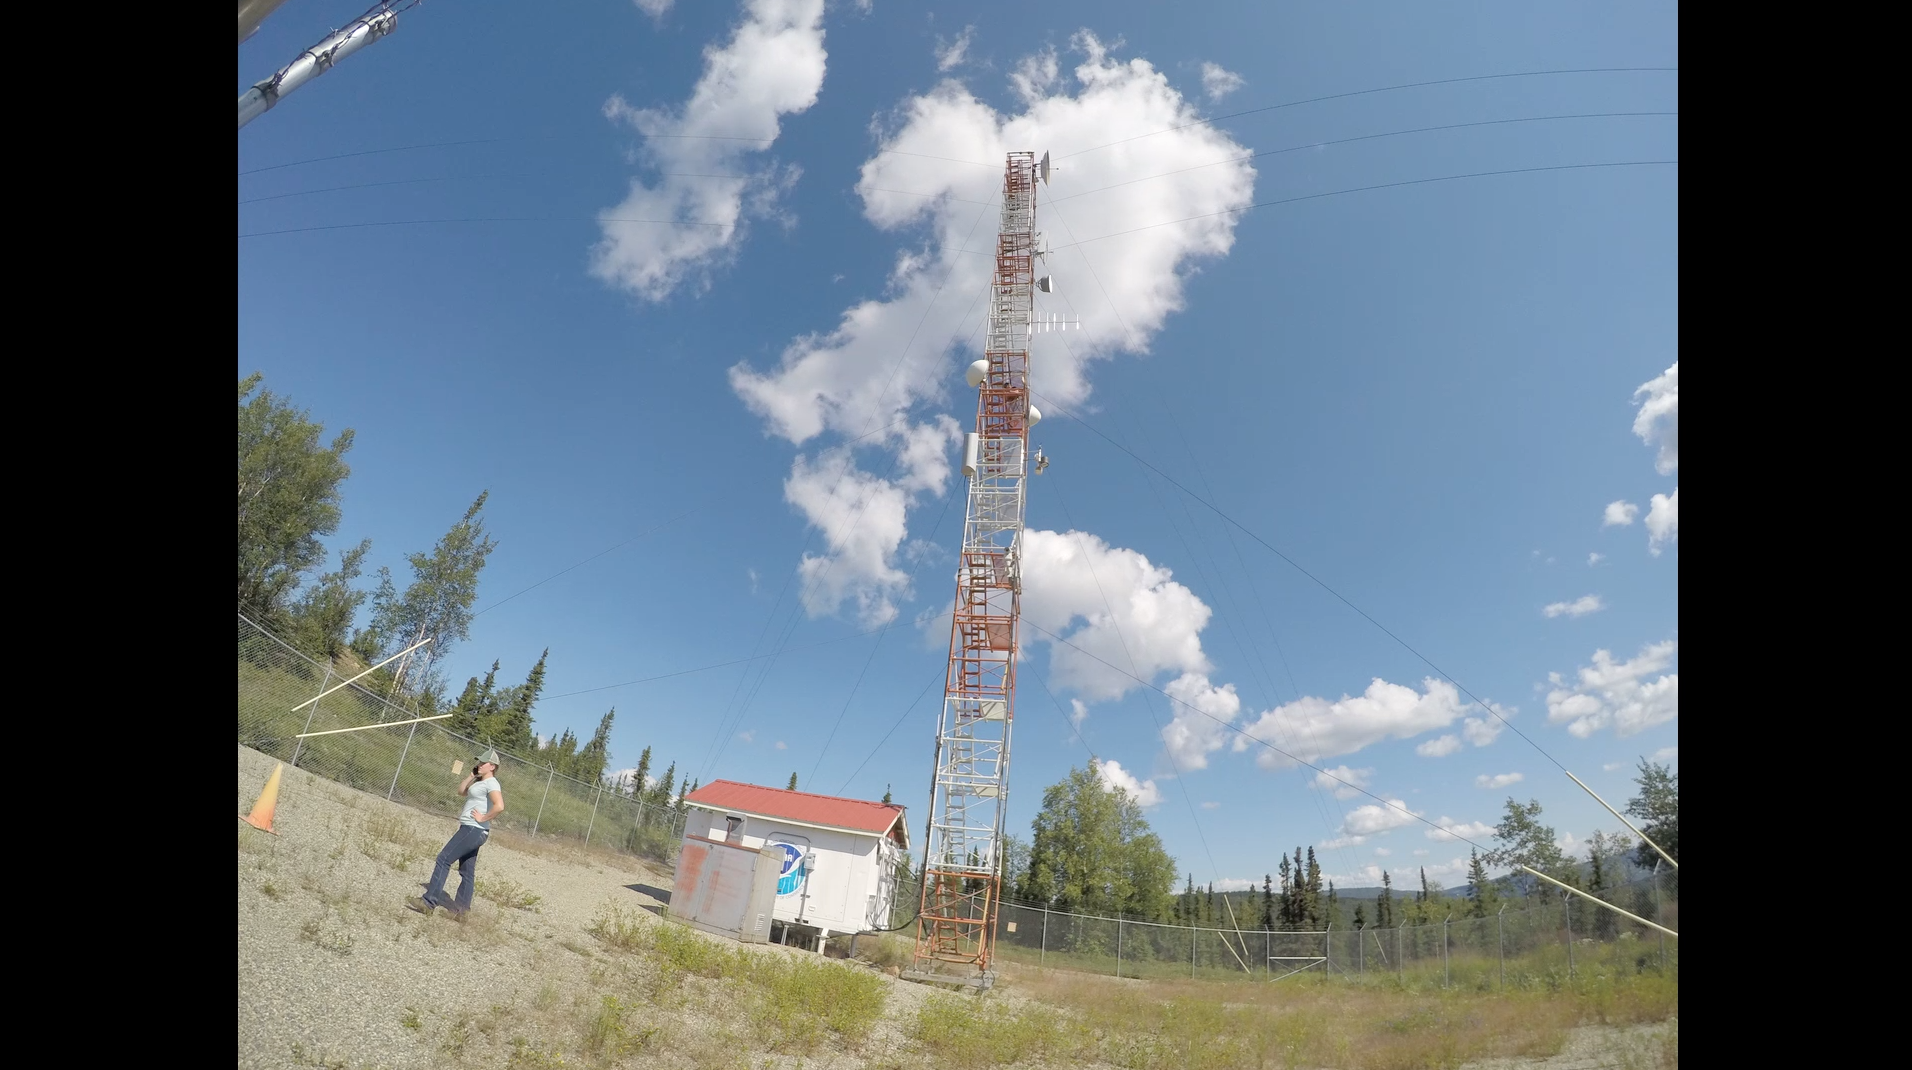
CARVE Tower
The ABoVE field campaign is studying how Alaska and northwest Canada are changing in a rapidly warming climate. Instruments on the tower, which is operated by the National Oceanic and Atmospheric Administration, measure the amount of carbon dioxide, carbon monoxide and methane in the air. The tower measures gases that drift in from as far away as Canada and the Brooks Range in northern Alaska.
 Link
LinkCARVE tower timelapse
A timelapse of a CARVE tower near Fairbanks, Alaska, as researchers and communicators climb and observe the structure.
Go to this link
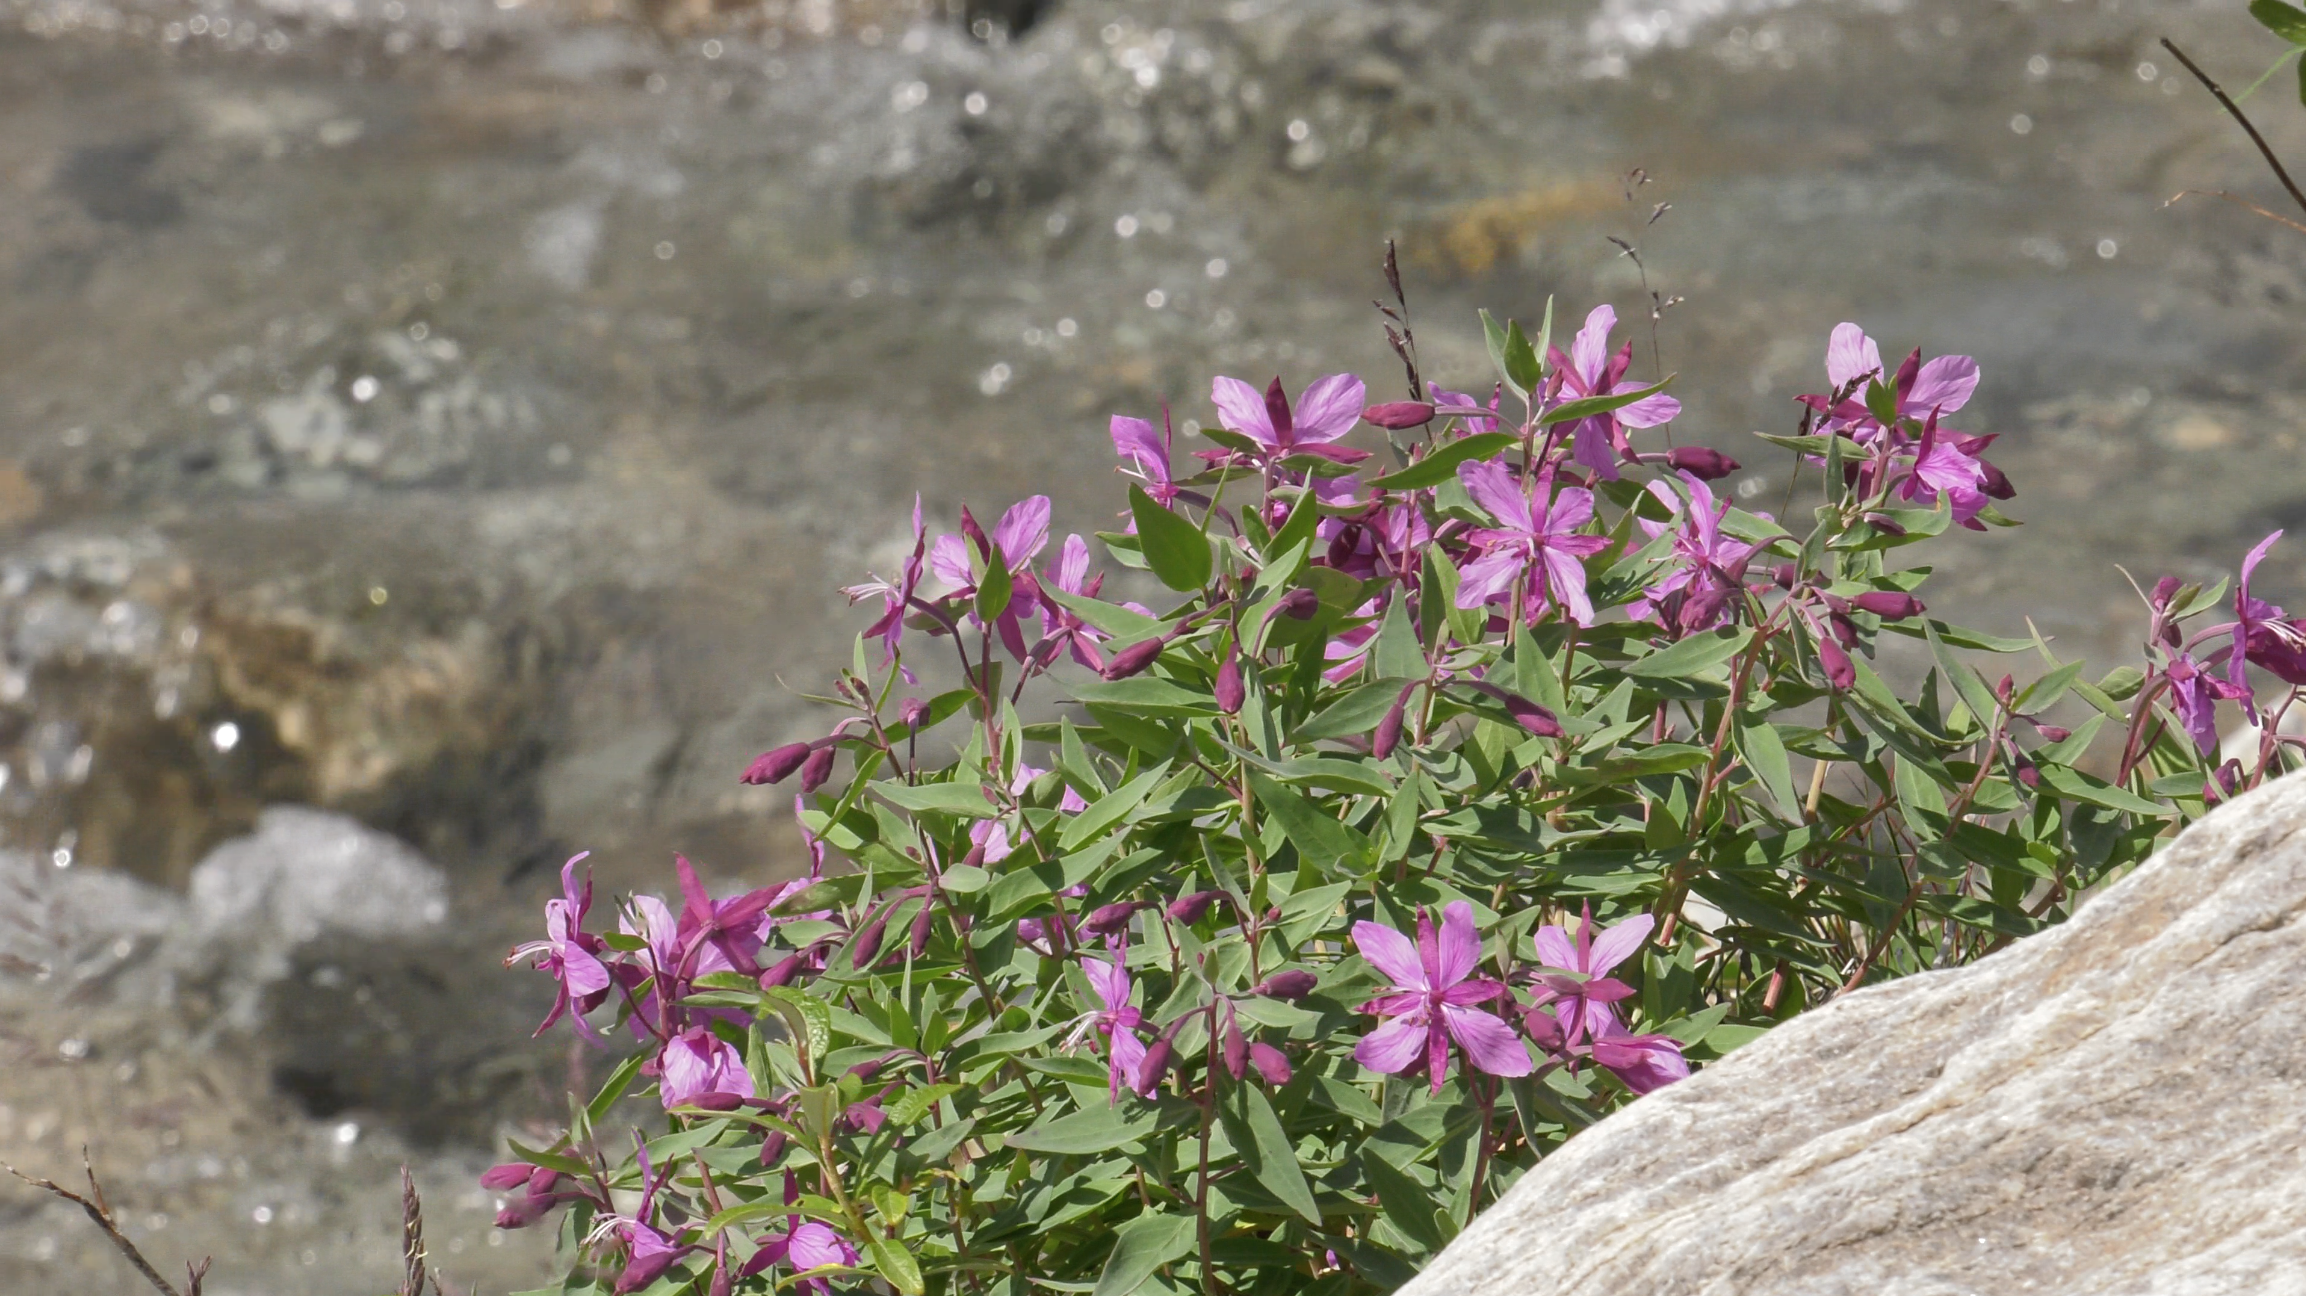
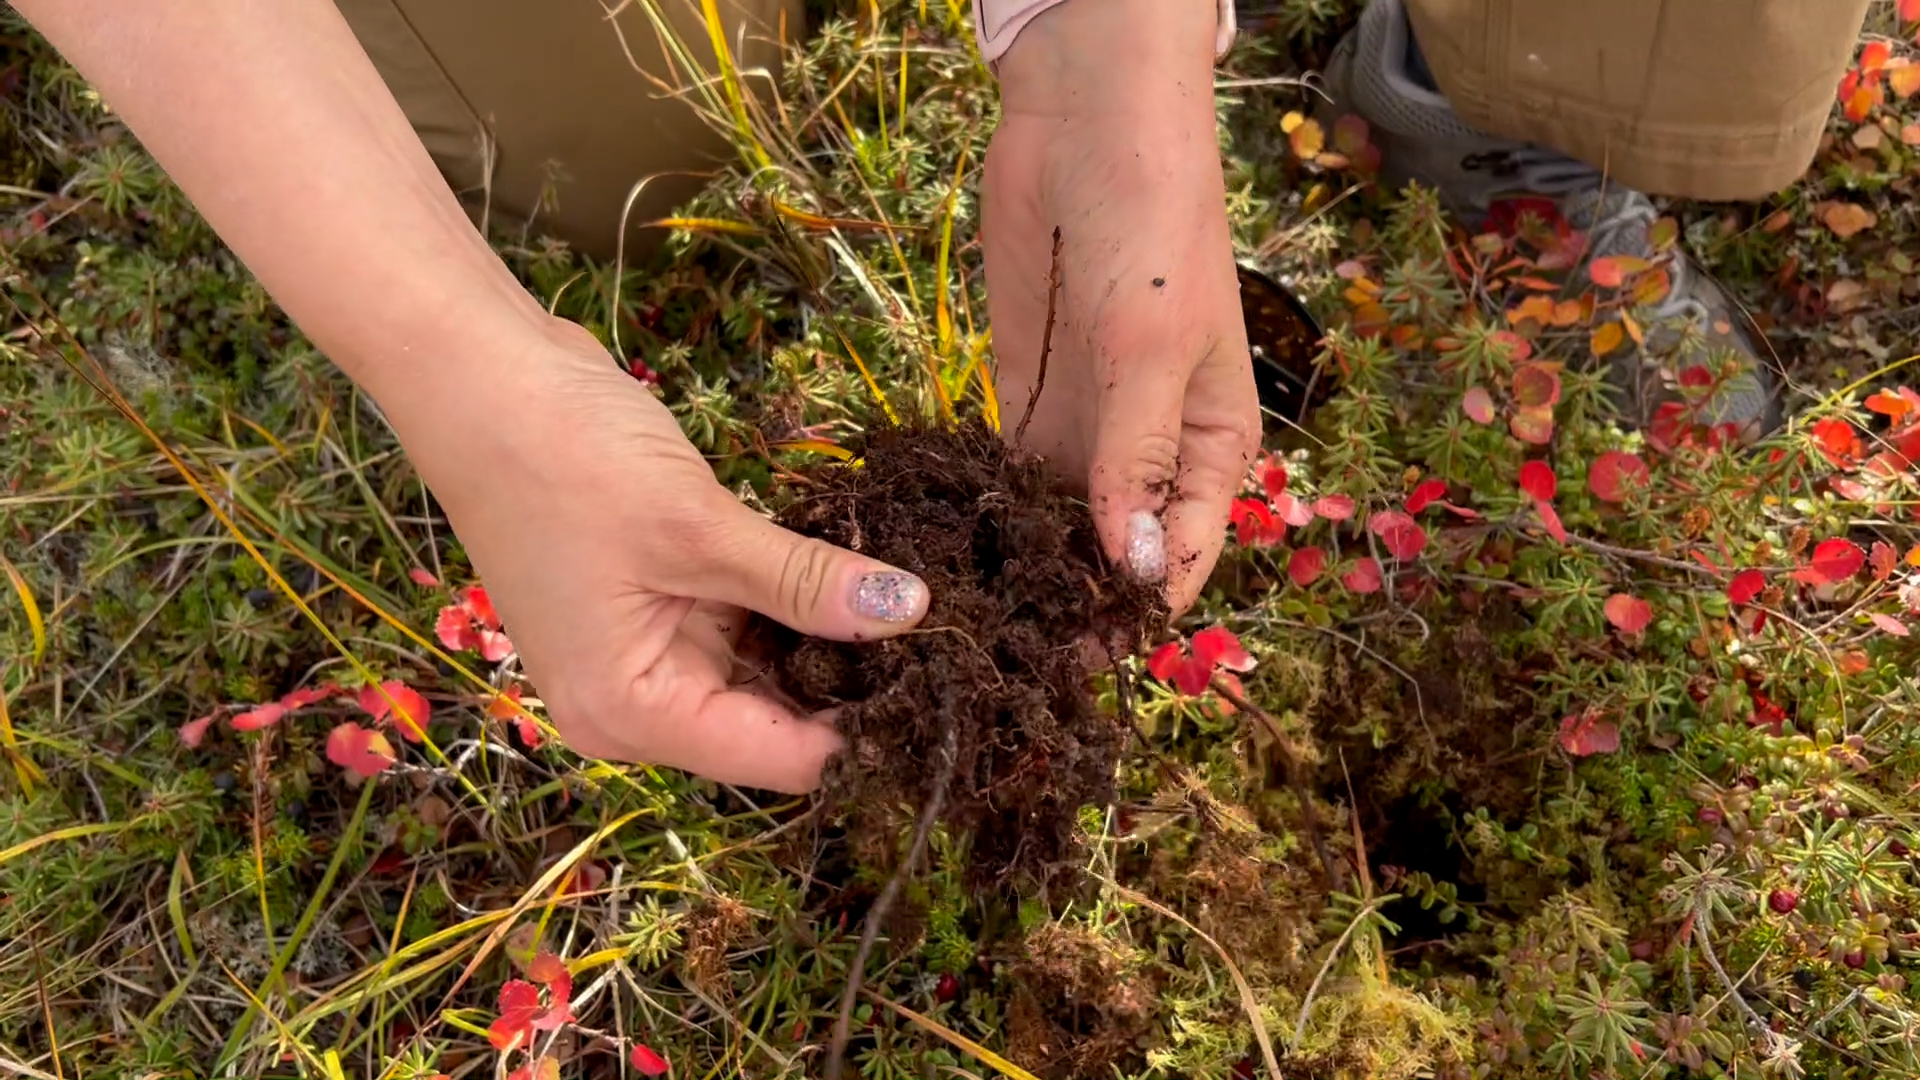
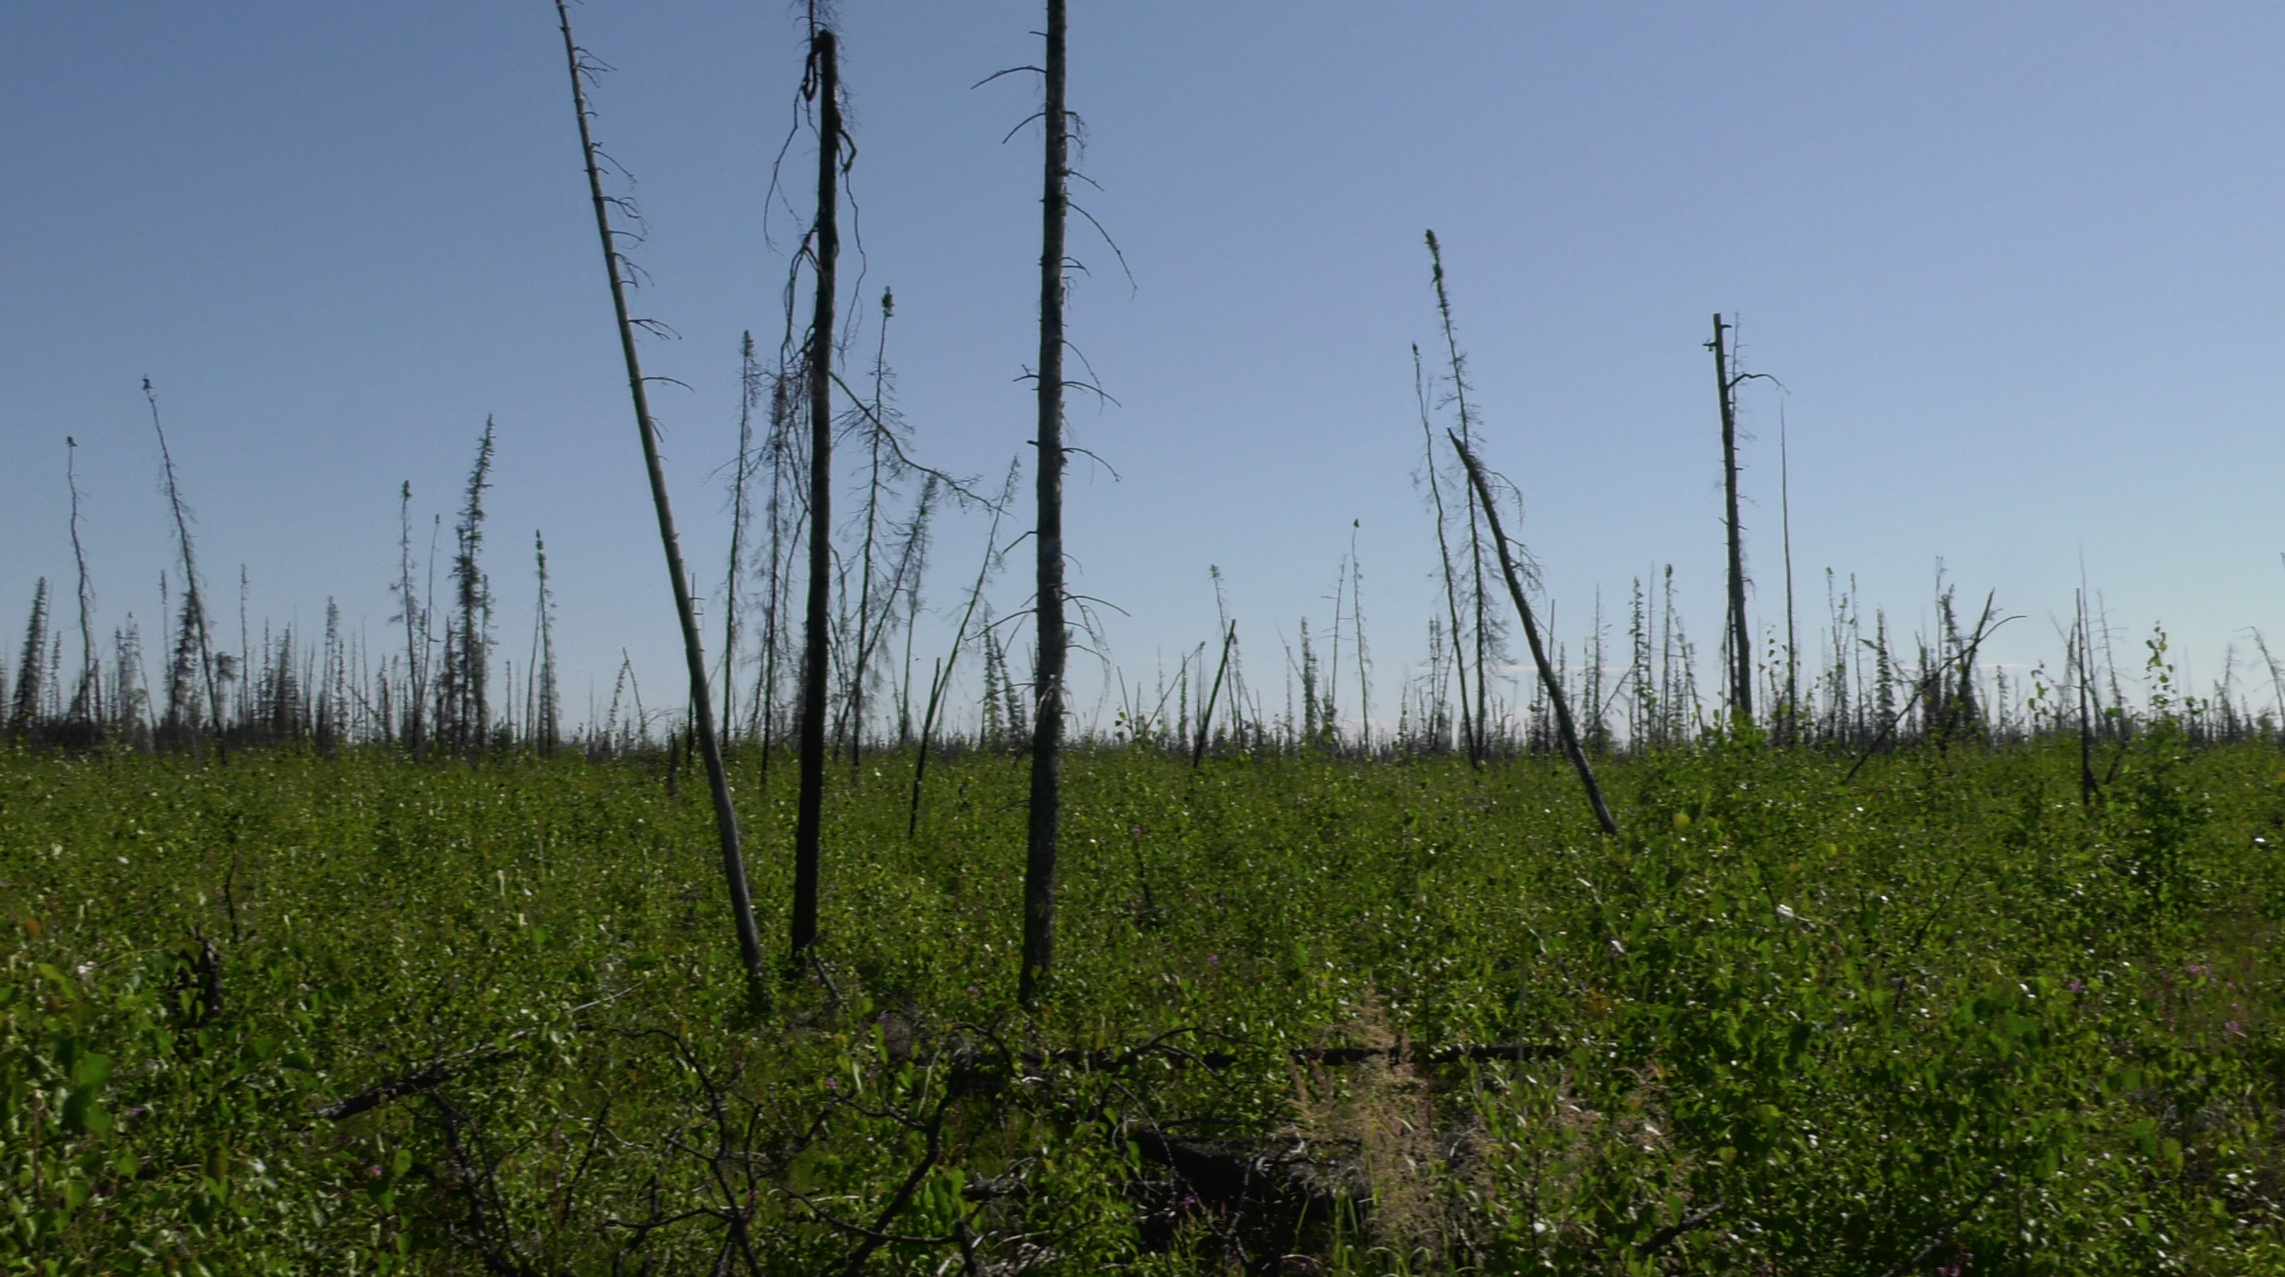
Subsistence Resources & Bonanza Creek
One of ABoVE's research projects investigates how access to subsistence resources like game, berries, and the assets of neighboring villages is changing in a warming climate. Those changes can include increased wildfires, an early thaw of river ice, or a trail sunk by thawing permafrost. This collection of footage is from the Tanana River region southwest of Fairbanks, and includes a burned area study called Bonanza Creek and footage from nearby areas of permafrost and sphagnum moss.
Produced Videos
- ID: 12351 Produced Video
ABoVE campaign videos
Go to this pageThe Arctic Boreal and Vulnerability Experiment (ABoVE) covers 2.5 million square miles of tundra, forests, permafrost and lakes in Alaska and Northwestern Canada. ABoVE scientists are using satellites and aircraft to study this formidable terrain as it changes in a warming climate. Remote sensing by itself is not enough to understand the whole picture, so teams of researchers will go out into the field to gather data. With support from NASA’s Terrestrial Ecology Program, ABoVE researchers investigate questions about the role of climate in wildfires, thawing permafrost, wildlife migration habits, insect outbreaks and more. ||
- ID: 14221 Produced Video
How NASA Decodes the Secrets of the Arctic
Go to this pageUniversal Production Music: Home To You by William Baxter Noon [PRS], Pluck Up Courage by John Griggs [PRS], Philip Michael Guyler [PRS], Wafer Thin by Adam Leslie Gock [APRA], Dinesh David Wicks [APRA], Mitchell Stewart [APRA], The Magpie's Pie by Quentin Bachelet [SACEM], Romain Sanson [SACEM], Ticking Tension by Quentin Bachelet [SACEM], Romain Sanson [SACEM], Reward Drawer by Ehren Ebbage [BMI] Additional images courtesy of Alaska Satellite Facility - University of Alaska FairbanksThis video can be freely shared and downloaded. While the video in its entirety can be shared without permission, some individual imagery provided by ASF is obtained through permission and may not be excised or remixed in other products. For more information on NASA’s media guidelines, visit https://www.nasa.gov/multimedia/guidelines/index.htmlComplete transcript available. || ABoVE_Title.jpg (1920x1080) [623.7 KB] || ABoVE_Title_searchweb.png (180x320) [91.6 KB] || ABoVE_Title_thm.png (80x40) [7.6 KB] || ABoVE_FINAL.webm (1920x1080) [66.4 MB] || TWITTER_ABoVE_FINAL.mp4 (1920x1080) [341.3 MB] || ABoVE.en_US.srt [12.5 KB] || ABoVE.en_US.vtt [11.8 KB] || ABoVE_FINAL.mp4 (1920x1080) [1.4 GB] ||
- ID: 13281 Produced Video
![Music: Stepping Stone Bridge by Timothy Michael Hammond [PRS], Wayne Roberts [PRS]Watching Ladybirds by Benjamin James Parsons [PRS] This video can be freely shared and downloaded. While the video in its entirety can be shared without permission, some individual imagery provided by pond5.com and Artbeats is obtained through permission and may not be excised or remixed in other products. Specific details on stock footage may be found here. For more information on NASA’s media guidelines, visit https://www.nasa.gov/multimedia/guidelines/index.html. Complete transcript available.](/vis/a010000/a013200/a013281/Thumbnail_Arctic_Fires_Print.jpg)
NASA Studies How Arctic Fires Change the World
Go to this pageMusic: Stepping Stone Bridge by Timothy Michael Hammond [PRS], Wayne Roberts [PRS]Watching Ladybirds by Benjamin James Parsons [PRS] This video can be freely shared and downloaded. While the video in its entirety can be shared without permission, some individual imagery provided by pond5.com and Artbeats is obtained through permission and may not be excised or remixed in other products. Specific details on stock footage may be found here. For more information on NASA’s media guidelines, visit https://www.nasa.gov/multimedia/guidelines/index.html. Complete transcript available. || Thumbnail_Arctic_Fires_Print.jpg (1920x1080) [917.1 KB] || Thumbnail_Arctic_Fires_Print_searchweb.png (320x180) [121.3 KB] || Thumbnail_Arctic_Fires_Print_thm.png (80x40) [8.0 KB] || 13281_Arctic_Fires_720.mp4 (1280x720) [265.3 MB] || 13281_Arctic_Fires.mov (1920x1080) [3.5 GB] || 13281_Arctic_Fires.webm (1920x1080) [21.2 MB] || 13281_Arctic_Fires.en_US.srt [4.1 KB] || 13281_Arctic_Fires.en_US.vtt [4.0 KB] ||
- ID: 12794 Produced Video
![Music: Wondrous Lands by Anthony Giordan [SACEM]](/vis/a010000/a012700/a012794/LARGE_MP4_ABoVE_Final_Wrap_large.00150_print.jpg)
A Summer ABoVE the Warming Arctic
Go to this pageScientists with NASA's Arctic Boreal Vulnerability Experiment - ABoVE - are studying how the Arctic region responds to climate change. Looking at everything from thawing permafrost underground to wildfires, the researchers are working to create a comprehensive picture of the warming Arctic.This summer, the team brought a fleet of planes to fly over Alaska and Canada and gather data to complement measurements taken from the ground. The ABoVE campaign is designed to last for ten years. ||
- ID: 12683 Produced Video
![Music: Fading Flower by Laurent Dury [SACEM]Complete transcript available.](/vis/a010000/a012600/a012683/LARGE_MP4-Inuvik_Final_large_1.00001_print.jpg)
Earth Expedition: Spiraling Above Canada to Measure Carbon
Go to this pageHigh above Alaska and Canada, researchers from NASA’s Arctic Boreal Vulnerability Experiment (ABoVE) are studying carbon emissions from a DC-8 plane. The plane carries new lidar instruments to measure concentrations of carbon dioxide and methane in the air, far below the aircraft. The plane also carries instruments that can measure carbon concentrations with extreme accuracy, but only from up-close.To check the accuracy of the lidar measurements, the team needs to fly the plane down to the lower altitudes the lidar is studying. Taking measurements at every altitude is no easy feat. The plane flies in looping spirals down to just about 100 feet above the ground, and then spirals back up to about 30,000 feet, taking measurements the whole time. ||
- ID: 12684 Produced Video
![Music: Suspended Beauty by Laurent Dury [SACEM]Complete transcript available.](/vis/a010000/a012600/a012684/LARGE_MP4-Aug7_Wildfires_large.00529_print.jpg)
Earth Expedition: Studying Wildfires in a Warming Arctic
Go to this pageMusic: Suspended Beauty by Laurent Dury [SACEM]Complete transcript available. || LARGE_MP4-Aug7_Wildfires_large.00529_print.jpg (1024x576) [58.4 KB] || LARGE_MP4-Aug7_Wildfires_large.00529_searchweb.png (320x180) [59.1 KB] || LARGE_MP4-Aug7_Wildfires_large.00529_thm.png (80x40) [4.7 KB] || WEBM-Aug7_Wildfires.webm (960x540) [13.5 MB] || LARGE_MP4-Aug7_Wildfires_large.mp4 (1920x1080) [35.0 MB] || APPLE_TV-Aug7_Wildfires_appletv.m4v (1280x720) [12.5 MB] || YOUTUBE_HQ-Aug7_Wildfires_youtube_hq.mov (1920x1080) [141.4 MB] || APPLE_TV-Aug7_Wildfires_appletv_subtitles.m4v (1280x720) [12.5 MB] || Aug7_Wildfires.en_US.srt [464 bytes] || Aug7_Wildfires.en_US.vtt [477 bytes] || NASA_PODCAST-Aug7_Wildfires_ipod_sm.mp4 (320x240) [4.8 MB] ||
- ID: 12685 Produced Video
![Music: Ellipsis by Ben Niblett [PRS], Jon Cotton [PRS]Complete transcript available.](/vis/a010000/a012600/a012685/LARGE_MP4-EarthEx_Flight_large.00001_print.jpg)
Earth Expedition: Taking in Some Arctic Air
Go to this pageLast week, NASA's DC-8 plane flew over Alaska and Canada, measuring carbon dioxide and methane in the Arctic air. The plane carried five instruments to make these measurements for the Active Sensing of Carbon dioxide Emissions over Nights, Days and Seasons (ASCENDS) experiment.All part of NASA's Arctic Boreal Vulnerability Experiment (ABoVE), the science team is studying how the Arctic is changing in a warming climate. ||
Scientific Visualizations
- ID: 4877 Visualization

Ecological insights from three decades of animal movement tracking across a changing Arctic
Go to this pageAnimal movement tracking across the arctic on top of seasonal natural phenomena like changing vegetation, snow (white), and sea ice (light purple).This video is also available on our YouTube channel. || migration_final_024.1000_print.jpg (1024x576) [74.8 KB] || migration_final_024.1000_print_print.jpg (1024x576) [36.9 KB] || migration_final_024.1000_print_searchweb.png (320x180) [52.6 KB] || migration_final_024.1000_print_web.png (320x180) [52.6 KB] || migration_final_024.1000_print_thm.png (80x40) [4.3 KB] || migration_final_024_1080p59.94.webm (1920x1080) [17.1 MB] || migration_final_024_1080p59.94.mp4 (1920x1080) [103.0 MB] || north_america (3840x2160) [0 Item(s)] || captions_silent.30466.en_US.srt [43 bytes] || migration_final_024_2160p59.94.mp4 (3840x2160) [297.5 MB] || migration_final_024_1080p.hwshow [83 bytes] ||
- ID: 4486 Visualization
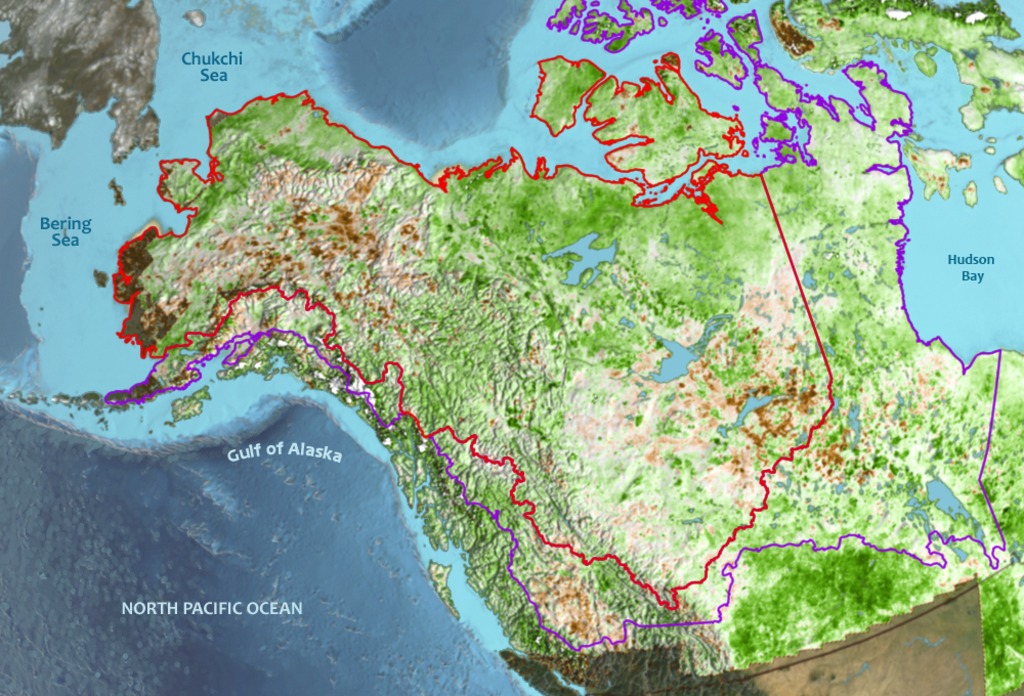
Study Domain for the Arctic-Boreal Vulnerability Experiment
Go to this pageThis image shows the core region (red outline) and extended region (purple outline) of the Arctic-Boreal Vulnerability Experiment over a background of the NDVI trend from 1983-2012. || ArcticGreeningImage_flat_print.jpg (1024x696) [278.1 KB] || ArcticGreeningImage_flat_searchweb.png (320x180) [152.1 KB] || ArcticGreeningImage_flat_thm.png (80x40) [21.3 KB] || ArcticGreeningImage_flat.tif (1000x680) [1.9 MB] ||
- ID: 4789 Visualization
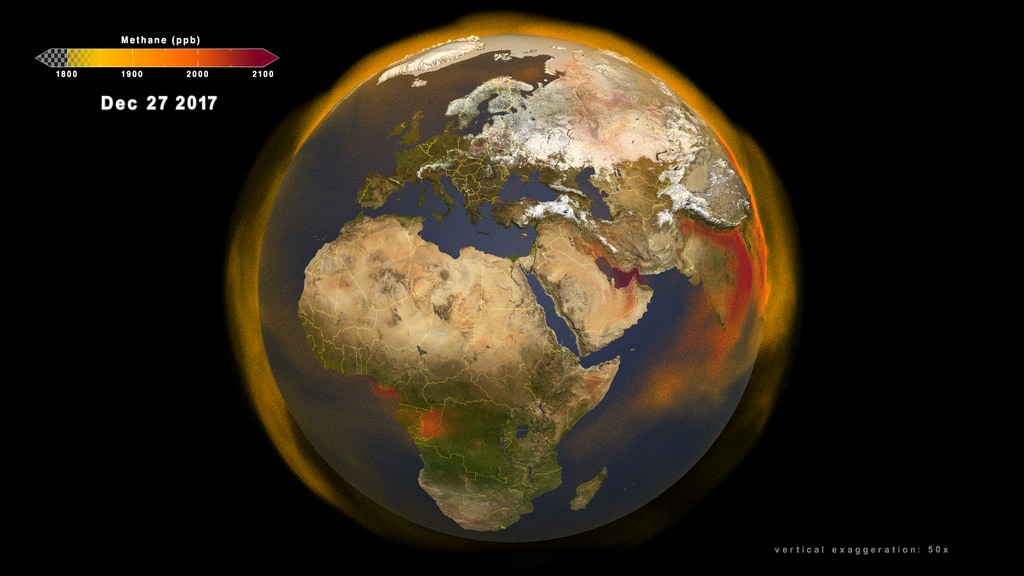
Global Atmospheric Methane
Go to this pageThis first 3D volumetric visualization focuses on several continents showing the emission and transport of atmospheric methane around the globe between January 1, 2017 and November 30, 2018. This video is also available on our YouTube channel. || Global_methane_comp.1320_print.jpg (1024x576) [163.2 KB] || Global_methane_comp_1080p30.webm (1920x1080) [22.1 MB] || composite (1920x1080) [0 Item(s)] || captions_silent.29083.en_US.srt [43 bytes] || Global_methane_comp_1080p30.mp4 (1920x1080) [1.4 GB] || Global_methane_comp_1080p30.mp4.hwshow ||