Earth
ID: 4940
Although it only reached hurricane status for a brief period, Hurricane Nicholas made an impact on the northern Gulf Coast by bringing heavy rains to an area still recovering from the devastating effects of powerful Hurricane Ida, which made landfall in Louisiana just over 2 weeks earlier. Nicholas formed after a tropical wave passed over the Yucatan Peninsula and into the Bay of Campeche, providing a focus for shower and thunderstorm development. On the morning of Sunday September 12th, the National Hurricane Center (NHC) found that this area of storms had developed a closed circulation with sustained winds of 40 mph and so designated it as Tropical Storm Nicholas.
Nicholas was affected by several competing factors: the warm waters of the Gulf of Mexico, nearby land, dry air, and windshear. The result was that Nicholas struggled to organize and form a coherent center due to the effects of southwesterly wind shear as it tracked northward towards the Texas coast. In fact, late that same evening on the 12th, the center actually re-formed well to the north-northeast of the previous center, causing the track to jump forward. After reforming its center, Nicholas finally started to tap into the warm waters of the Gulf and began to strengthen on the morning of 13th as it approached the Texas-Mexico border. However, Nicholas continued to be affected by windshear throughout the day as the storm continued northward just off the Texas coast; the net result was slow strengthening until finally at 10 pm CDT on the evening of the 13th, just before making landfall, NHC reported that Nicholas had become a minimal Category 1 hurricane with sustained winds of 75 mph. Nicholas made landfall shortly thereafter at 12:30 am CDT on the 14th on the Matagorda Peninsula near Sargent Beach, TX.
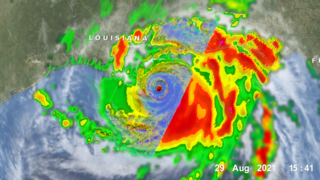
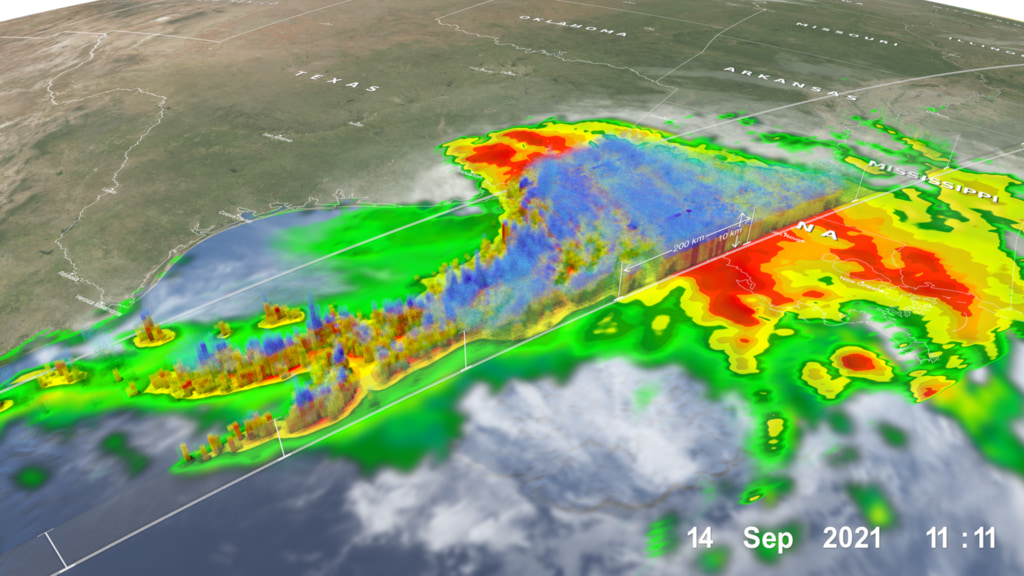
Several hours later at 11:11 UTC (6:11 am CDT), when the center was located just southwest of Houston, TX, the NASA / JAXA GPM Core Observatory satellite flew over Nicholas. This animation shows rainfall estimates from NASA's IMERG multi-satellite precipitation product and NOAA GOES-E satellite cloud data in association with the passage of Nicholas prior to the time of the GPM overpass followed by a detailed look into the 3D structure and intensity of precipitation within Nicholas using data from the GPM overpass. IMERG shows heavy rain (red areas) remaining mostly out over the Gulf on the eastern side of Nicholas as the storm is moving northward toward the Texas coast. As Nicholas nears the coast, heavy to moderate rain (red and orange areas, respectively) begins to push inland over southeast Texas and southern Louisiana.
At the time of the overpass, rainfall rates derived from the GPM Microwave Imager (GMI) and Dual-frequency Precipitation Radar (DPR) show heavy rains (in red) extending from southeast Texas eastward across most of southern Louisiana. These rain areas are all located northeast of the center. GPM also shows an intense rainband (shown in magenta and red) extending southward from the coast for several hundred km well east of the center. GPM shows that there is almost no rain west of the center. This highly asymmetric structure is a result of Nicholas not being able to fully develop before making landfall coupled with the fact that the eastern side of Nicholas’ counterclockwise circulation was located over the warm waters of the Gulf while the western side was drawing down dry air over land. GPM’s DPR also shows that the highest reaching precipitation echoes (i.e., the tallest storms, shown in blue shading) are collocated with the most intense rain areas within the prominent rainband east of the center out over the Gulf.
After landfall, Nicholas quickly weakened and slowed to a crawl with the remnant low becoming almost stationary over southwestern Louisiana for the next few days. Nicholas has resulted in 4 to 8 inches of rain with locally higher amounts across several areas of the northern Gulf Coast. The storm has also left several hundred thousand people without power from the Houston area and into Louisiana.
Learn more about how NASA monitors hurricanes.
GPM data is archived at https://pps.gsfc.nasa.gov/

Hurricane Nicholas Brings More Heavy Rain to the Northern Gulf Coast
Nicholas was affected by several competing factors: the warm waters of the Gulf of Mexico, nearby land, dry air, and windshear. The result was that Nicholas struggled to organize and form a coherent center due to the effects of southwesterly wind shear as it tracked northward towards the Texas coast. In fact, late that same evening on the 12th, the center actually re-formed well to the north-northeast of the previous center, causing the track to jump forward. After reforming its center, Nicholas finally started to tap into the warm waters of the Gulf and began to strengthen on the morning of 13th as it approached the Texas-Mexico border. However, Nicholas continued to be affected by windshear throughout the day as the storm continued northward just off the Texas coast; the net result was slow strengthening until finally at 10 pm CDT on the evening of the 13th, just before making landfall, NHC reported that Nicholas had become a minimal Category 1 hurricane with sustained winds of 75 mph. Nicholas made landfall shortly thereafter at 12:30 am CDT on the 14th on the Matagorda Peninsula near Sargent Beach, TX.
Several hours later at 11:11 UTC (6:11 am CDT), when the center was located just southwest of Houston, TX, the NASA / JAXA GPM Core Observatory satellite flew over Nicholas. This animation shows rainfall estimates from NASA's IMERG multi-satellite precipitation product and NOAA GOES-E satellite cloud data in association with the passage of Nicholas prior to the time of the GPM overpass followed by a detailed look into the 3D structure and intensity of precipitation within Nicholas using data from the GPM overpass. IMERG shows heavy rain (red areas) remaining mostly out over the Gulf on the eastern side of Nicholas as the storm is moving northward toward the Texas coast. As Nicholas nears the coast, heavy to moderate rain (red and orange areas, respectively) begins to push inland over southeast Texas and southern Louisiana.
At the time of the overpass, rainfall rates derived from the GPM Microwave Imager (GMI) and Dual-frequency Precipitation Radar (DPR) show heavy rains (in red) extending from southeast Texas eastward across most of southern Louisiana. These rain areas are all located northeast of the center. GPM also shows an intense rainband (shown in magenta and red) extending southward from the coast for several hundred km well east of the center. GPM shows that there is almost no rain west of the center. This highly asymmetric structure is a result of Nicholas not being able to fully develop before making landfall coupled with the fact that the eastern side of Nicholas’ counterclockwise circulation was located over the warm waters of the Gulf while the western side was drawing down dry air over land. GPM’s DPR also shows that the highest reaching precipitation echoes (i.e., the tallest storms, shown in blue shading) are collocated with the most intense rain areas within the prominent rainband east of the center out over the Gulf.
After landfall, Nicholas quickly weakened and slowed to a crawl with the remnant low becoming almost stationary over southwestern Louisiana for the next few days. Nicholas has resulted in 4 to 8 inches of rain with locally higher amounts across several areas of the northern Gulf Coast. The storm has also left several hundred thousand people without power from the Houston area and into Louisiana.
Learn more about how NASA monitors hurricanes.
GPM data is archived at https://pps.gsfc.nasa.gov/
Related
Visualization Credits
Alex Kekesi (Global Science and Technology, Inc.): Lead Data Visualizer
Greg Shirah (NASA/GSFC): Data Visualizer
George Huffman (NASA/GSFC): Lead Scientist
Owen Kelley (George Mason University): Lead Scientist
Scott Braun (NASA/GSFC): Lead Scientist
Ryan Fitzgibbons (USRA): Producer
Stephen Lang (SSAI): Lead Writer
Greg Shirah (NASA/GSFC): Data Visualizer
George Huffman (NASA/GSFC): Lead Scientist
Owen Kelley (George Mason University): Lead Scientist
Scott Braun (NASA/GSFC): Lead Scientist
Ryan Fitzgibbons (USRA): Producer
Stephen Lang (SSAI): Lead Writer
Please give credit for this item to:
NASA's Scientific Visualization Studio
NASA's Scientific Visualization Studio
Short URL to share this page:
https://svs.gsfc.nasa.gov/4940
Mission:
Global Precipitation Measurement (GPM)
Data Used:
Note: While we identify the data sets used in these visualizations, we do not store any further details nor the data sets themselves on our site.
This item is part of these series:
GPM Animations
Hurricanes
Keywords:
DLESE >> Atmospheric science
SVS >> Gulf Coast
DLESE >> Hydrology
DLESE >> Natural hazards
GCMD >> Earth Science >> Atmosphere >> Atmospheric Phenomena >> Hurricanes
GCMD >> Earth Science >> Atmosphere >> Precipitation >> Rain
GCMD >> Location >> Gulf Of Mexico
GCMD >> Location >> Louisiana
SVS >> Hyperwall
NASA Science >> Earth
NASA Earth Science Focus Areas >> Weather and Atmospheric Dynamics
GCMD keywords can be found on the Internet with the following citation: Olsen, L.M., G. Major, K. Shein, J. Scialdone, S. Ritz, T. Stevens, M. Morahan, A. Aleman, R. Vogel, S. Leicester, H. Weir, M. Meaux, S. Grebas, C.Solomon, M. Holland, T. Northcutt, R. A. Restrepo, R. Bilodeau, 2013. NASA/Global Change Master Directory (GCMD) Earth Science Keywords. Version 8.0.0.0.0
https://svs.gsfc.nasa.gov/4940
Mission:
Global Precipitation Measurement (GPM)
Data Used:
GPM/GMI/Surface Precipitation also referred to as: Rain Rates
9/14/2021 10:45 - 10:55Z
Credit:
Data provided by the joint NASA/JAXA GPM mission.
Data provided by the joint NASA/JAXA GPM mission.
GPM/DPR/Ku also referred to as: Volumetric Precipitation data
Observed Data - JAXA - 9/14/2021 10:41 - 11:11Z
Credit:
Data provided by the joint NASA/JAXA GPM mission.
Data provided by the joint NASA/JAXA GPM mission.
also referred to as: IMERG
Data Compilation - NASA/GSFC - 9/13/2021 10:41Z - 9/14/2021 11:11ZGOES-16/ABI
9/13/2021 10:41Z - 9/14/2021 11:11Z
Advanced Baseline Imager (ABI) has 16 spectral bands, including two visible channels, four near-infrared channels and ten infrared channels. It is nearly identical to the imagers on Himawari 8 and Himawari 9.
This item is part of these series:
GPM Animations
Hurricanes
Keywords:
DLESE >> Atmospheric science
SVS >> Gulf Coast
DLESE >> Hydrology
DLESE >> Natural hazards
GCMD >> Earth Science >> Atmosphere >> Atmospheric Phenomena >> Hurricanes
GCMD >> Earth Science >> Atmosphere >> Precipitation >> Rain
GCMD >> Location >> Gulf Of Mexico
GCMD >> Location >> Louisiana
SVS >> Hyperwall
NASA Science >> Earth
NASA Earth Science Focus Areas >> Weather and Atmospheric Dynamics
GCMD keywords can be found on the Internet with the following citation: Olsen, L.M., G. Major, K. Shein, J. Scialdone, S. Ritz, T. Stevens, M. Morahan, A. Aleman, R. Vogel, S. Leicester, H. Weir, M. Meaux, S. Grebas, C.Solomon, M. Holland, T. Northcutt, R. A. Restrepo, R. Bilodeau, 2013. NASA/Global Change Master Directory (GCMD) Earth Science Keywords. Version 8.0.0.0.0


