Earth
ID: 4563
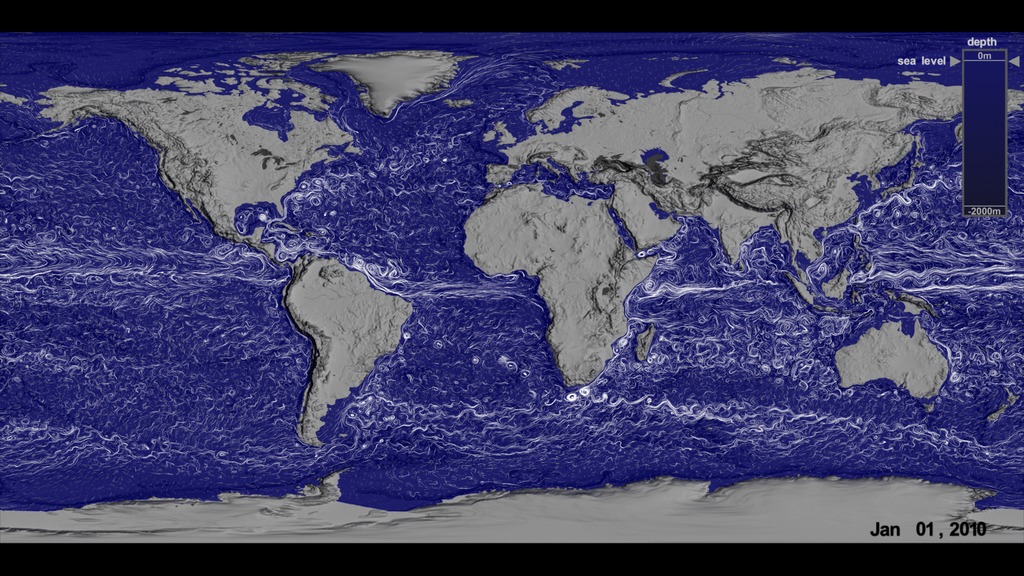
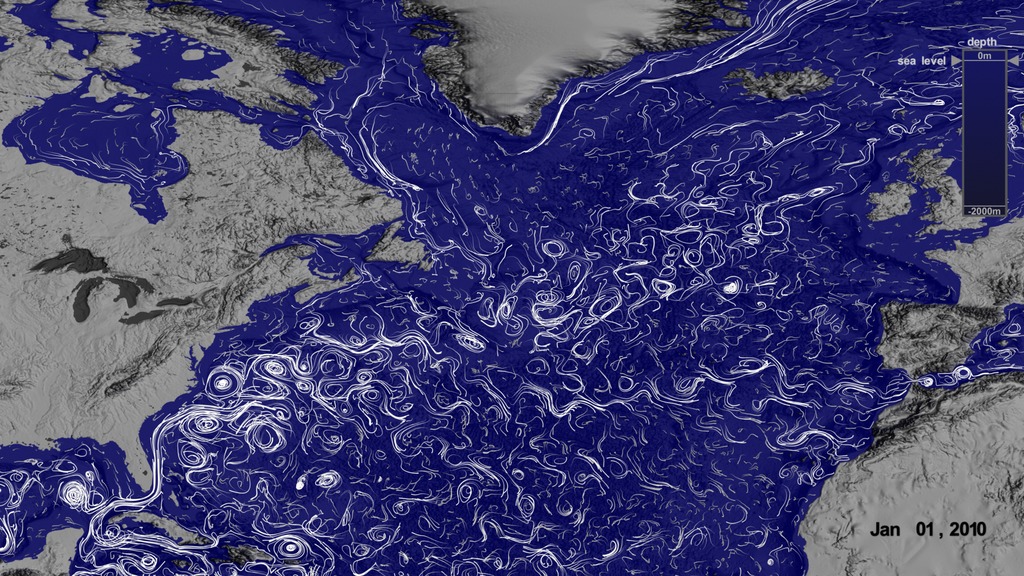
These visualizations show ocean current flows first at sea level then at 2000 meters below sea level. There are 2 versions of each visualization: one version is global; the second version is of the Northern Atlantic.
Notice some of the differences in speed and direction of the flows between sea level and 2000 meters below sea level. For example, the Gulf Stream off the coast of Eastern North America flows strongly towards the northeast, while at 2000 meters below sea level, the flow is weaker and in the opposite direction.
These animations were created in support of an educational series produced by WGBH.
Ocean flows at surface and 2000 meters below sea level
Notice some of the differences in speed and direction of the flows between sea level and 2000 meters below sea level. For example, the Gulf Stream off the coast of Eastern North America flows strongly towards the northeast, while at 2000 meters below sea level, the flow is weaker and in the opposite direction.
These animations were created in support of an educational series produced by WGBH.
Visualization Credits
Greg Shirah (NASA/GSFC): Lead Visualizer
Horace Mitchell (NASA/GSFC): Visualizer
Laurence Schuler (ADNET Systems, Inc.): Technical Support
Ian Jones (ADNET Systems, Inc.): Technical Support
Susan Lozier (Duke University): Scientist
Rachel Connolly (MIT): Lead Producer
Horace Mitchell (NASA/GSFC): Visualizer
Laurence Schuler (ADNET Systems, Inc.): Technical Support
Ian Jones (ADNET Systems, Inc.): Technical Support
Susan Lozier (Duke University): Scientist
Rachel Connolly (MIT): Lead Producer
Please give credit for this item to:
NASA's Scientific Visualization Studio
NASA's Scientific Visualization Studio
Short URL to share this page:
https://svs.gsfc.nasa.gov/4563
Data Used:
Note: While we identify the data sets used in these visualizations, we do not store any further details nor the data sets themselves on our site.
Keywords:
DLESE >> Physical oceanography
GCMD >> Earth Science >> Oceans >> Ocean Circulation >> Ocean Currents
SVS >> Hyperwall
NASA Science >> Earth
SVS >> Ocean
GCMD keywords can be found on the Internet with the following citation: Olsen, L.M., G. Major, K. Shein, J. Scialdone, S. Ritz, T. Stevens, M. Morahan, A. Aleman, R. Vogel, S. Leicester, H. Weir, M. Meaux, S. Grebas, C.Solomon, M. Holland, T. Northcutt, R. A. Restrepo, R. Bilodeau, 2013. NASA/Global Change Master Directory (GCMD) Earth Science Keywords. Version 8.0.0.0.0
https://svs.gsfc.nasa.gov/4563
Data Used:
GTOPO30 Topography and Bathymetry
Data Compilation - USGSECCO2 High Resolution Ocean and Sea Ice Model also referred to as: ECCO2
Model - NASA/JPL - 01/2010 - 12/2012Keywords:
DLESE >> Physical oceanography
GCMD >> Earth Science >> Oceans >> Ocean Circulation >> Ocean Currents
SVS >> Hyperwall
NASA Science >> Earth
SVS >> Ocean
GCMD keywords can be found on the Internet with the following citation: Olsen, L.M., G. Major, K. Shein, J. Scialdone, S. Ritz, T. Stevens, M. Morahan, A. Aleman, R. Vogel, S. Leicester, H. Weir, M. Meaux, S. Grebas, C.Solomon, M. Holland, T. Northcutt, R. A. Restrepo, R. Bilodeau, 2013. NASA/Global Change Master Directory (GCMD) Earth Science Keywords. Version 8.0.0.0.0


