Earth
ID: 4400
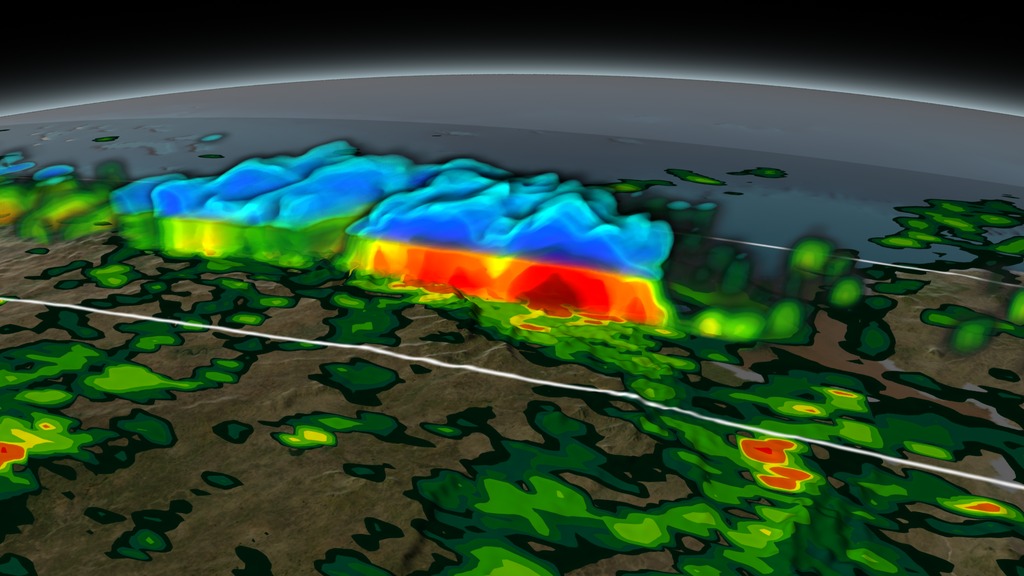
GPM scanned this storm structure over the western coast of India on July 28th, 2014 at 03:58 UTC. The most intense sections of the storm with the heaviest rainfall are shown in dark red. Three days later, on July 31st, a deadly landslide occurred in the same region.
Scientists are currently studying heavy precipitation events such as this one in order to better predict landslides in the future.
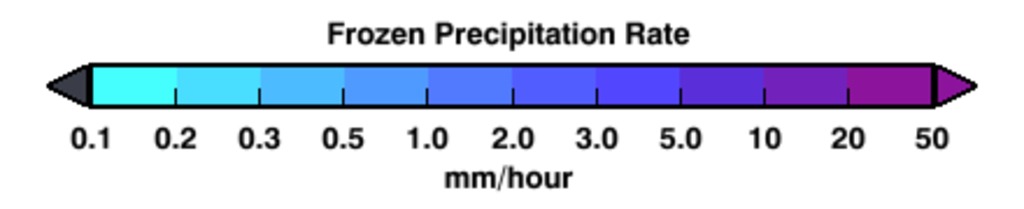
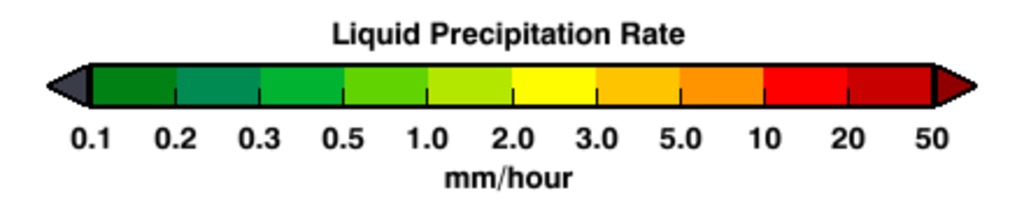
The GPM Core Observatory carries two instruments that show the location and intensity of rain and snow, which defines a crucial part of the storm structure – and how it will behave. The GPM Microwave Imager sees through the tops of clouds to observe how much and where precipitation occurs, and the Dual-frequency Precipitation Radar observes precise details of precipitation in 3-dimensions.
India Monsoon - July 2014
Scientists are currently studying heavy precipitation events such as this one in order to better predict landslides in the future.
The GPM Core Observatory carries two instruments that show the location and intensity of rain and snow, which defines a crucial part of the storm structure – and how it will behave. The GPM Microwave Imager sees through the tops of clouds to observe how much and where precipitation occurs, and the Dual-frequency Precipitation Radar observes precise details of precipitation in 3-dimensions.
Visualization Credits
Kel Elkins (USRA): Lead Visualizer
Alex Kekesi (Global Science and Technology, Inc.): Visualizer
Dalia B Kirschbaum (NASA/GSFC): Lead Scientist
Gail Skofronick Jackson (NASA/GSFC): Lead Scientist
George Huffman (NASA/GSFC): Lead Scientist
Ryan Fitzgibbons (USRA): Lead Producer
Alex Kekesi (Global Science and Technology, Inc.): Visualizer
Dalia B Kirschbaum (NASA/GSFC): Lead Scientist
Gail Skofronick Jackson (NASA/GSFC): Lead Scientist
George Huffman (NASA/GSFC): Lead Scientist
Ryan Fitzgibbons (USRA): Lead Producer
Please give credit for this item to:
NASA's Scientific Visualization Studio
NASA's Scientific Visualization Studio
Short URL to share this page:
https://svs.gsfc.nasa.gov/4400
Mission:
Global Precipitation Measurement (GPM)
Data Used:
Note: While we identify the data sets used in these visualizations, we do not store any further details nor the data sets themselves on our site.
Keywords:
SVS >> Hyperwall
NASA Science >> Earth
https://svs.gsfc.nasa.gov/4400
Mission:
Global Precipitation Measurement (GPM)
Data Used:
GPM/GMI/Surface Precipitation also referred to as: Rain Rates
7/28/2014 02:57Z
Credit:
Data provided by the joint NASA/JAXA GPM mission.
Data provided by the joint NASA/JAXA GPM mission.
GPM/DPR/Ku also referred to as: Volumetric Precipitation data
Observed Data - JAXA - 7/28/2014 02:57Z
Credit:
Data provided by the joint NASA/JAXA GPM mission.
Data provided by the joint NASA/JAXA GPM mission.
Keywords:
SVS >> Hyperwall
NASA Science >> Earth


