Greenhouse Warming Linked to Shifts in Rainfall
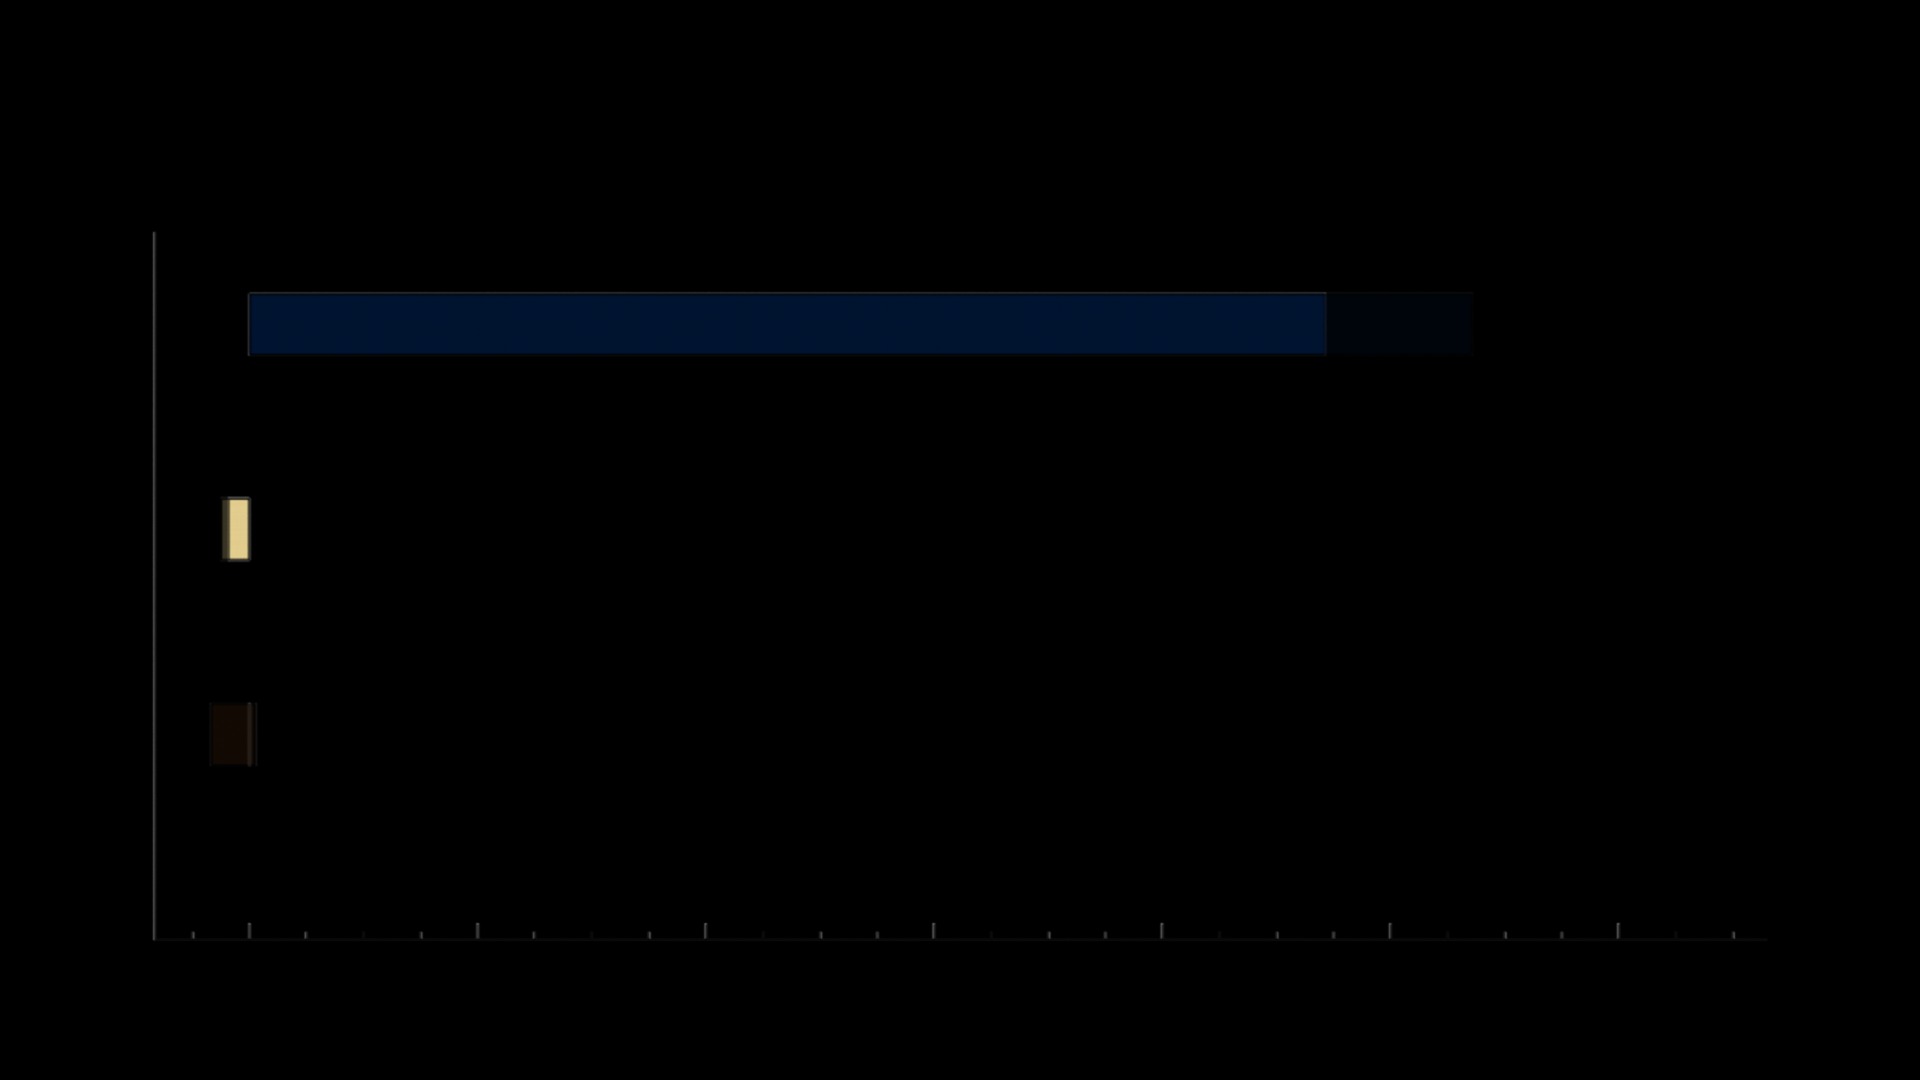
The models project for every 1 degree Fahrenheit of carbon dioxide-induced warming, heavy rainfall will increase globally by 3.9 percent and light rain will increase globally by 1 percent. However, total global rainfall is not projected to change much because moderate rainfall will decrease globally by 1.4 percent.
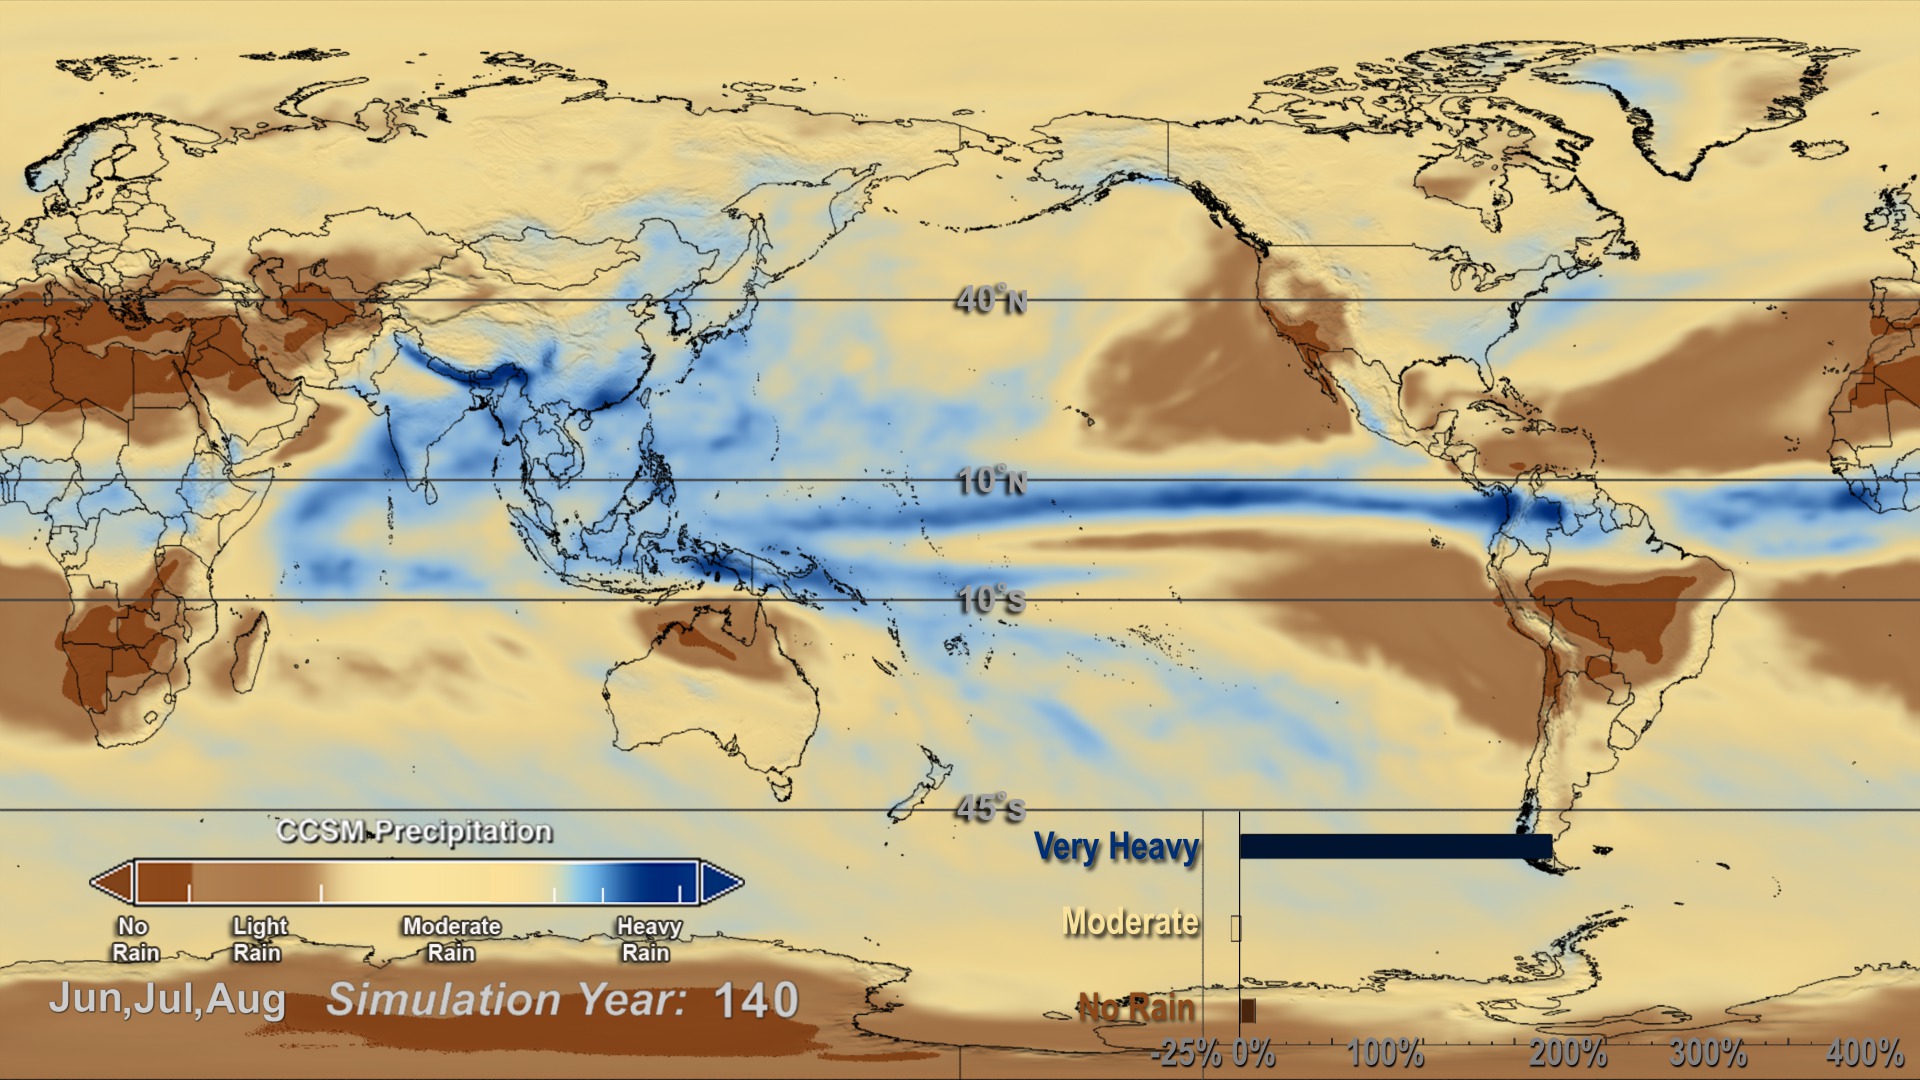
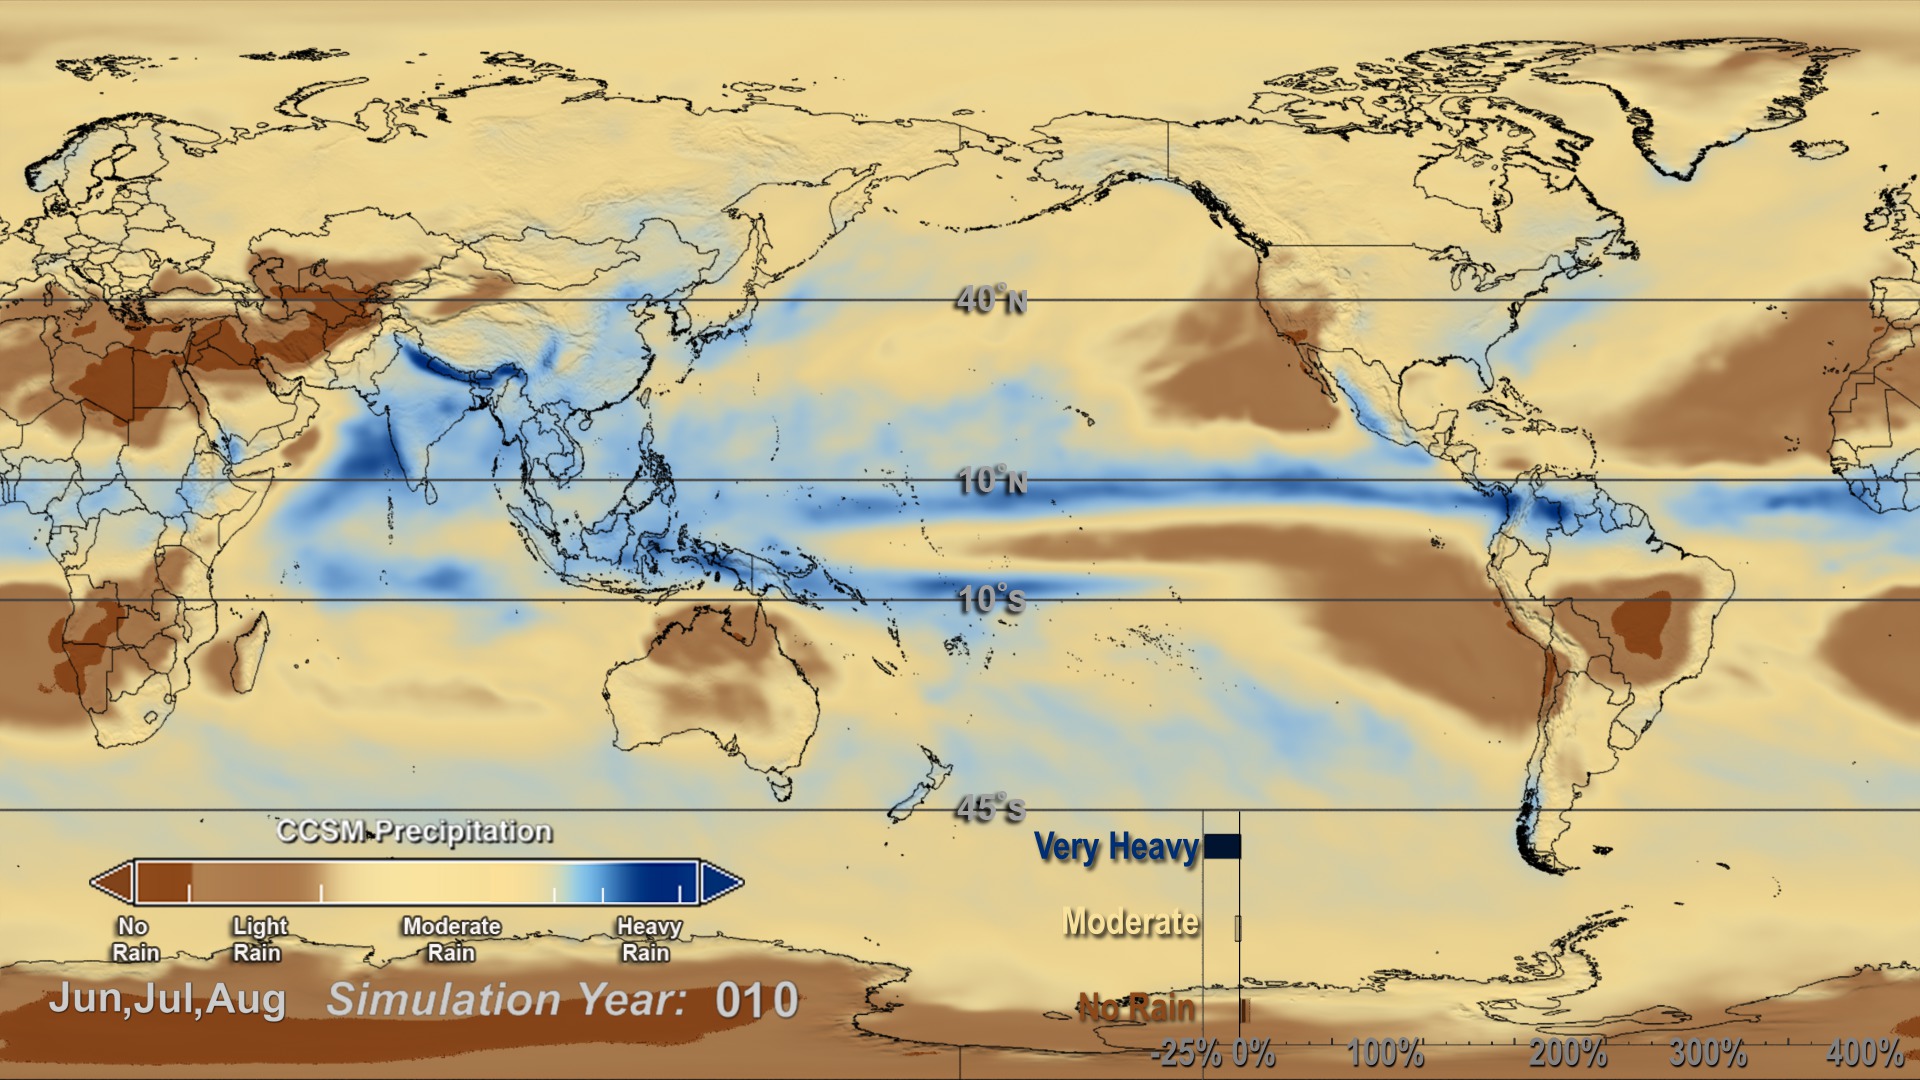
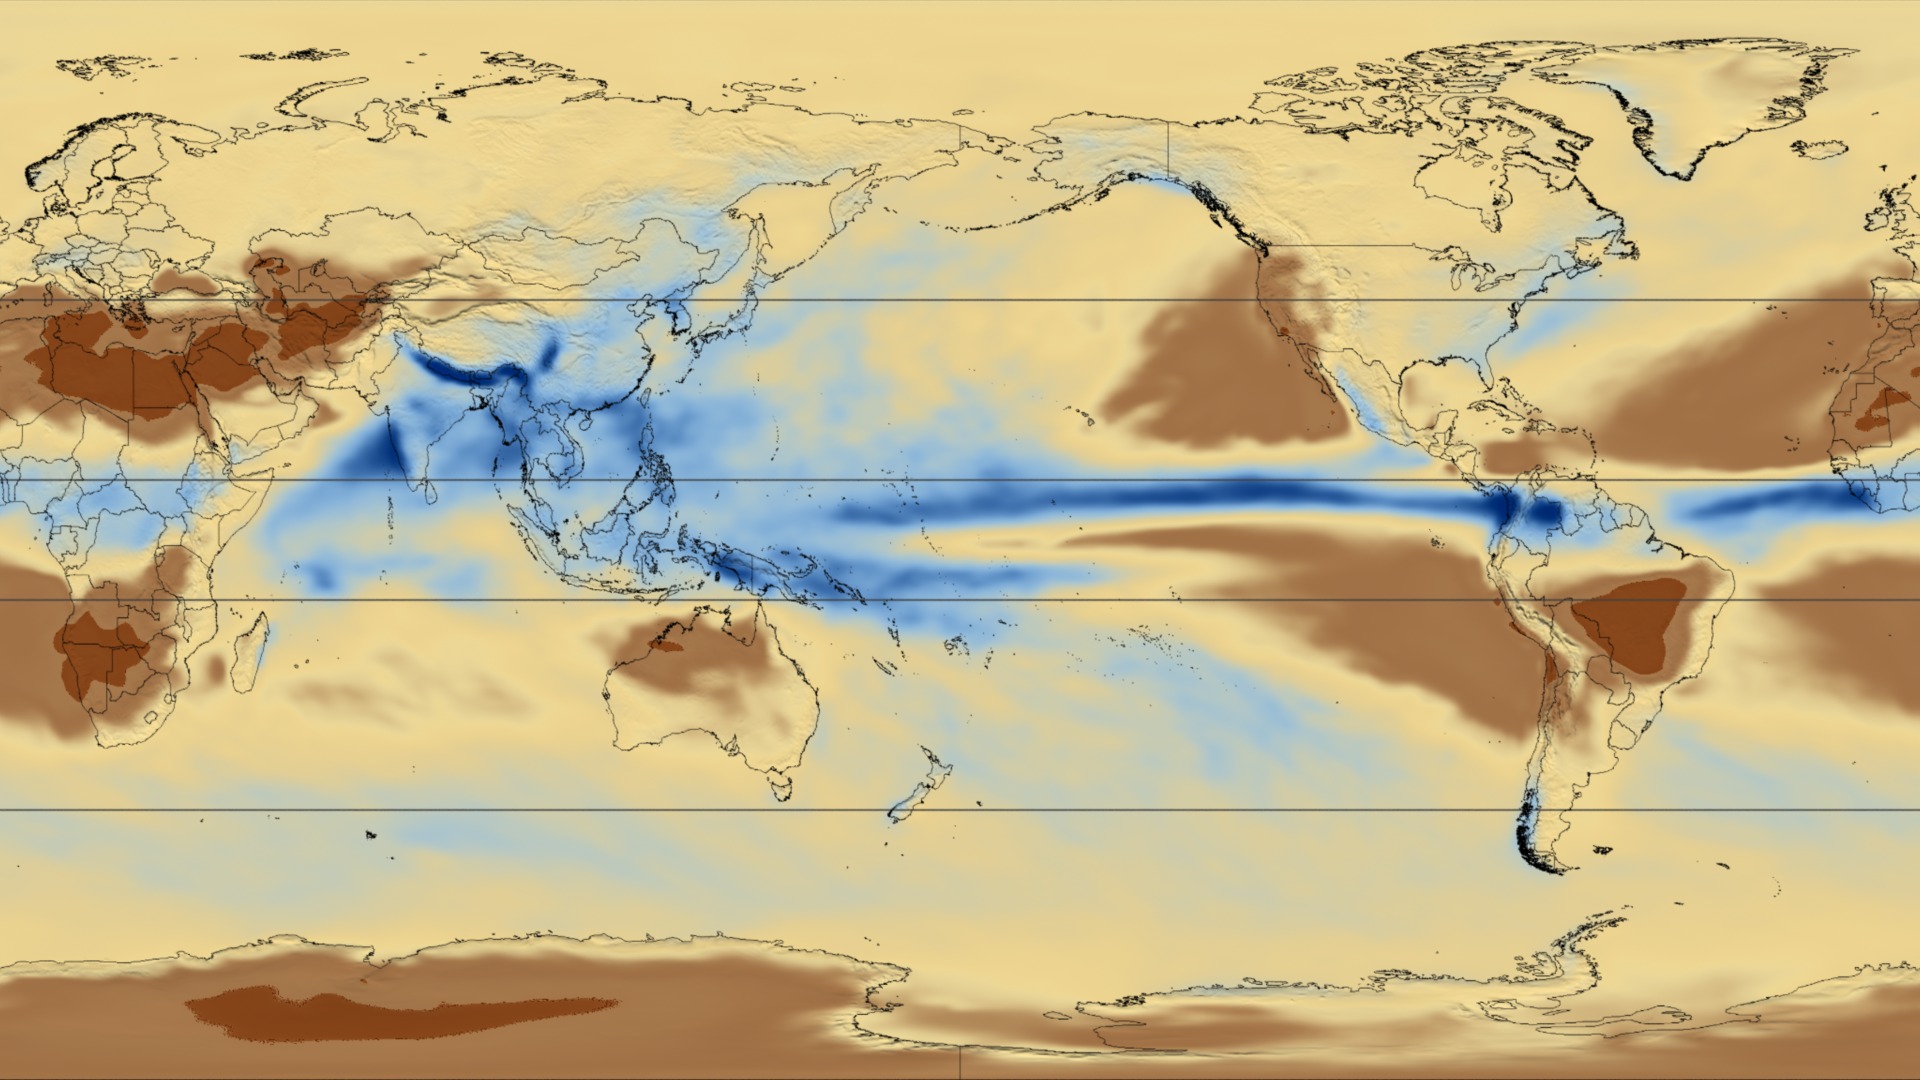
This visualization shows an average rainfall month for June,July, and August. The movie will display areas with no rain (brown), moderate rain (tan), and heavy rain (blue). Very Heavy rainfall (dark blue) is defined as months that receive an average of 0.95 of an inch of rain per day (24 mm/day) every day for the months of June, July, and August. Heavy rainfall is defined as months that receive an average of more than about 0.35 of an inch per day (9 mm/day). Light rain is defined as months that receive an average of less than 0.01 of an inch per day. Moderate rainfall is defined as months that receive an average of between about 0.04 to 0.09 of an inch per day.


For More Information
Related Documentation
Visualization Credits
William K. Lau (NASA/GSFC): Scientist
Huey-Tzu Wu (SSAI): Scientist
Kathryn Hansen (Wyle Information Systems): Writer
NASA/Goddard Space Flight Center Scientific Visualization Studio
https://svs.gsfc.nasa.gov/4073
Data Used:
CCSM
Model - NCAR - June, July, August year 1 through 140This item is part of these series:
Climate
Rainfall
Keywords:
DLESE >> Atmospheric science
SVS >> Climate
GCMD >> Earth Science >> Climate Indicators
GCMD >> Earth Science >> Atmosphere >> Precipitation
SVS >> Climate Patterns
NASA Science >> Earth
GCMD keywords can be found on the Internet with the following citation: Olsen, L.M., G. Major, K. Shein, J. Scialdone, S. Ritz, T. Stevens, M. Morahan, A. Aleman, R. Vogel, S. Leicester, H. Weir, M. Meaux, S. Grebas, C.Solomon, M. Holland, T. Northcutt, R. A. Restrepo, R. Bilodeau, 2013. NASA/Global Change Master Directory (GCMD) Earth Science Keywords. Version 8.0.0.0.0


