SDO Jewelbox: The Many Eyes of SDO
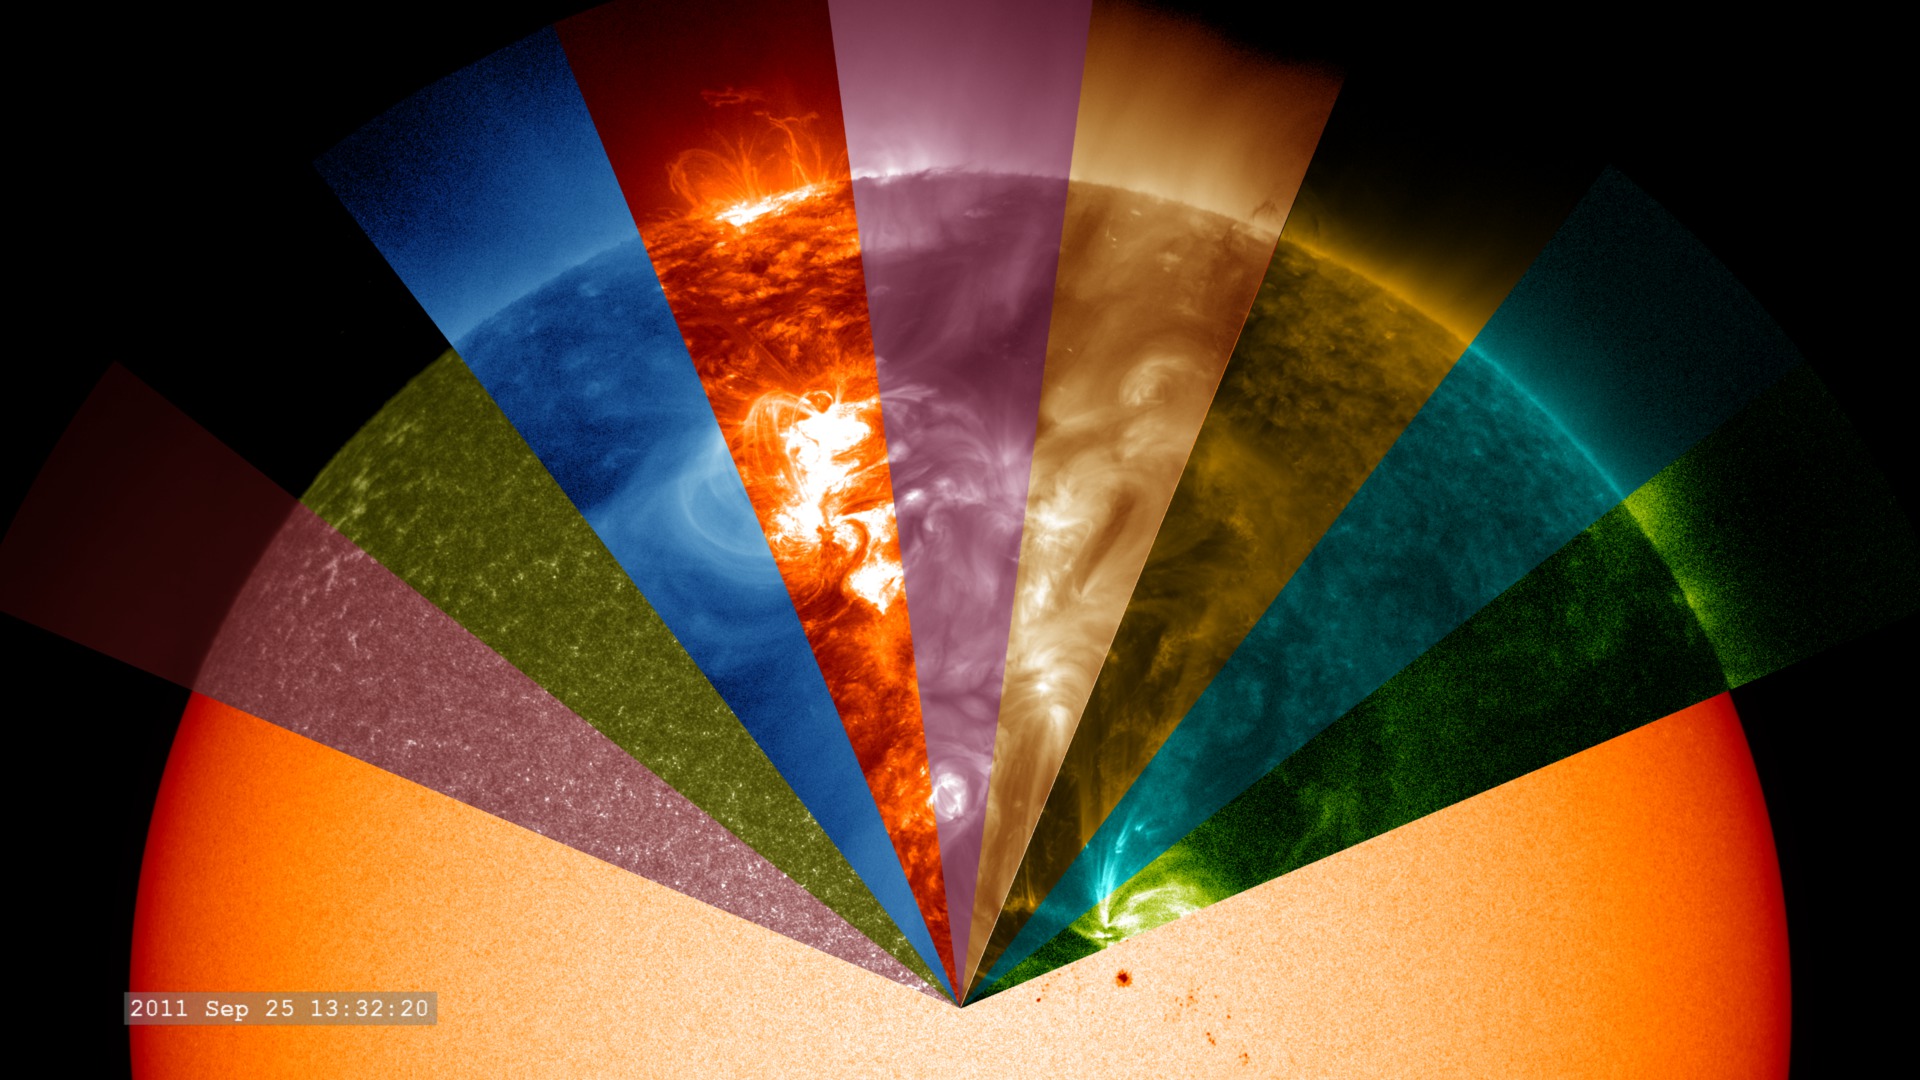
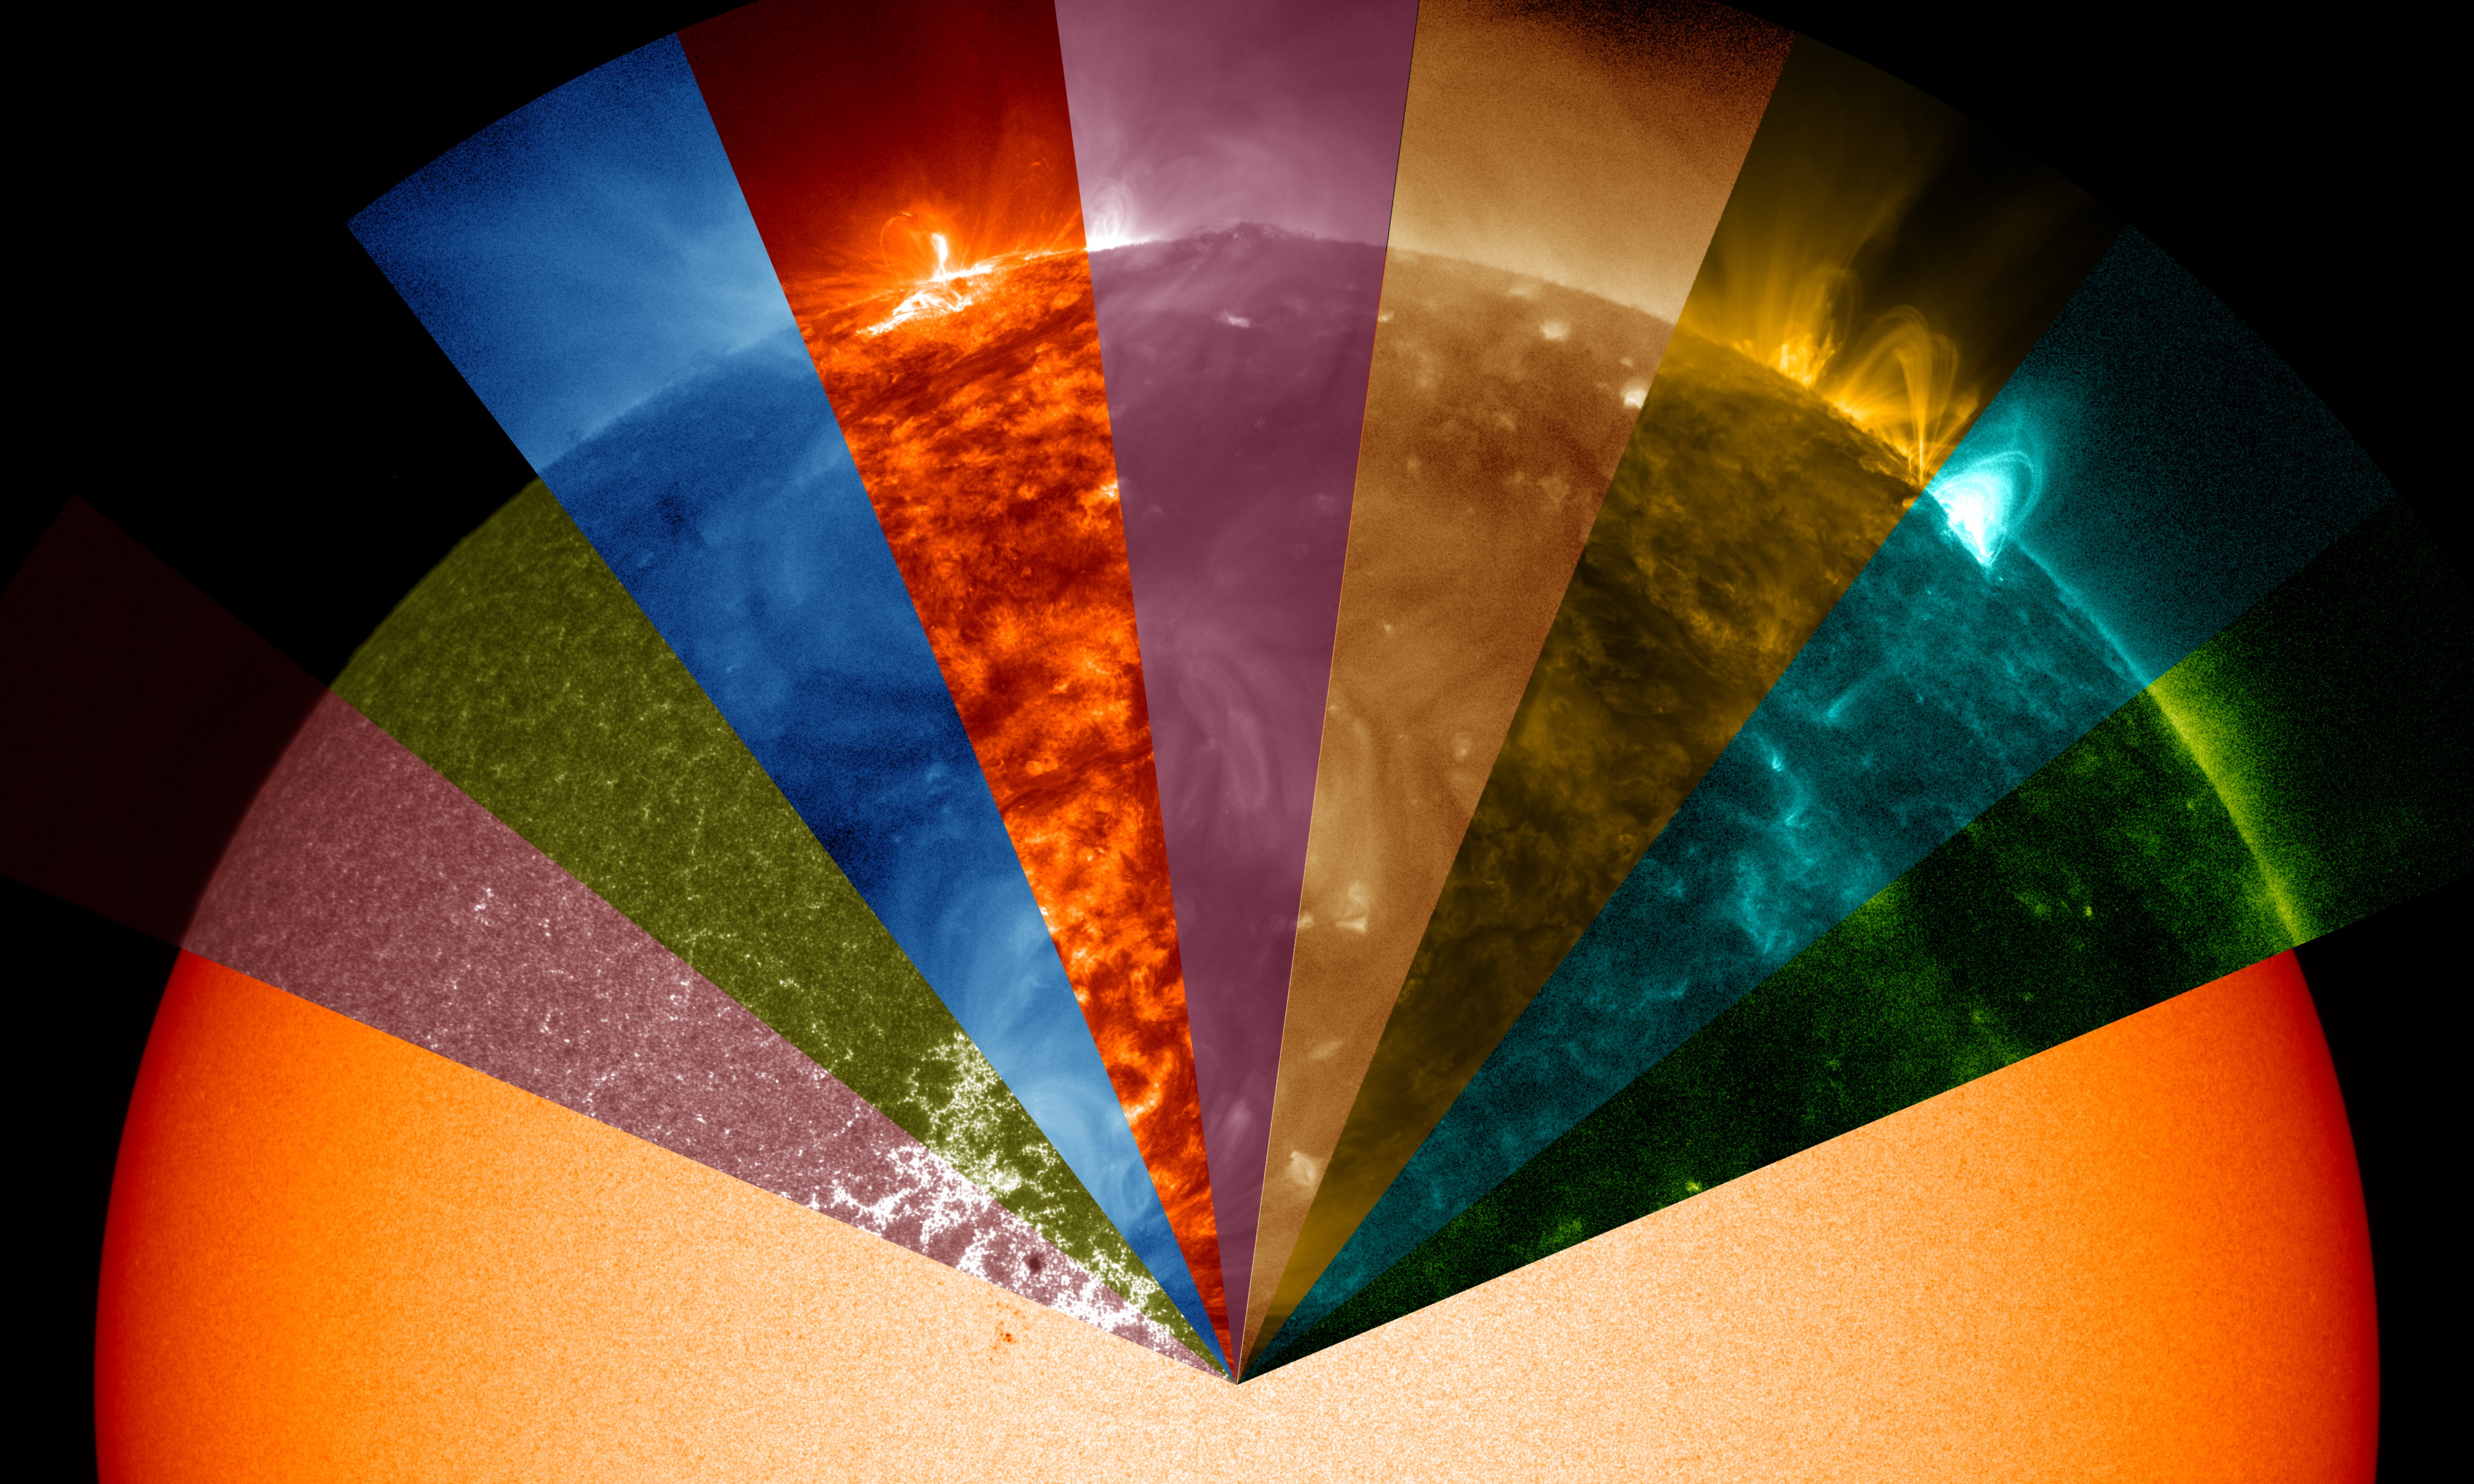
5x3 Layout view. This version has the imagery organized in order of increasing wavelength, from upper left to lower right for AIA. The HMI products occupy the bottom row.
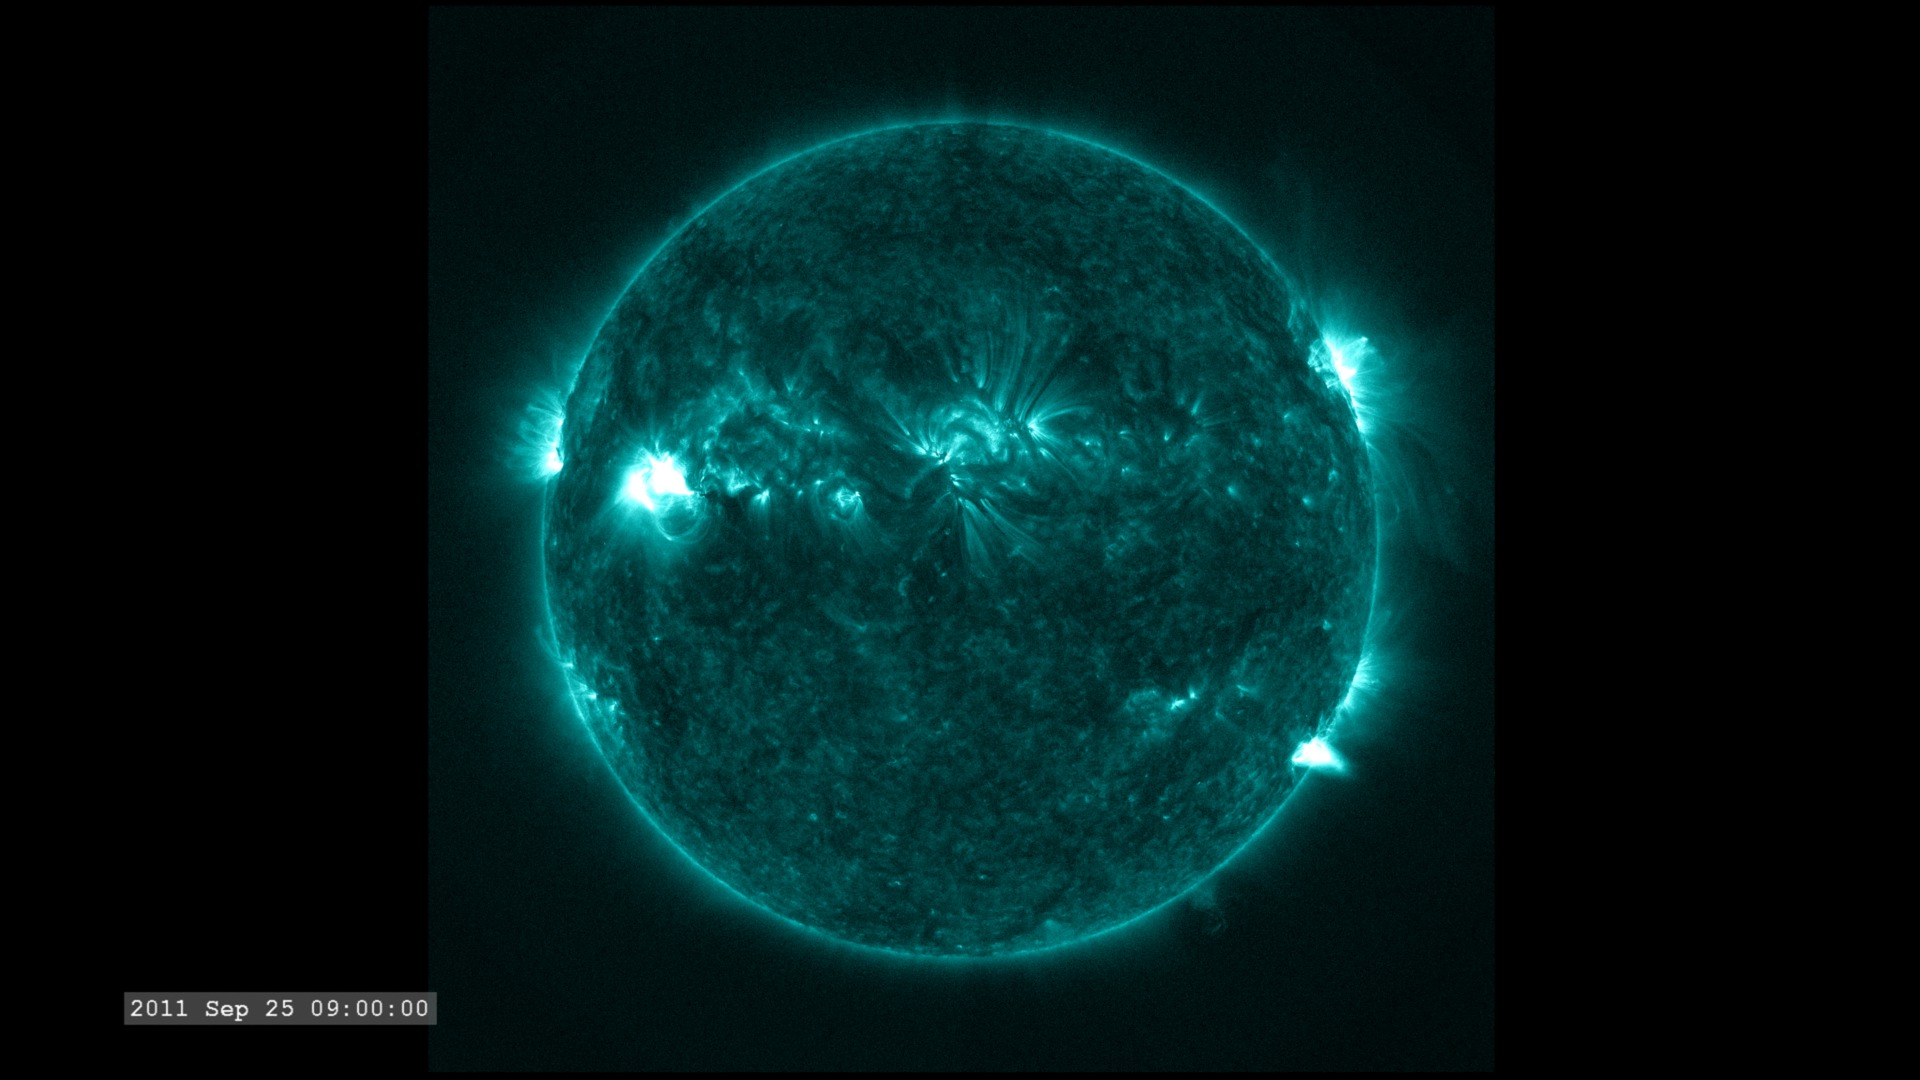
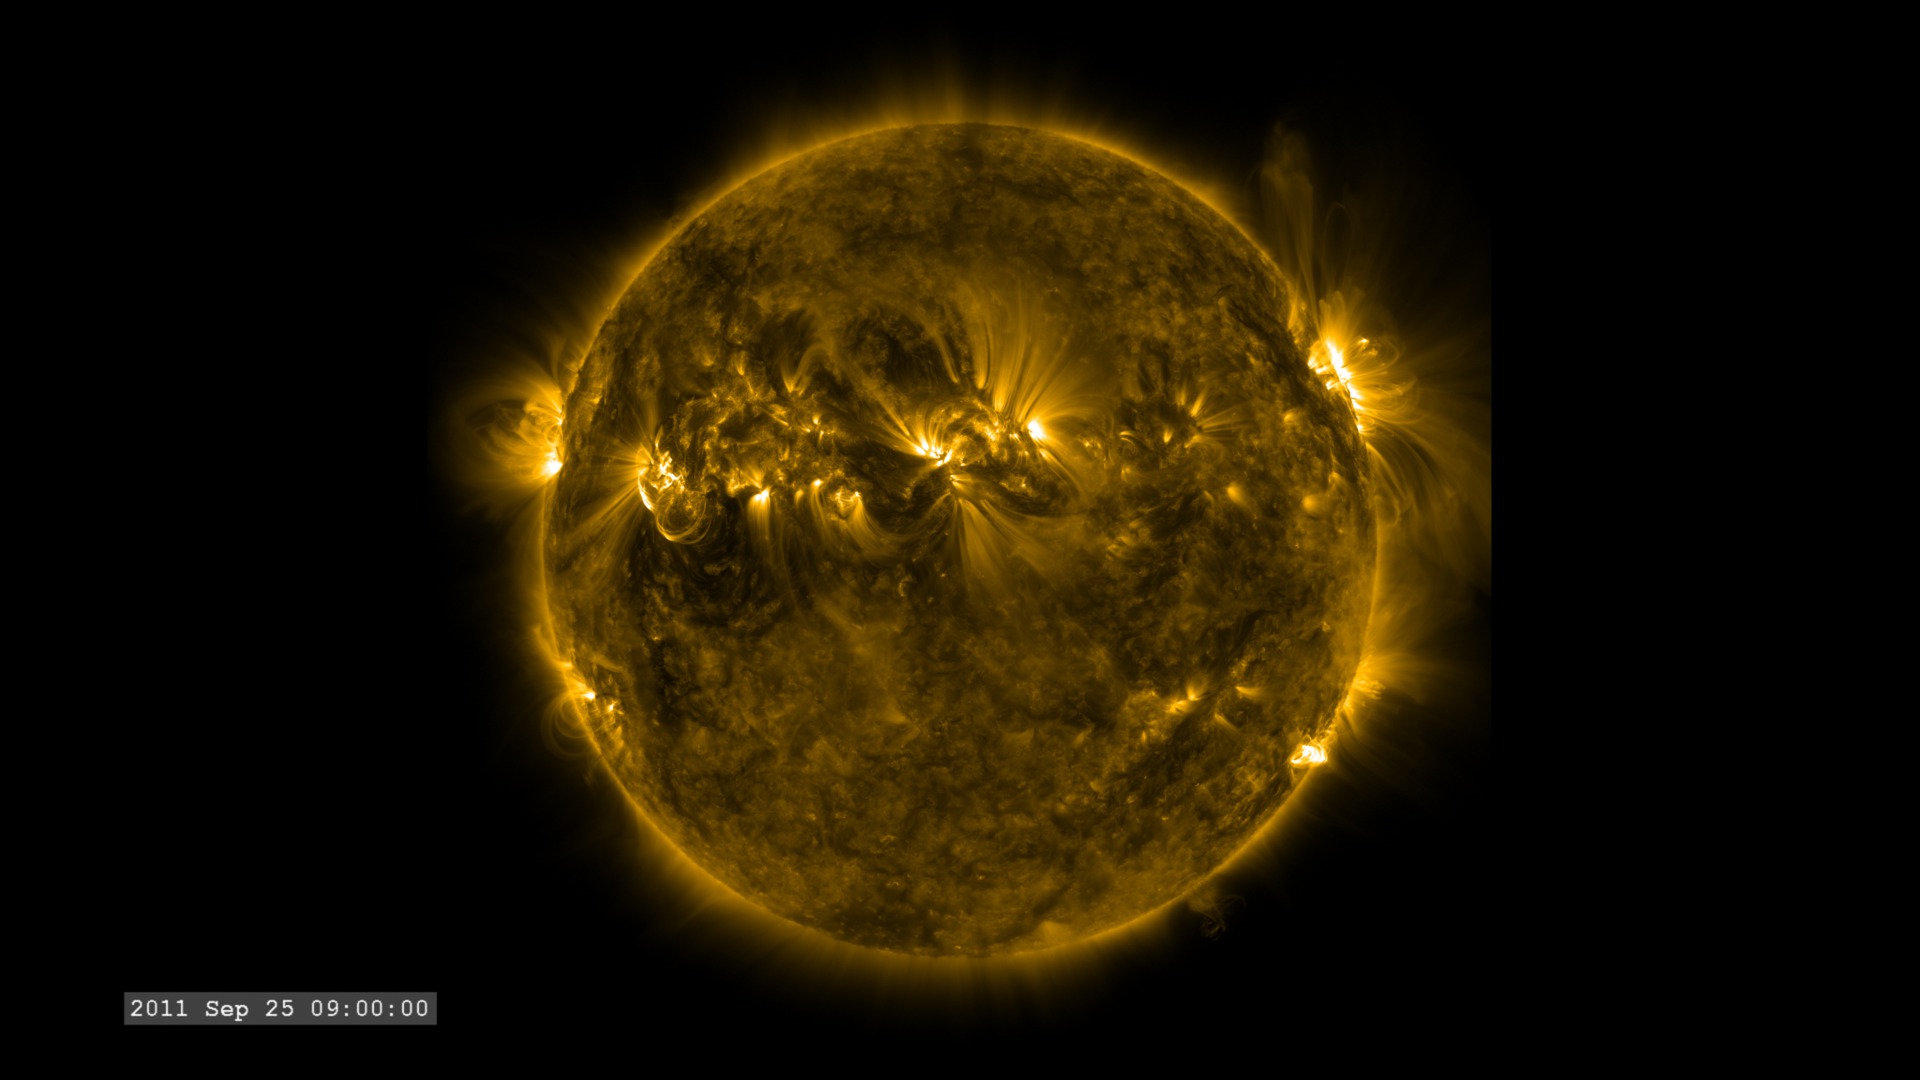
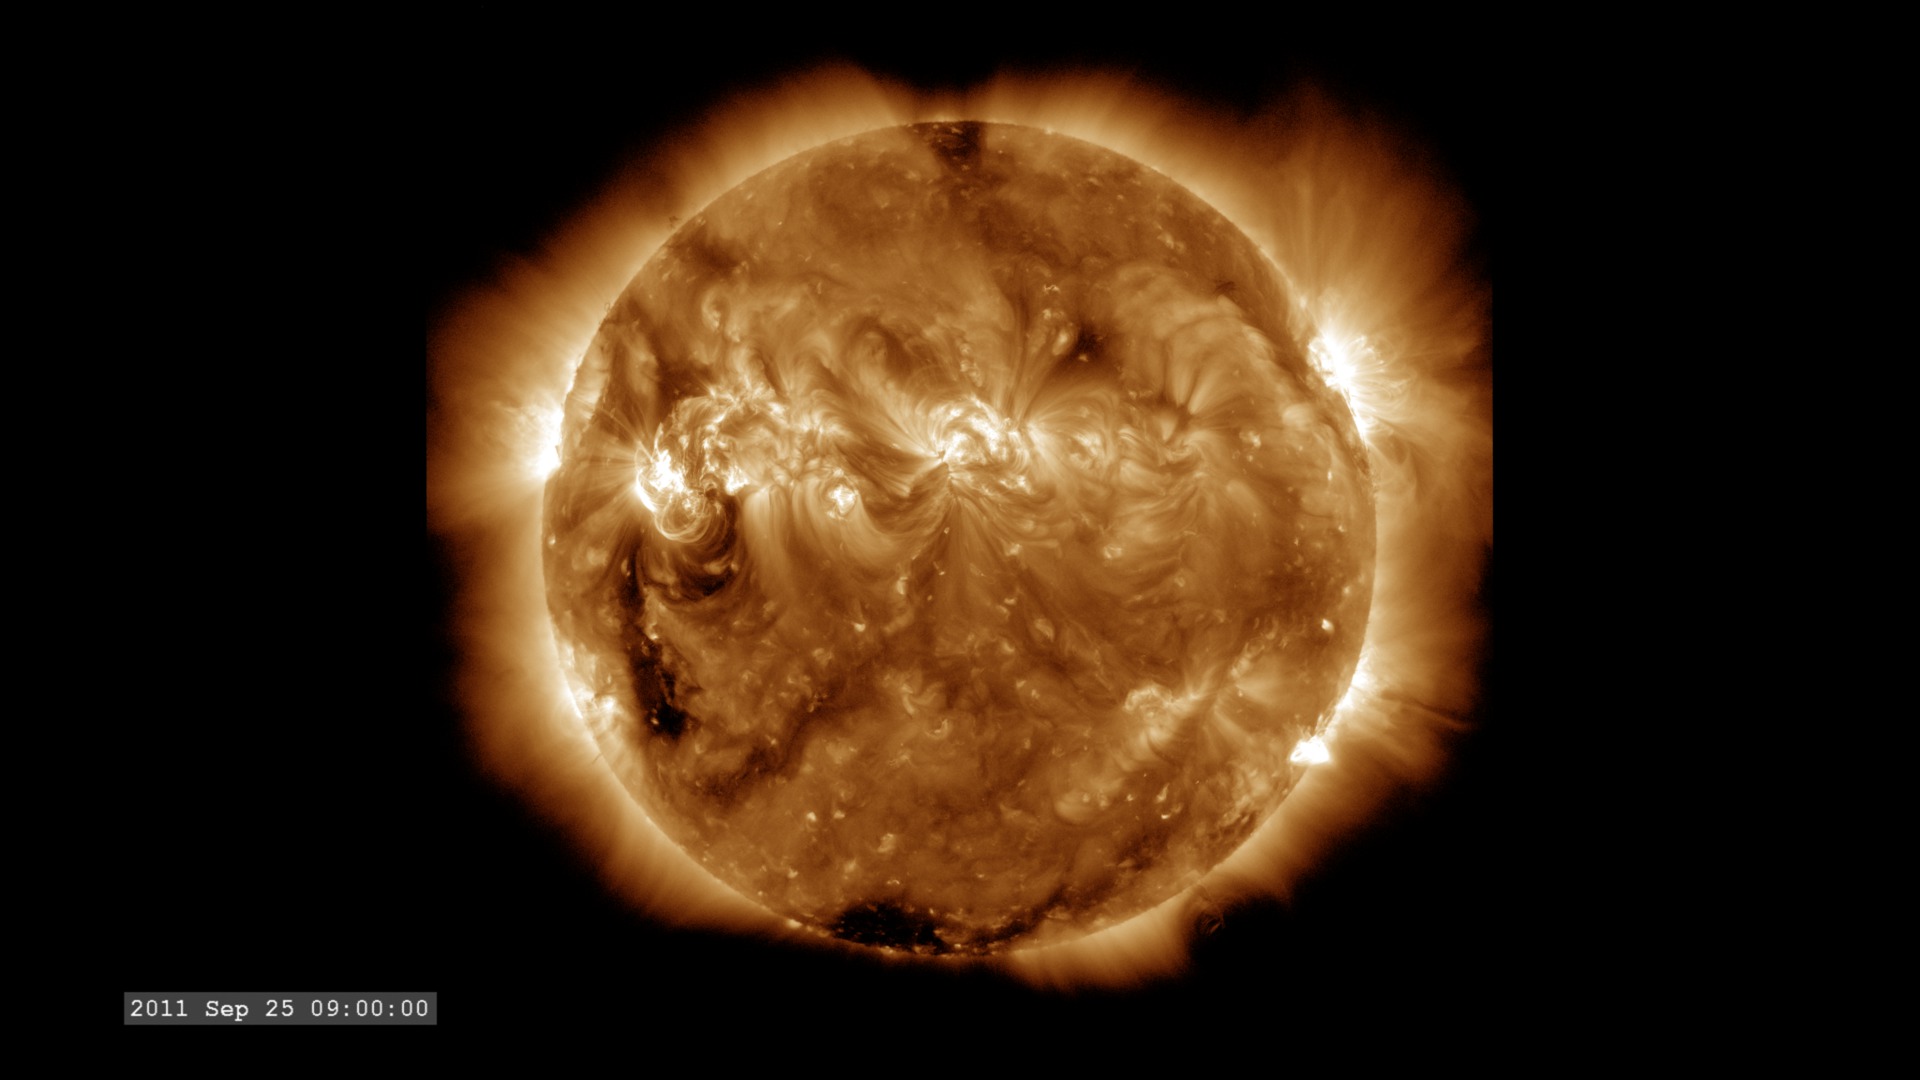
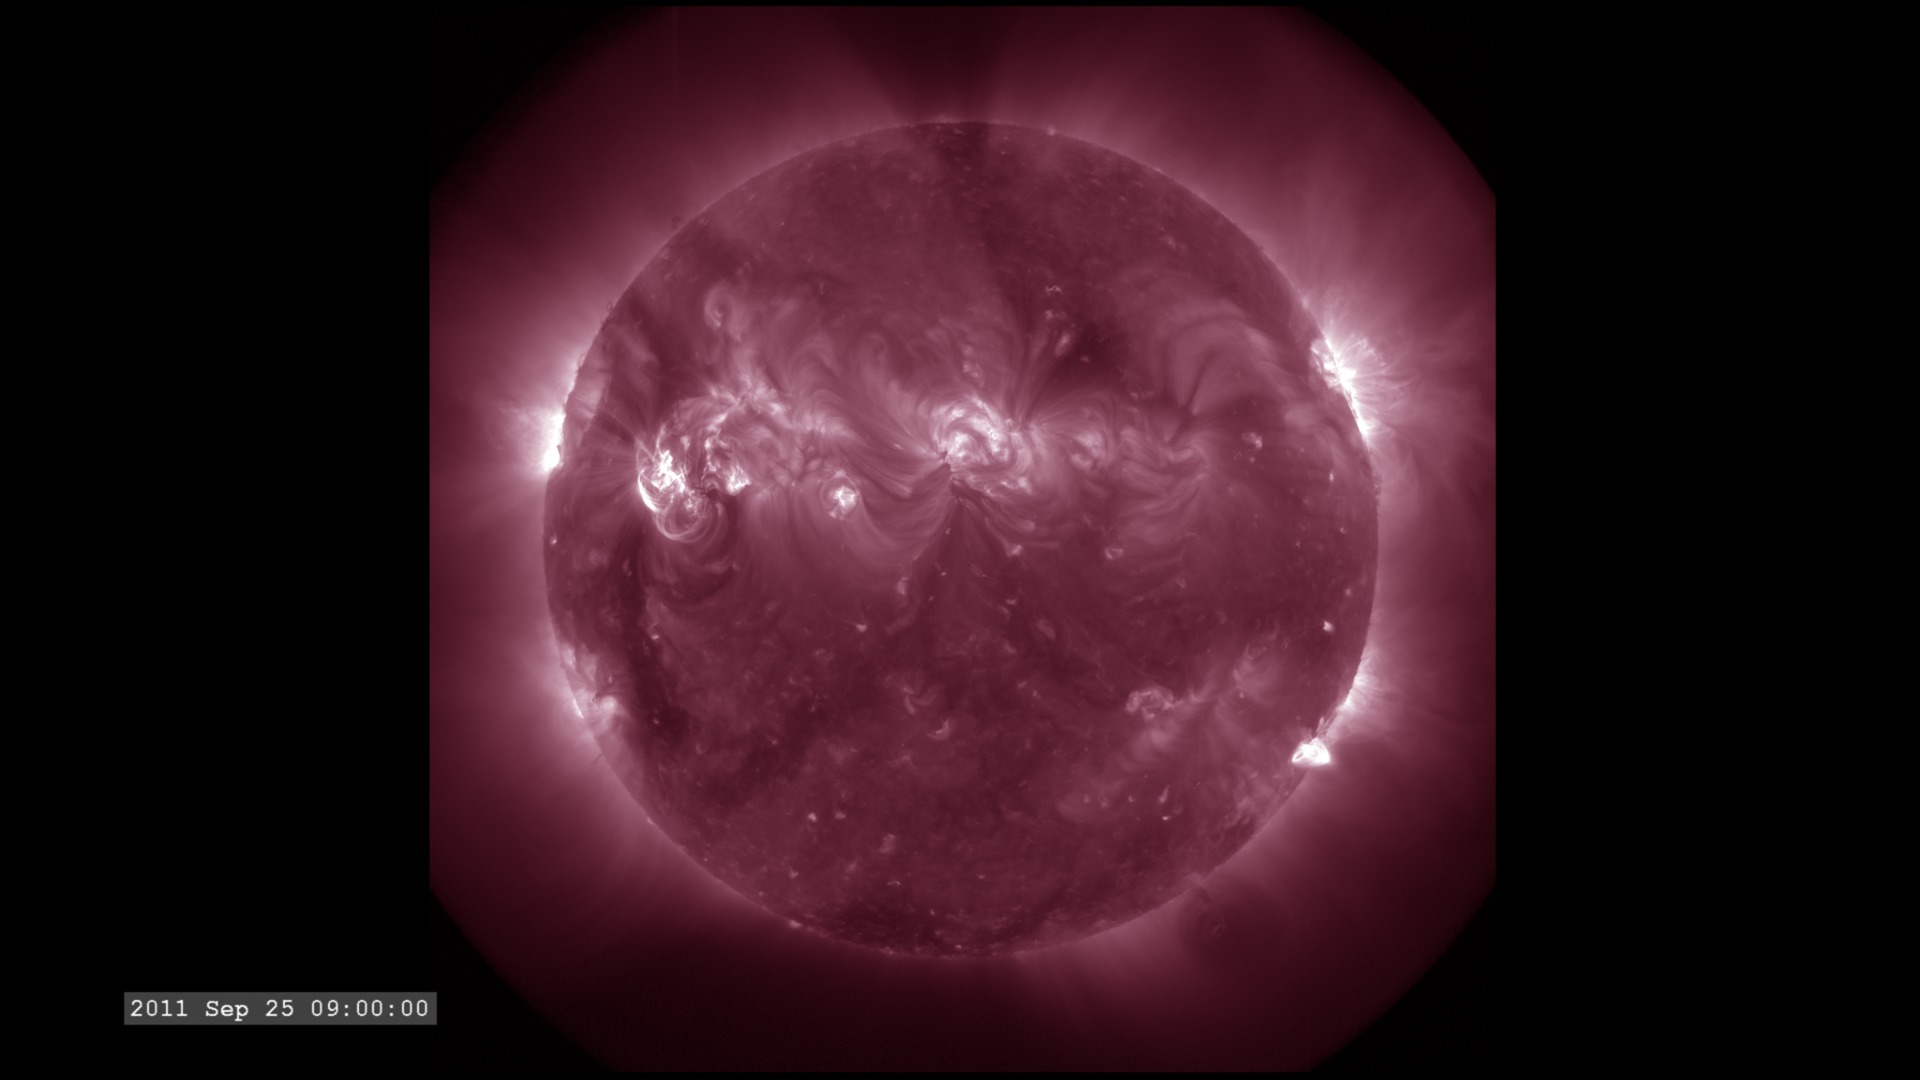
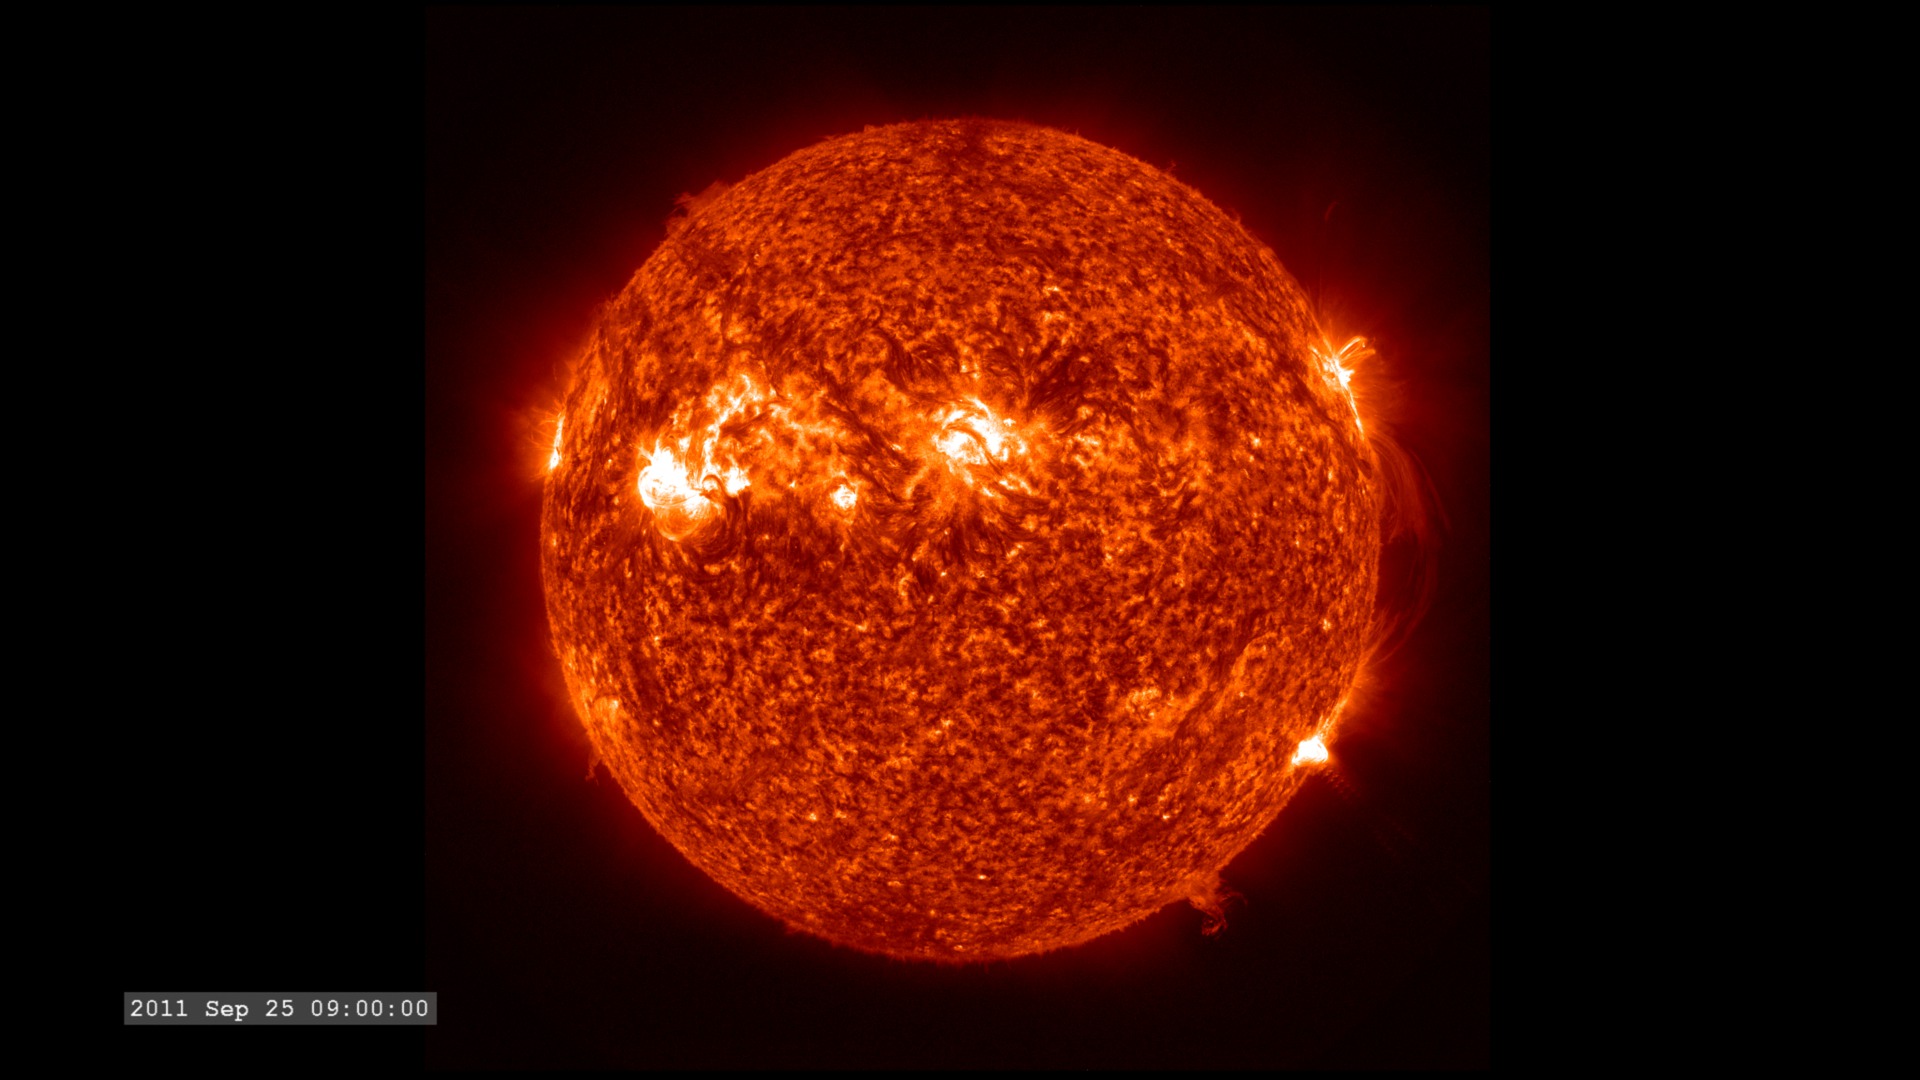
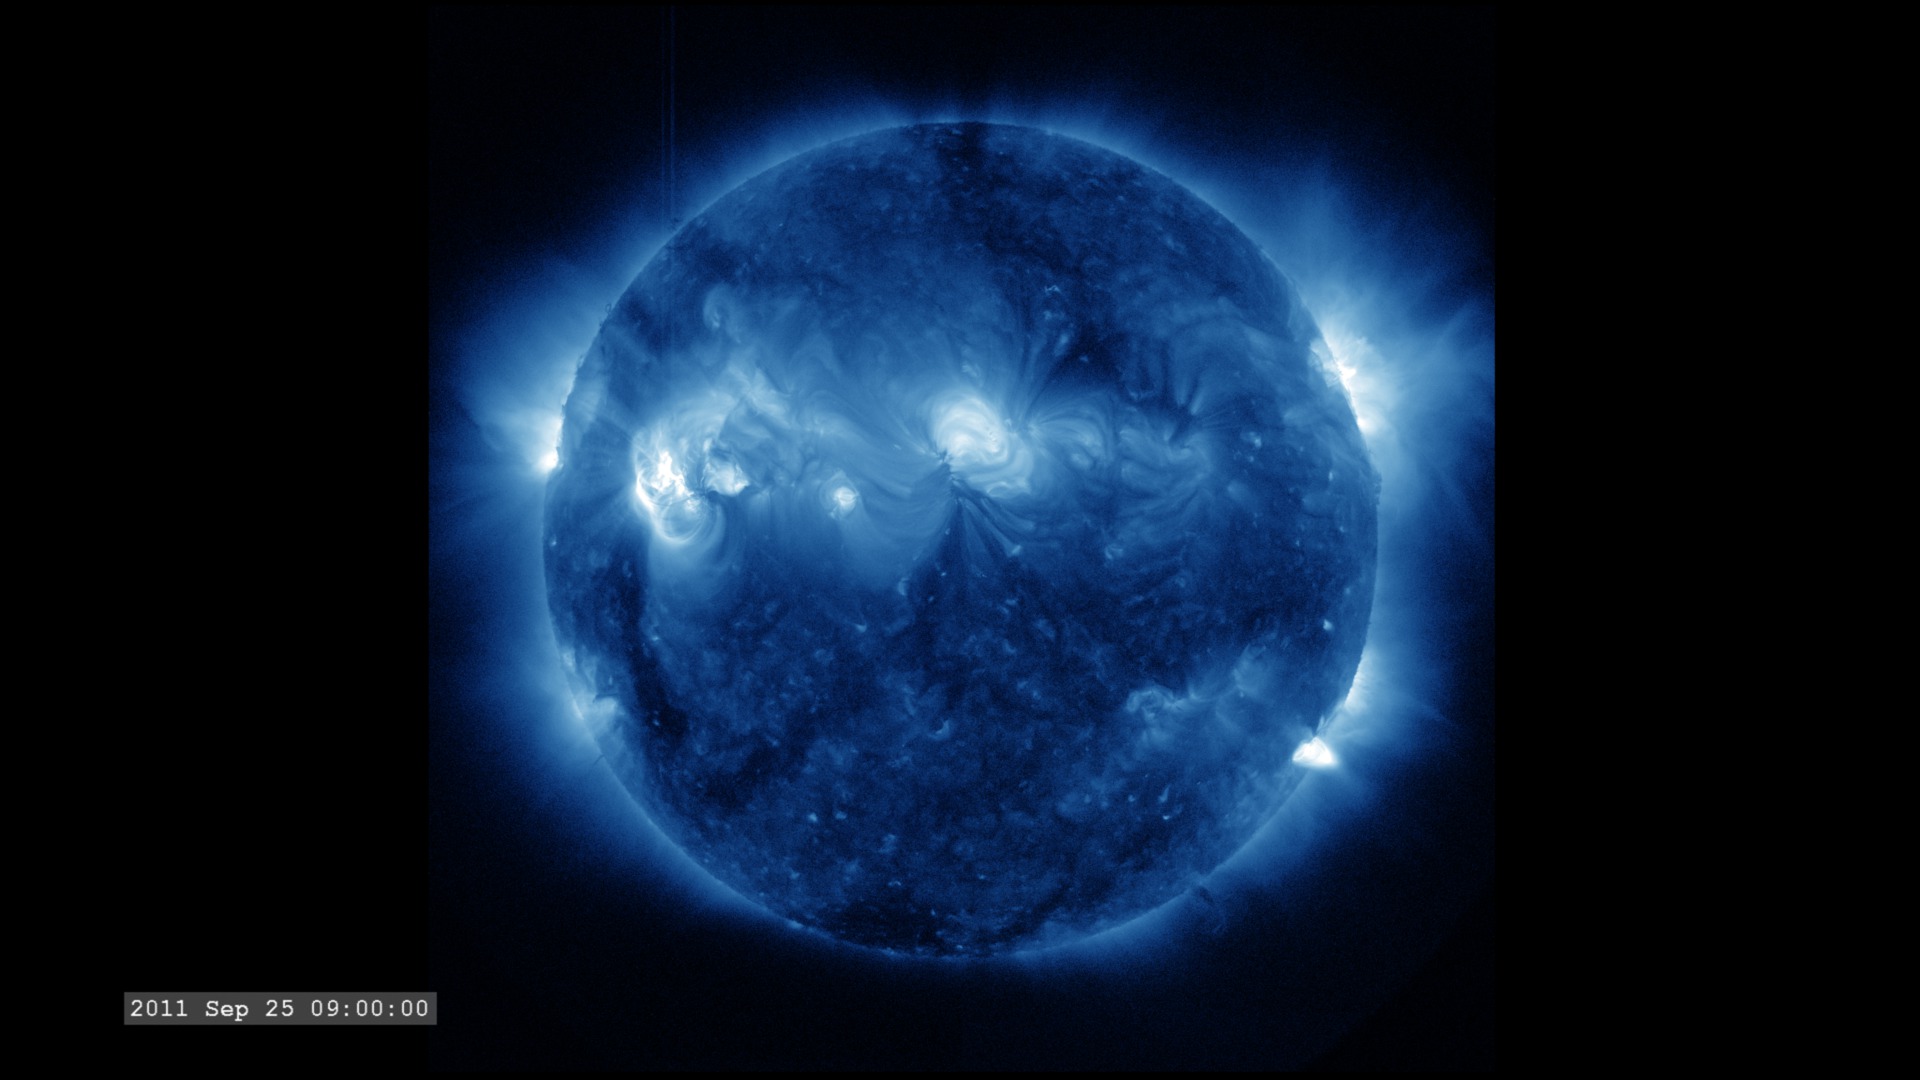
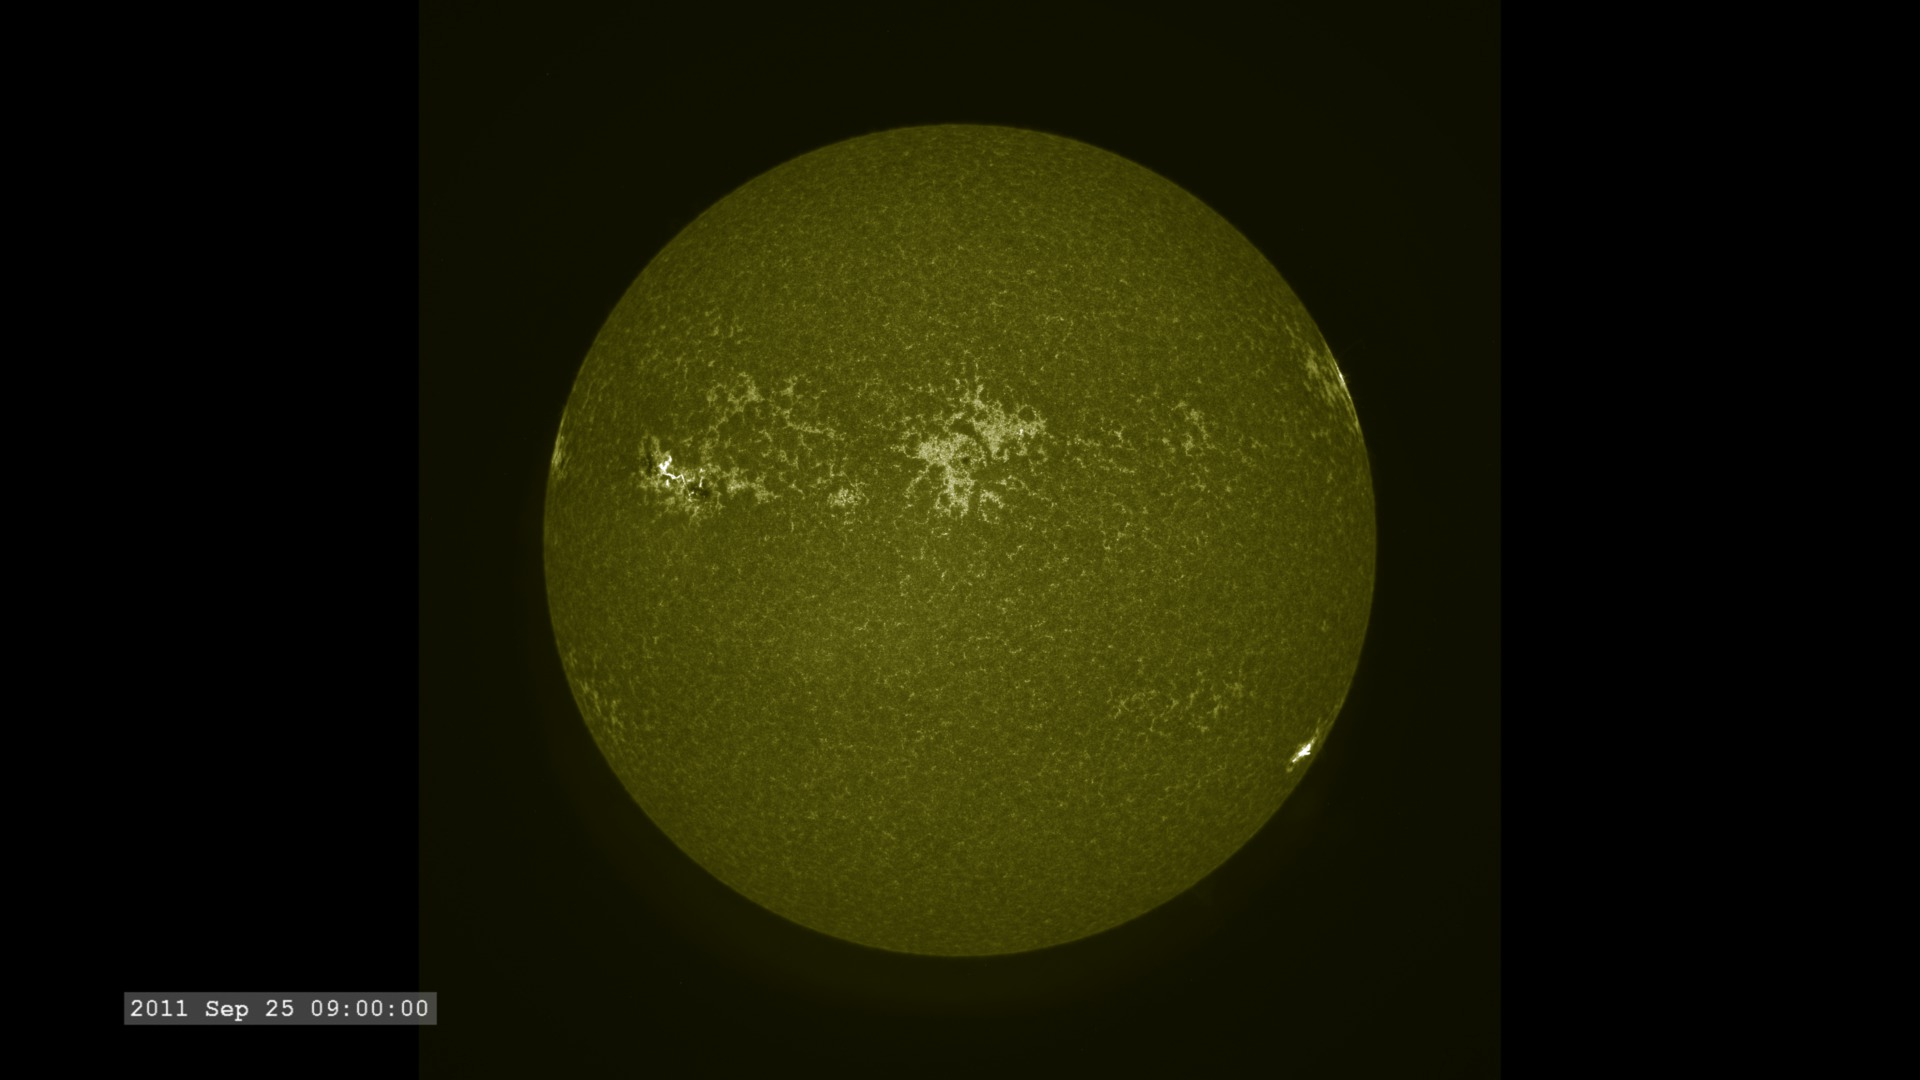
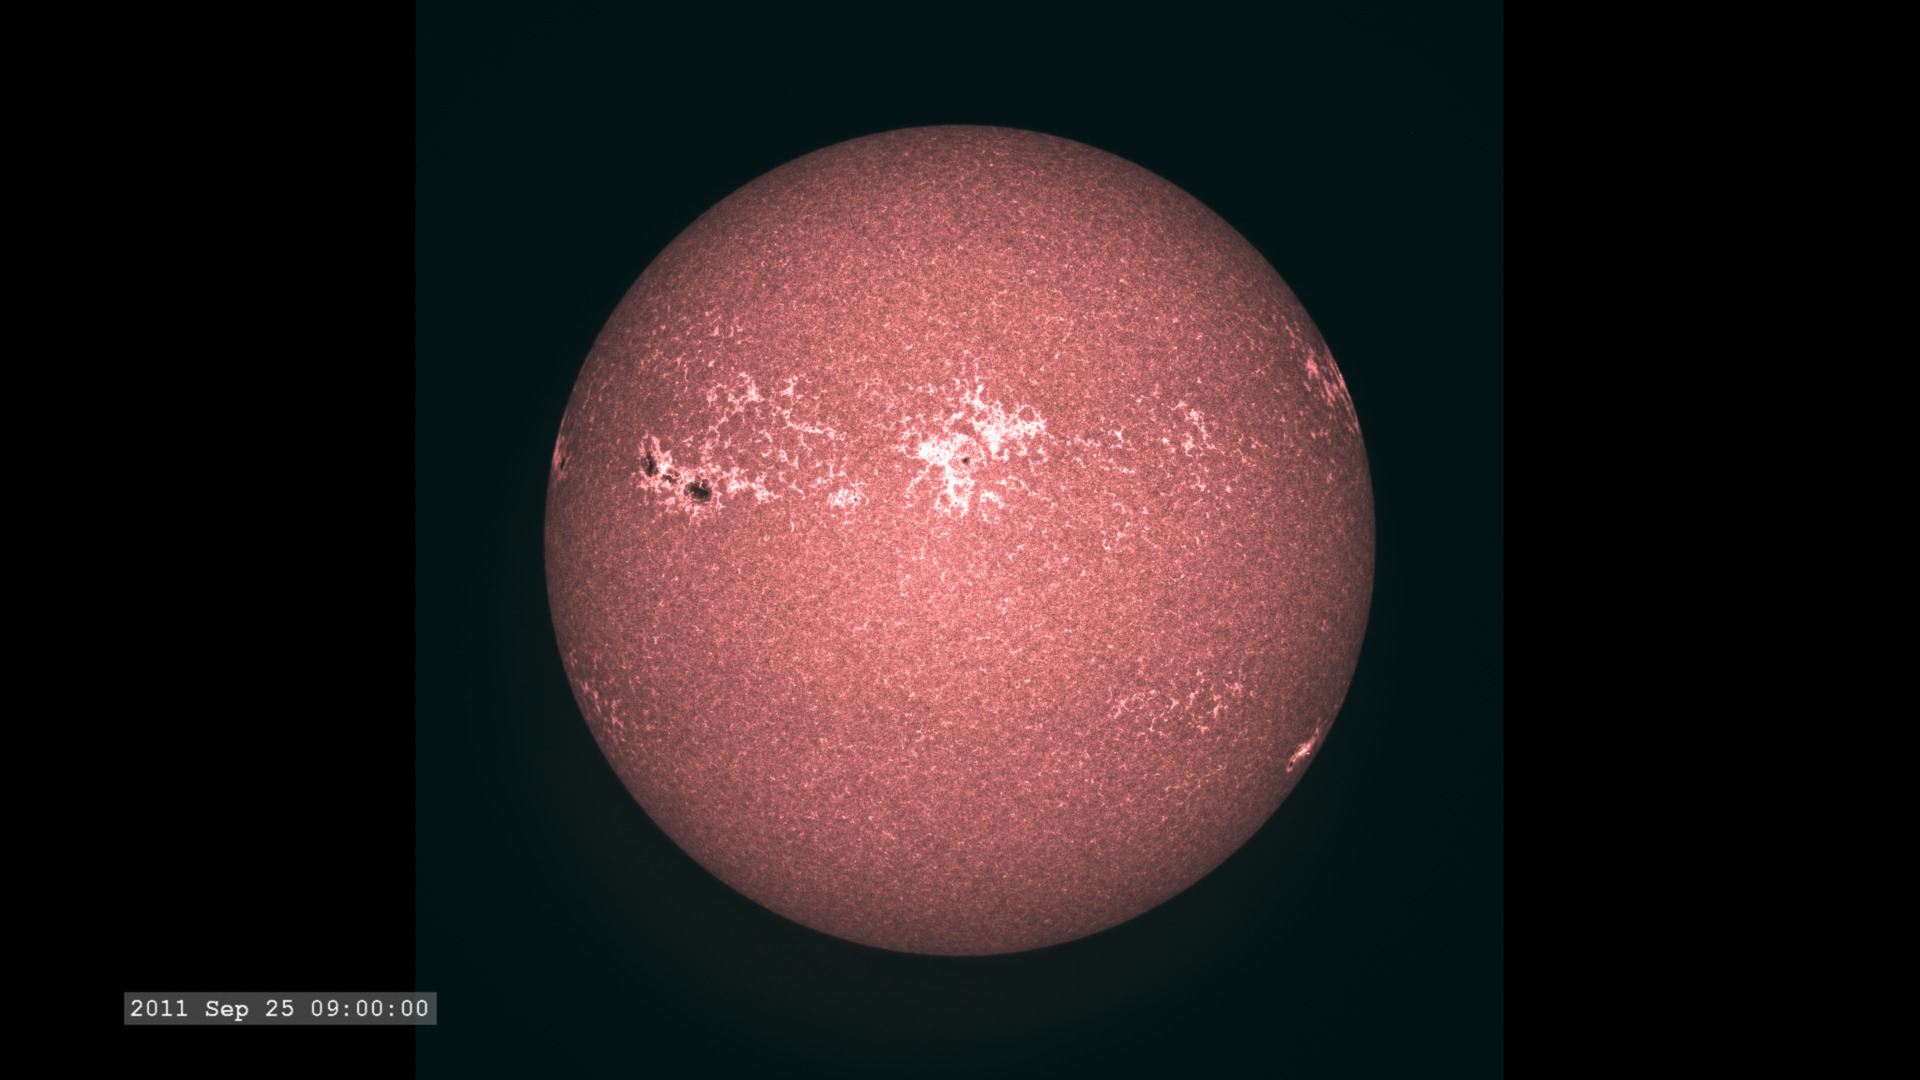
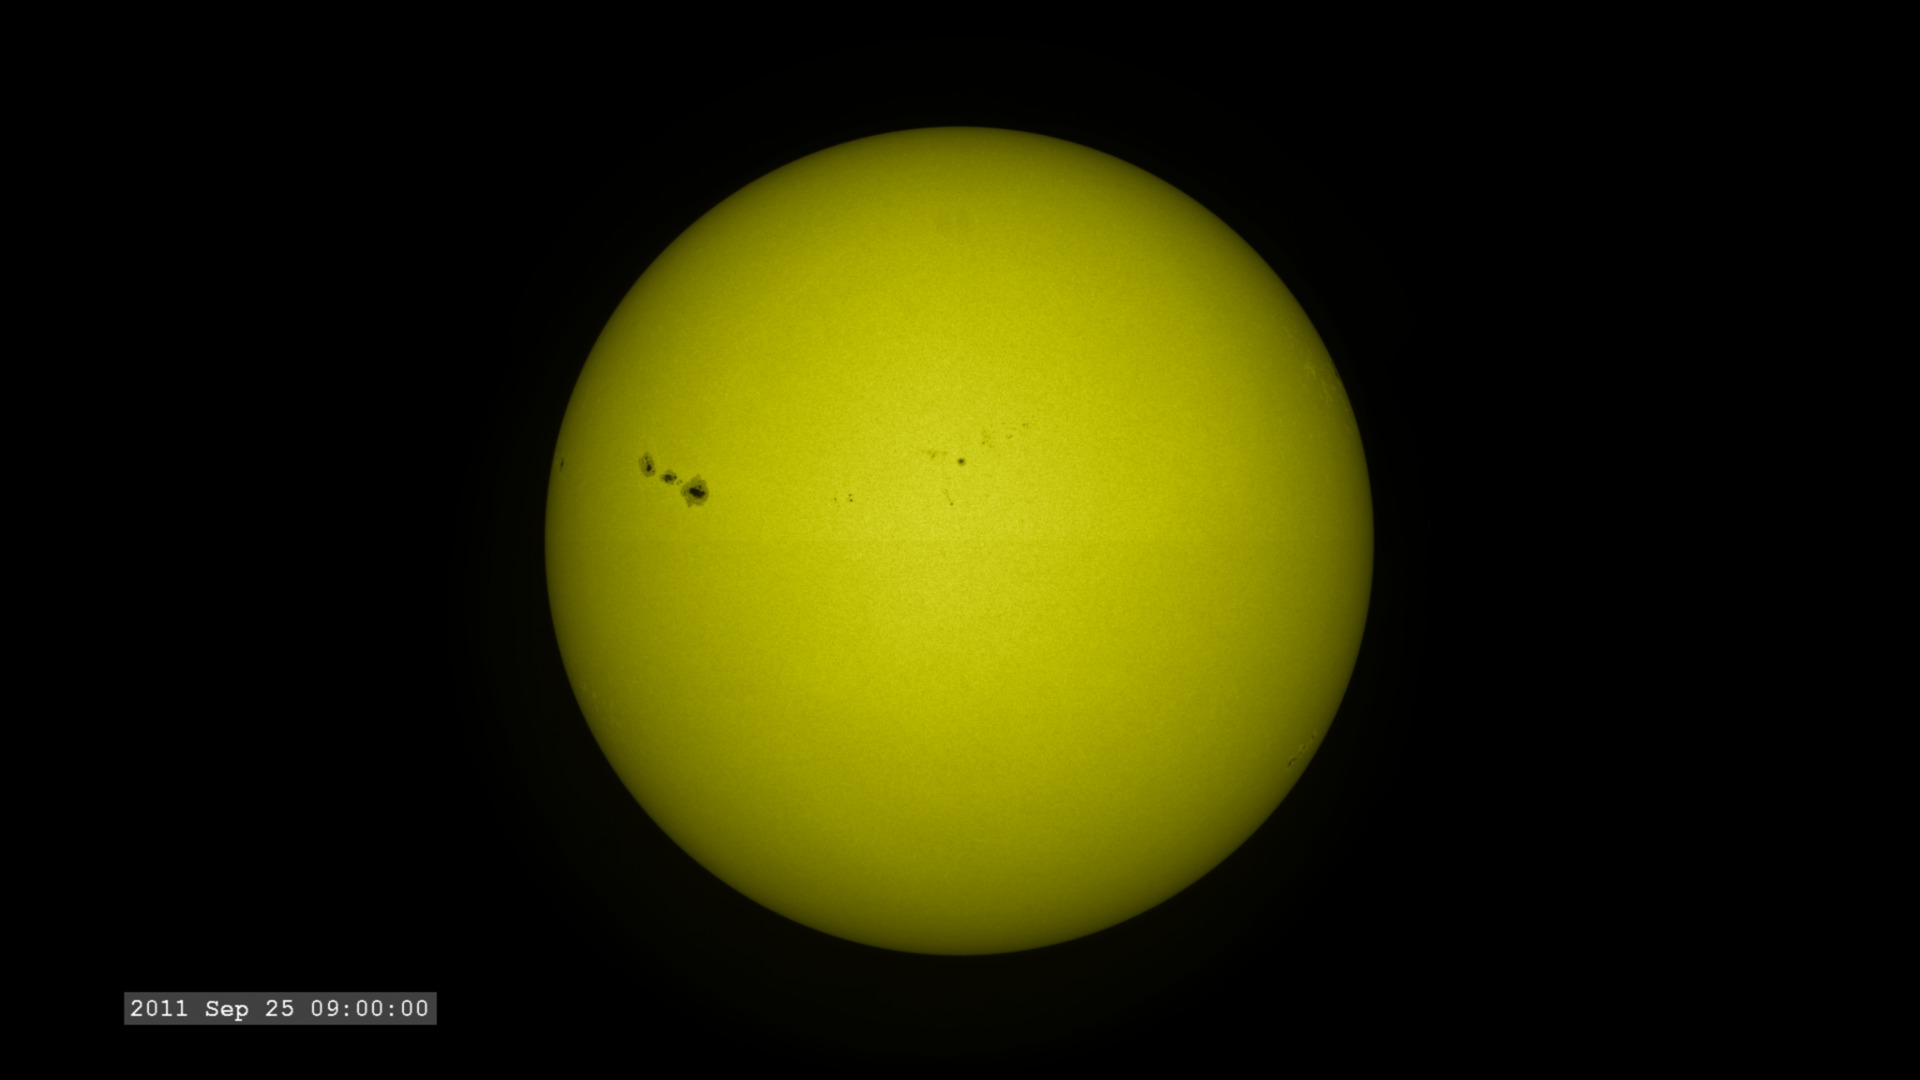
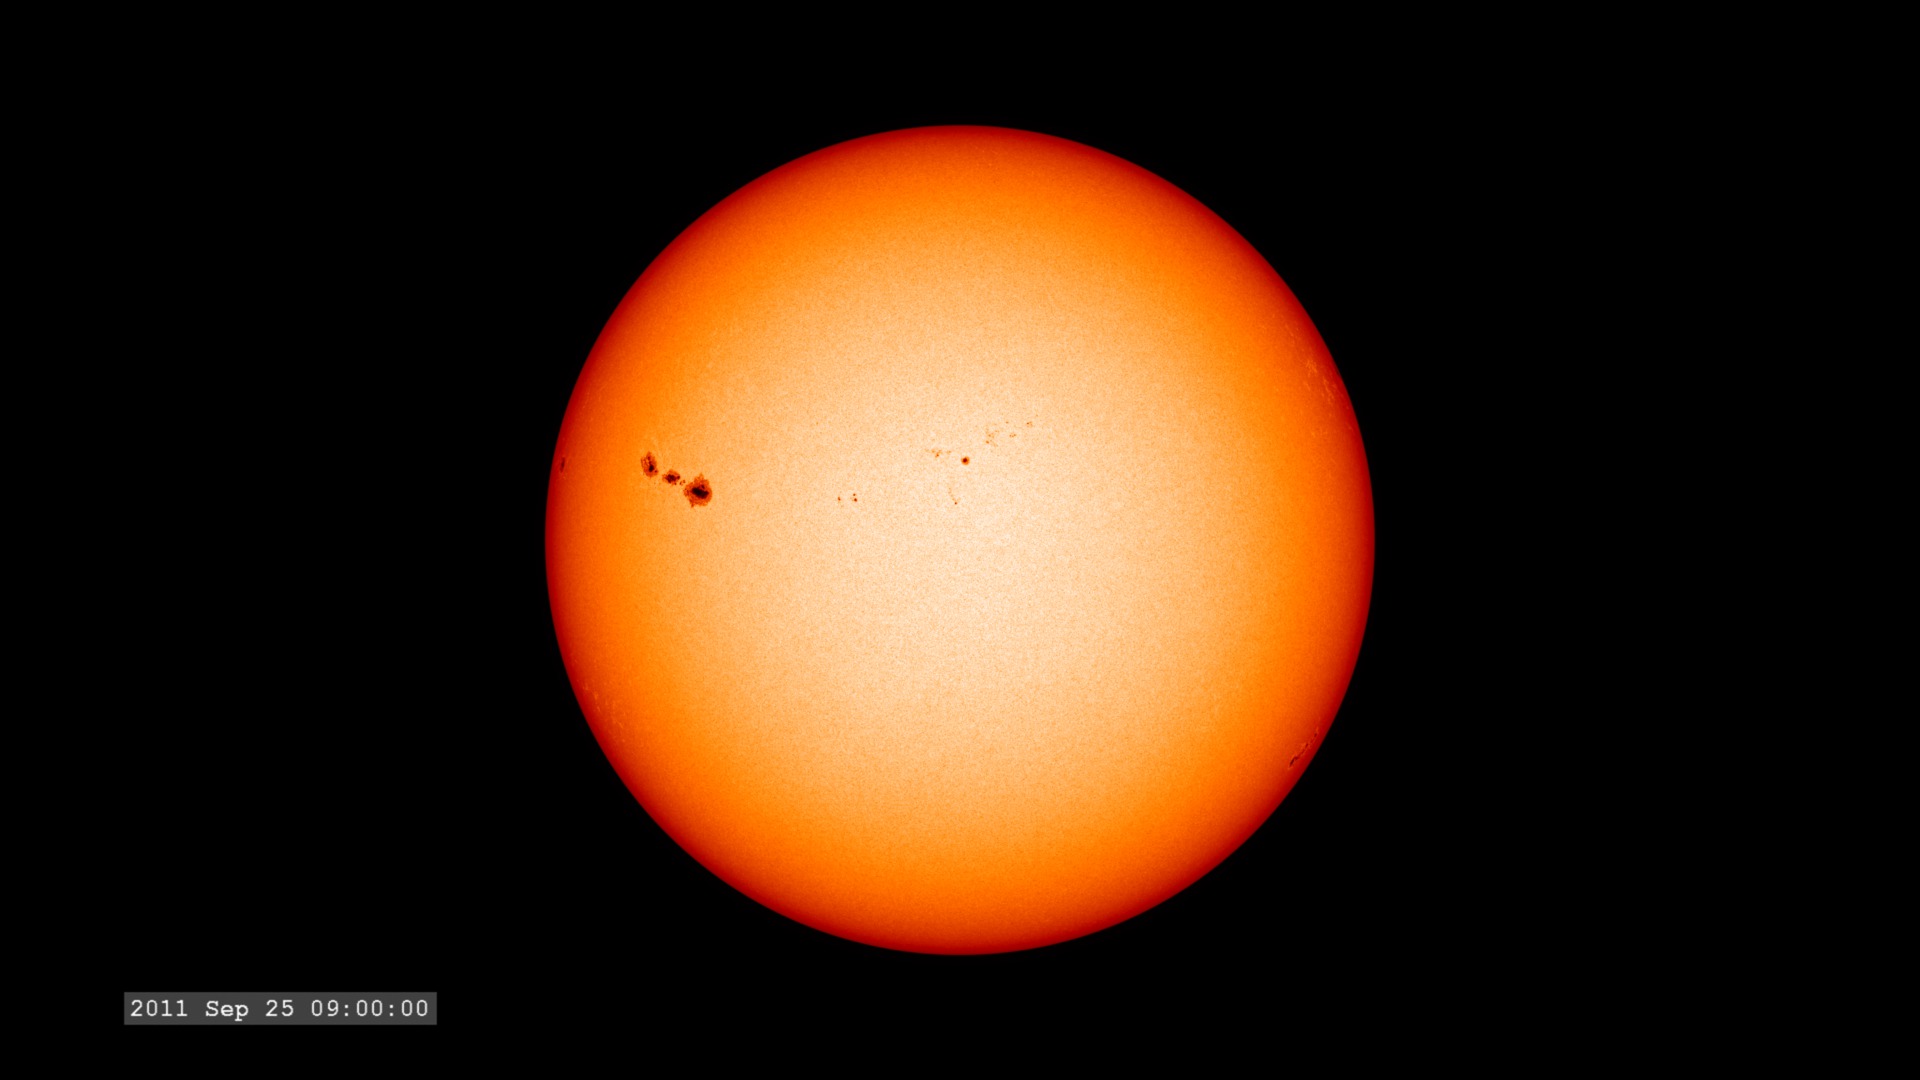
The Solar Dynamics Observatory (SDO) observes the Sun with many different instruments, in many different wavelengths of light. Many of these capabilities are not possible for ground-based observatories - hence the need for a space-based observing platform.
This visualization is one of a set of visualizations (others linked below) covering the same time span of 17 hours over the full wavelength range of the mission. They are setup to play synchronously on a Hyperwall, or can be run individually.
The images are sampled every 36 seconds, 1/3 of the standard time-cadence for SDO. This visualization is useful for illustrating how different solar phenomena, such as sunspots and active regions, look very different in different wavelengths of light. This differences enable scientists to study them more completely, with an eventual goal of improving Space Weather forecasting.
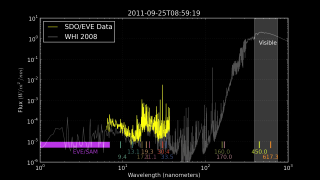
3x3 Layout view. This version is a subset of SDO filters. HMI imagery occupies the top row. EVE data is in the center. Selected AIA wavelengths other spots.
Credits
Please give credit for this item to:
NASA/Goddard Space Flight Center Scientific Visualization Studio, the SDO Science Team, and the Virtual Solar Observatory.
-
Animator
- Tom Bridgman (Global Science and Technology, Inc.)
-
Producers
- Scott Wiessinger (USRA)
- Genna Duberstein (USRA)
-
Scientist
- Phil Chamberlin (NASA/GSFC)
Release date
This page was originally published on Tuesday, November 20, 2012.
This page was last updated on Monday, July 15, 2024 at 12:02 AM EDT.
Missions
This visualization is related to the following missions:Series
This visualization can be found in the following series:Datasets used in this visualization
-
SDO Continuum (Continuum) [SDO: HMI]
ID: 674 -
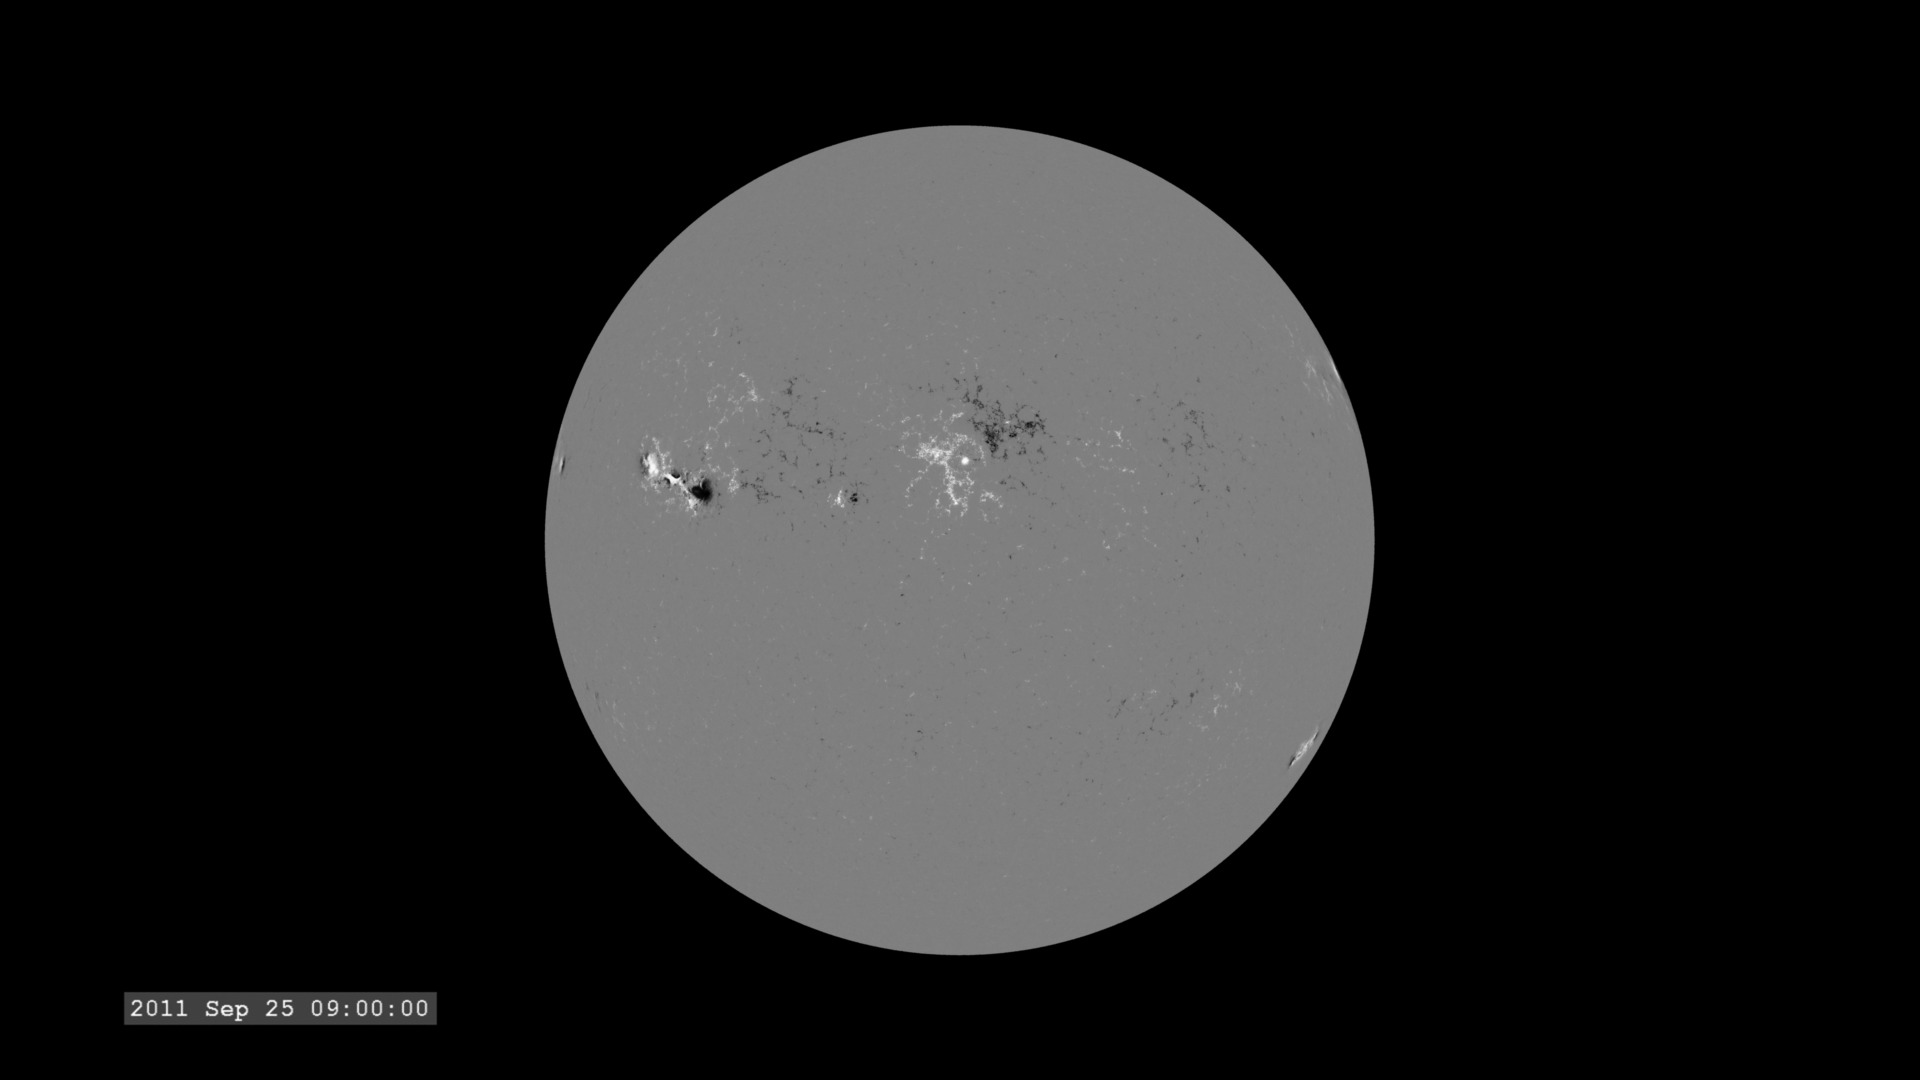
SDO Magnetogram (Magnetogram) [SDO: HMI]
ID: 675 -
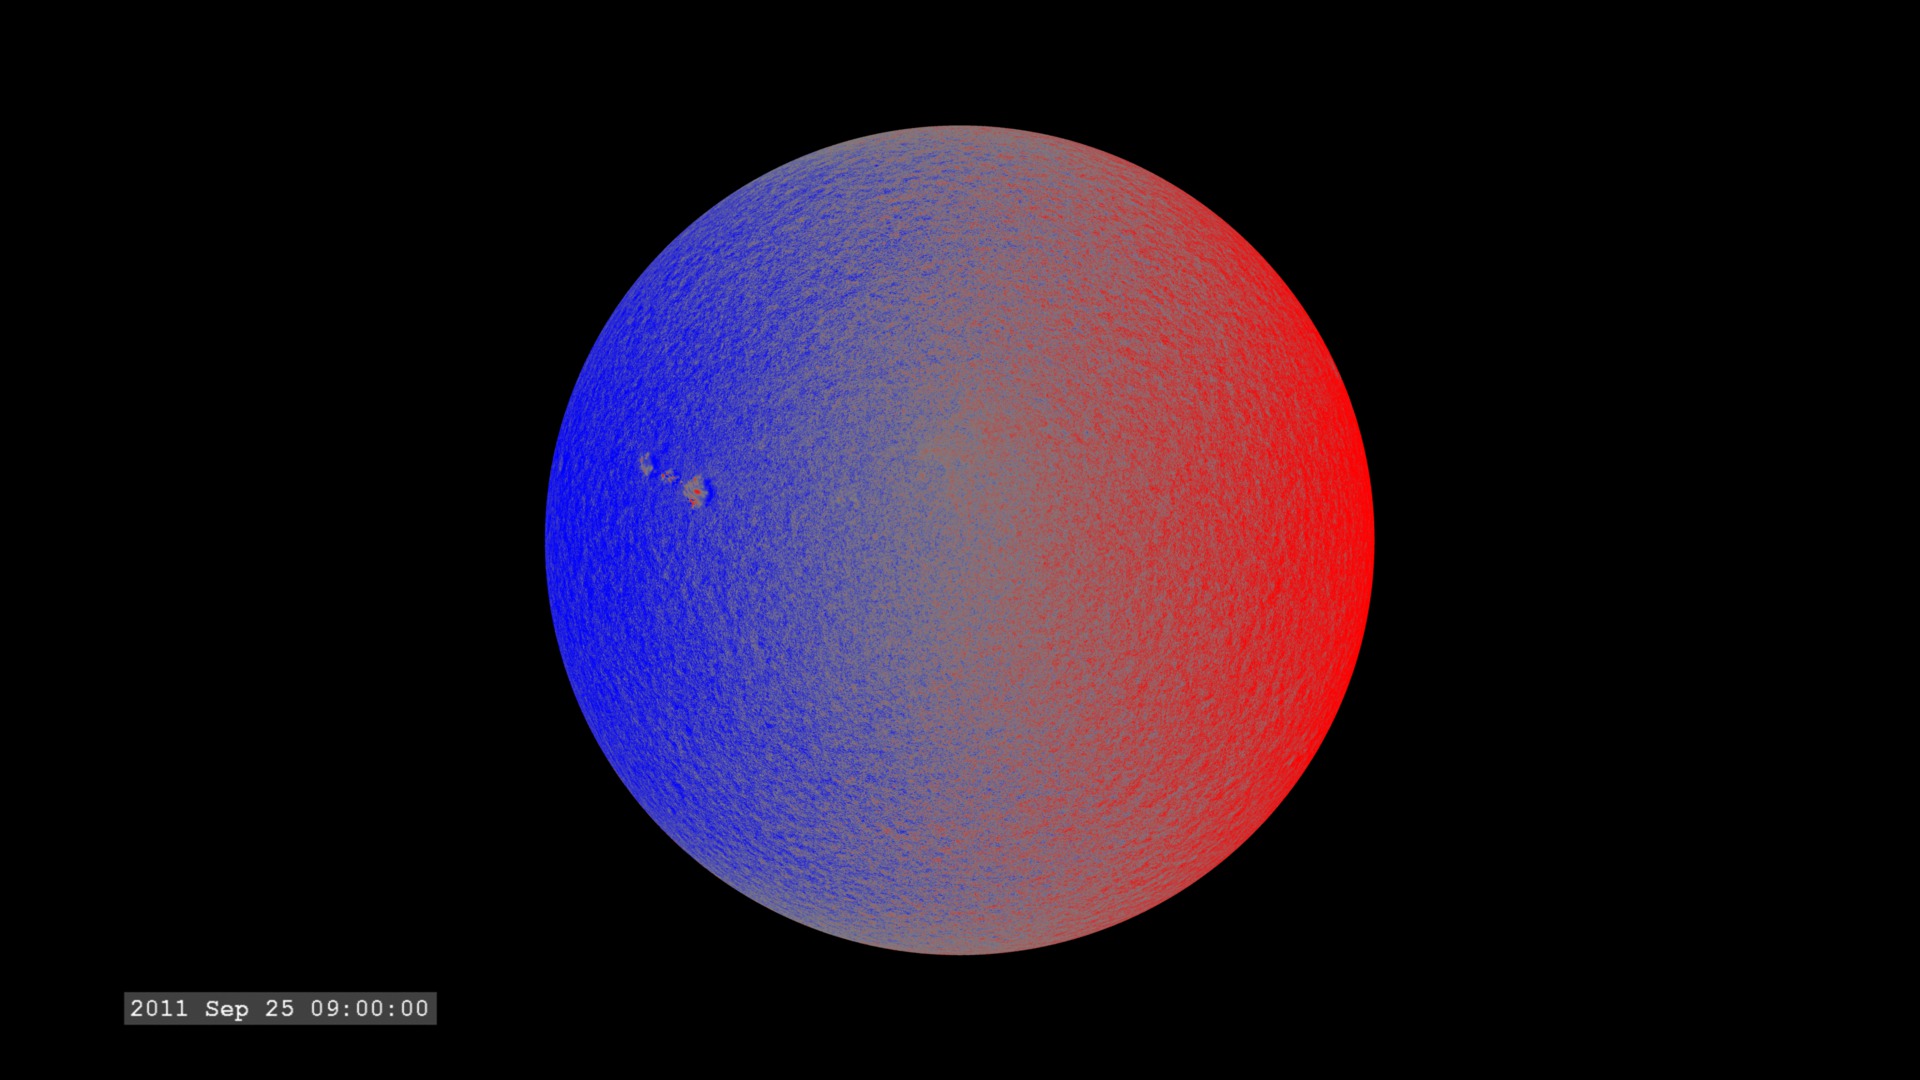
SDO Dopplergram (Dopplergram) [SDO: HMI]
ID: 676 -
AIA 304 (304 Filter) [SDO: AIA]
ID: 677This dataset can be found at: http://jsoc.stanford.edu/
See all pages that use this dataset -
AIA 211 (211 Filter) [SDO: AIA]
ID: 678This dataset can be found at: http://jsoc.stanford.edu/
See all pages that use this dataset -
AIA 193 (193 Filter) [SDO: AIA]
ID: 679This dataset can be found at: http://jsoc.stanford.edu/
See all pages that use this dataset -
AIA 171 (171 Filter) [SDO: AIA]
ID: 680This dataset can be found at: http://jsoc.stanford.edu/
See all pages that use this dataset -
AIA 1700 (1700 Filter) [SDO: AIA]
ID: 710This dataset can be found at: http://jsoc.stanford.edu/
See all pages that use this dataset -
AIA 131 (131 Filter) [SDO: AIA]
ID: 730This dataset can be found at: http://jsoc.stanford.edu/
See all pages that use this dataset -
AIA 335 (335 Filter) [SDO: AIA]
ID: 748This dataset can be found at: http://jsoc.stanford.edu/
See all pages that use this dataset -
AIA 94 (94 Filter) [SDO: AIA]
ID: 749This dataset can be found at: http://jsoc.stanford.edu/
See all pages that use this dataset -
AIA 1600 (1600 Filter) [SDO: AIA]
ID: 757This dataset can be found at: http://jsoc.stanford.edu/
See all pages that use this dataset -
AIA 4500 (4500 Filter) [SDO: AIA]
ID: 758This dataset can be found at: http://jsoc.stanford.edu/
See all pages that use this dataset -
[SDO: Extreme Ultraviolet Variability Experiment (EVE)]
ID: 763
Note: While we identify the data sets used in these visualizations, we do not store any further details, nor the data sets themselves on our site.
Related
- ID: 4128
 Visualization
 - ID: 4117
 Visualization
 - ID: 11385
 Produced Video
 - ID: 4009
- ID: 3978
 Visualization
 - ID: 3979
 Visualization
 - ID: 3980
 Visualization
 - ID: 3981
 Visualization
 - ID: 3982
 Visualization
 - ID: 3983
 Visualization
 - ID: 3984
 Visualization
 - ID: 3985
 Visualization
 - ID: 3986
 Visualization
 - ID: 3987
 Visualization
 - ID: 3988
 Visualization
 - ID: 3989
 Visualization
 - ID: 3990
 Visualization