Earth
ID: 3675
There is a high degree of interannual (year-to-year) and decadal variability in both global and hemispheric temperatures. Underlying this variability, however, is a long-term warming trend that has become strong and persistent over the past three decades. The long-term trends are more apparent when temperature is averaged over several years. This image represents the 10 year average temperatures anomaly data from 2000 through 2009.
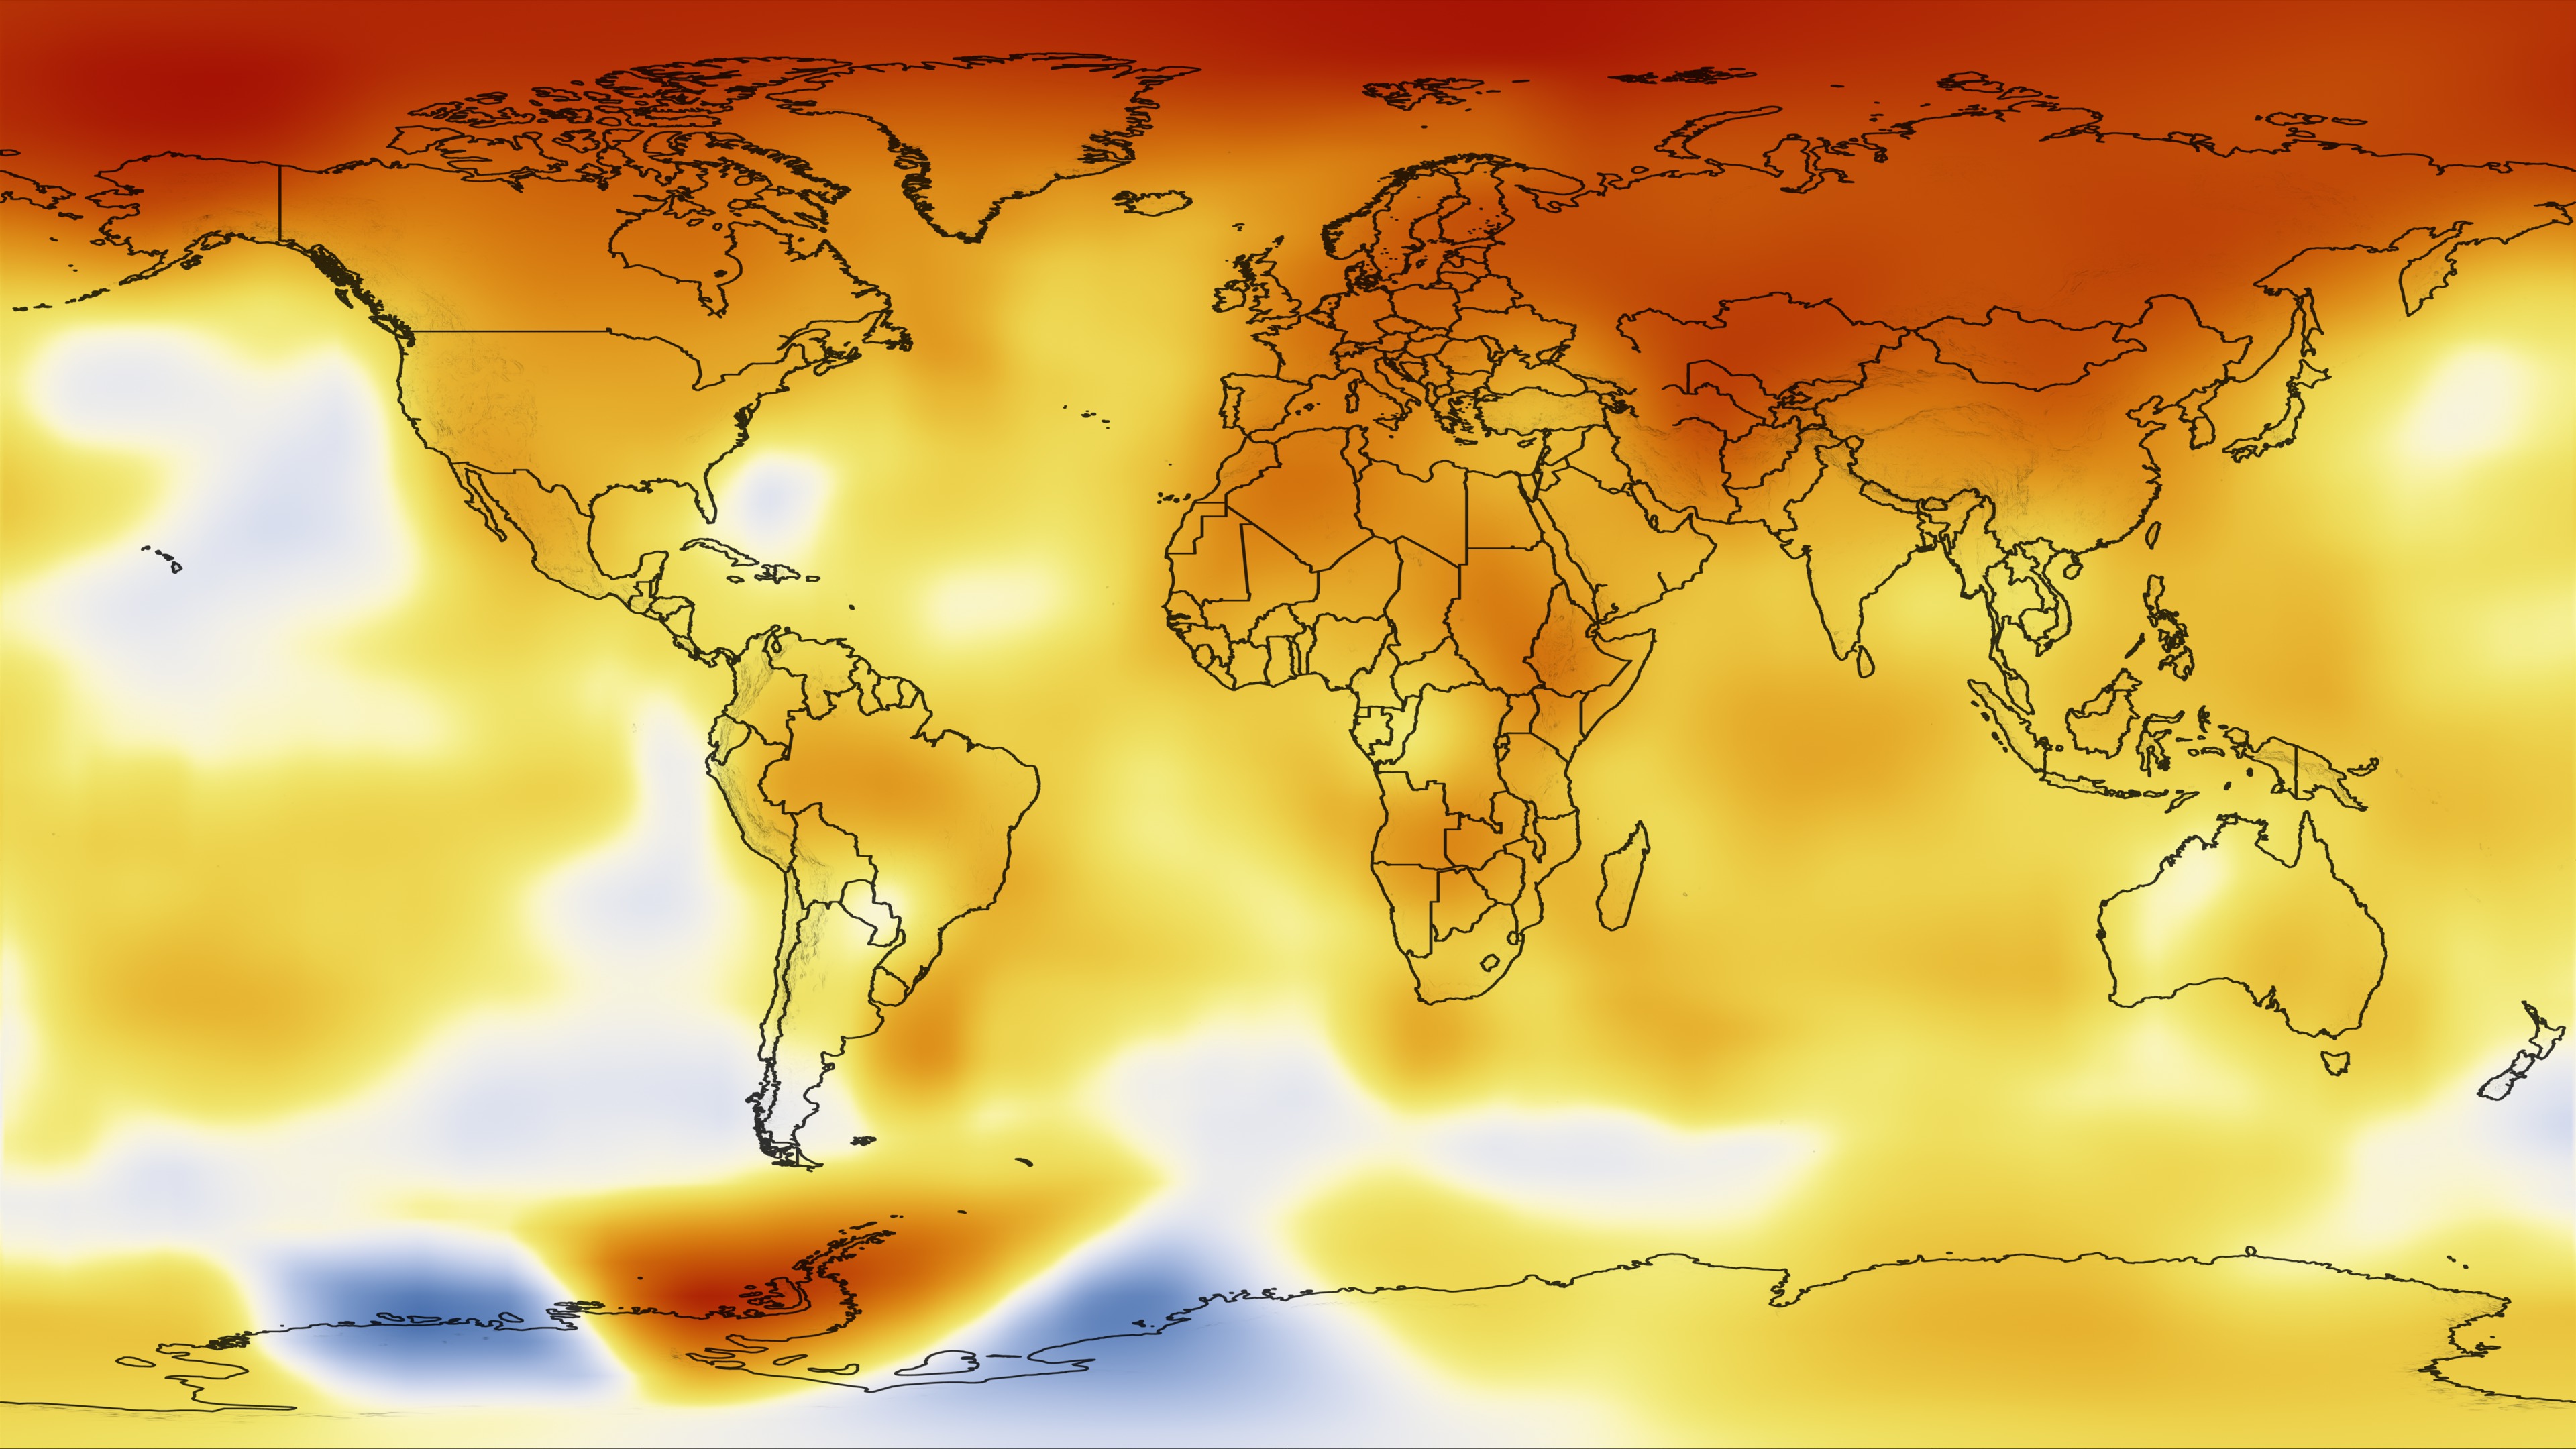
Ten-Year Average Global Temperature Anomaly Image from 2000 to 2009
Visualization Credits
Lori Perkins (NASA/GSFC): Lead Animator
Jennifer A. Shoemaker (UMBC): Producer
Amber H Jenkins Ph.D. (NASA/JPL CalTech): Producer
James Hansen Ph.D. (NASA/GSFC GISS): Scientist
Reto A. Ruedy Ph.D. (SIGMA Space Partners, LLC.): Scientist
Kwok-Wai Ken Lo Ph.D. (SIGMA Space Partners, LLC.): Scientist
Makiko Sato Ph.D. (Columbia University, Center for Climate Systems Research): Scientist
Robert B Schmunk Ph.D. (SIGMA Space Partners, LLC.): Scientist
Robert B Schmunk Ph.D. (SIGMA Space Partners, LLC.): Project Support
Adam P Voiland (Wyle Information Systems): Writer
Please give credit for this item to:
NASA/Goddard Space Flight Center Scientific Visualization Studio Data provided by Robert B. Schmunk (NASA/GSFC GISS)
NASA/Goddard Space Flight Center Scientific Visualization Studio Data provided by Robert B. Schmunk (NASA/GSFC GISS)
Science Paper:
http://www.realclimate.org/index.php/archives/2010/01/2009-temperatures-by-jim-hansen/
Short URL to share this page:
https://svs.gsfc.nasa.gov/3675
Data Used:
Note: While we identify the data sets used in these visualizations, we do not store any further details nor the data sets themselves on our site.
This item is part of this series:
Global Temperature Anomalies
Keywords:
SVS >> Climate
SVS >> Global Warming
SVS >> HDTV
DLESE >> Physical oceanography
SVS >> Surface Temperature
GCMD >> Earth Science >> Biosphere >> Ecological Dynamics >> Extinction
GCMD >> Earth Science >> Climate Indicators >> Teleconnections >> El Nino Southern Oscillation
GCMD >> Earth Science >> Oceans >> Coastal Processes >> Sea Level Rise
SVS >> Model Data
SVS >> iPod
SVS >> Science On a Sphere
SVS >> For Educators
NASA Science >> Earth
GCMD keywords can be found on the Internet with the following citation: Olsen, L.M., G. Major, K. Shein, J. Scialdone, S. Ritz, T. Stevens, M. Morahan, A. Aleman, R. Vogel, S. Leicester, H. Weir, M. Meaux, S. Grebas, C.Solomon, M. Holland, T. Northcutt, R. A. Restrepo, R. Bilodeau, 2013. NASA/Global Change Master Directory (GCMD) Earth Science Keywords. Version 8.0.0.0.0
http://www.realclimate.org/index.php/archives/2010/01/2009-temperatures-by-jim-hansen/
Short URL to share this page:
https://svs.gsfc.nasa.gov/3675
Data Used:
GISS Surface Temperature Analysis (GISTEMP)/GISTEMP
Model - NASA/GISSThis item is part of this series:
Global Temperature Anomalies
Keywords:
SVS >> Climate
SVS >> Global Warming
SVS >> HDTV
DLESE >> Physical oceanography
SVS >> Surface Temperature
GCMD >> Earth Science >> Biosphere >> Ecological Dynamics >> Extinction
GCMD >> Earth Science >> Climate Indicators >> Teleconnections >> El Nino Southern Oscillation
GCMD >> Earth Science >> Oceans >> Coastal Processes >> Sea Level Rise
SVS >> Model Data
SVS >> iPod
SVS >> Science On a Sphere
SVS >> For Educators
NASA Science >> Earth
GCMD keywords can be found on the Internet with the following citation: Olsen, L.M., G. Major, K. Shein, J. Scialdone, S. Ritz, T. Stevens, M. Morahan, A. Aleman, R. Vogel, S. Leicester, H. Weir, M. Meaux, S. Grebas, C.Solomon, M. Holland, T. Northcutt, R. A. Restrepo, R. Bilodeau, 2013. NASA/Global Change Master Directory (GCMD) Earth Science Keywords. Version 8.0.0.0.0


