Earth
ID: 3672
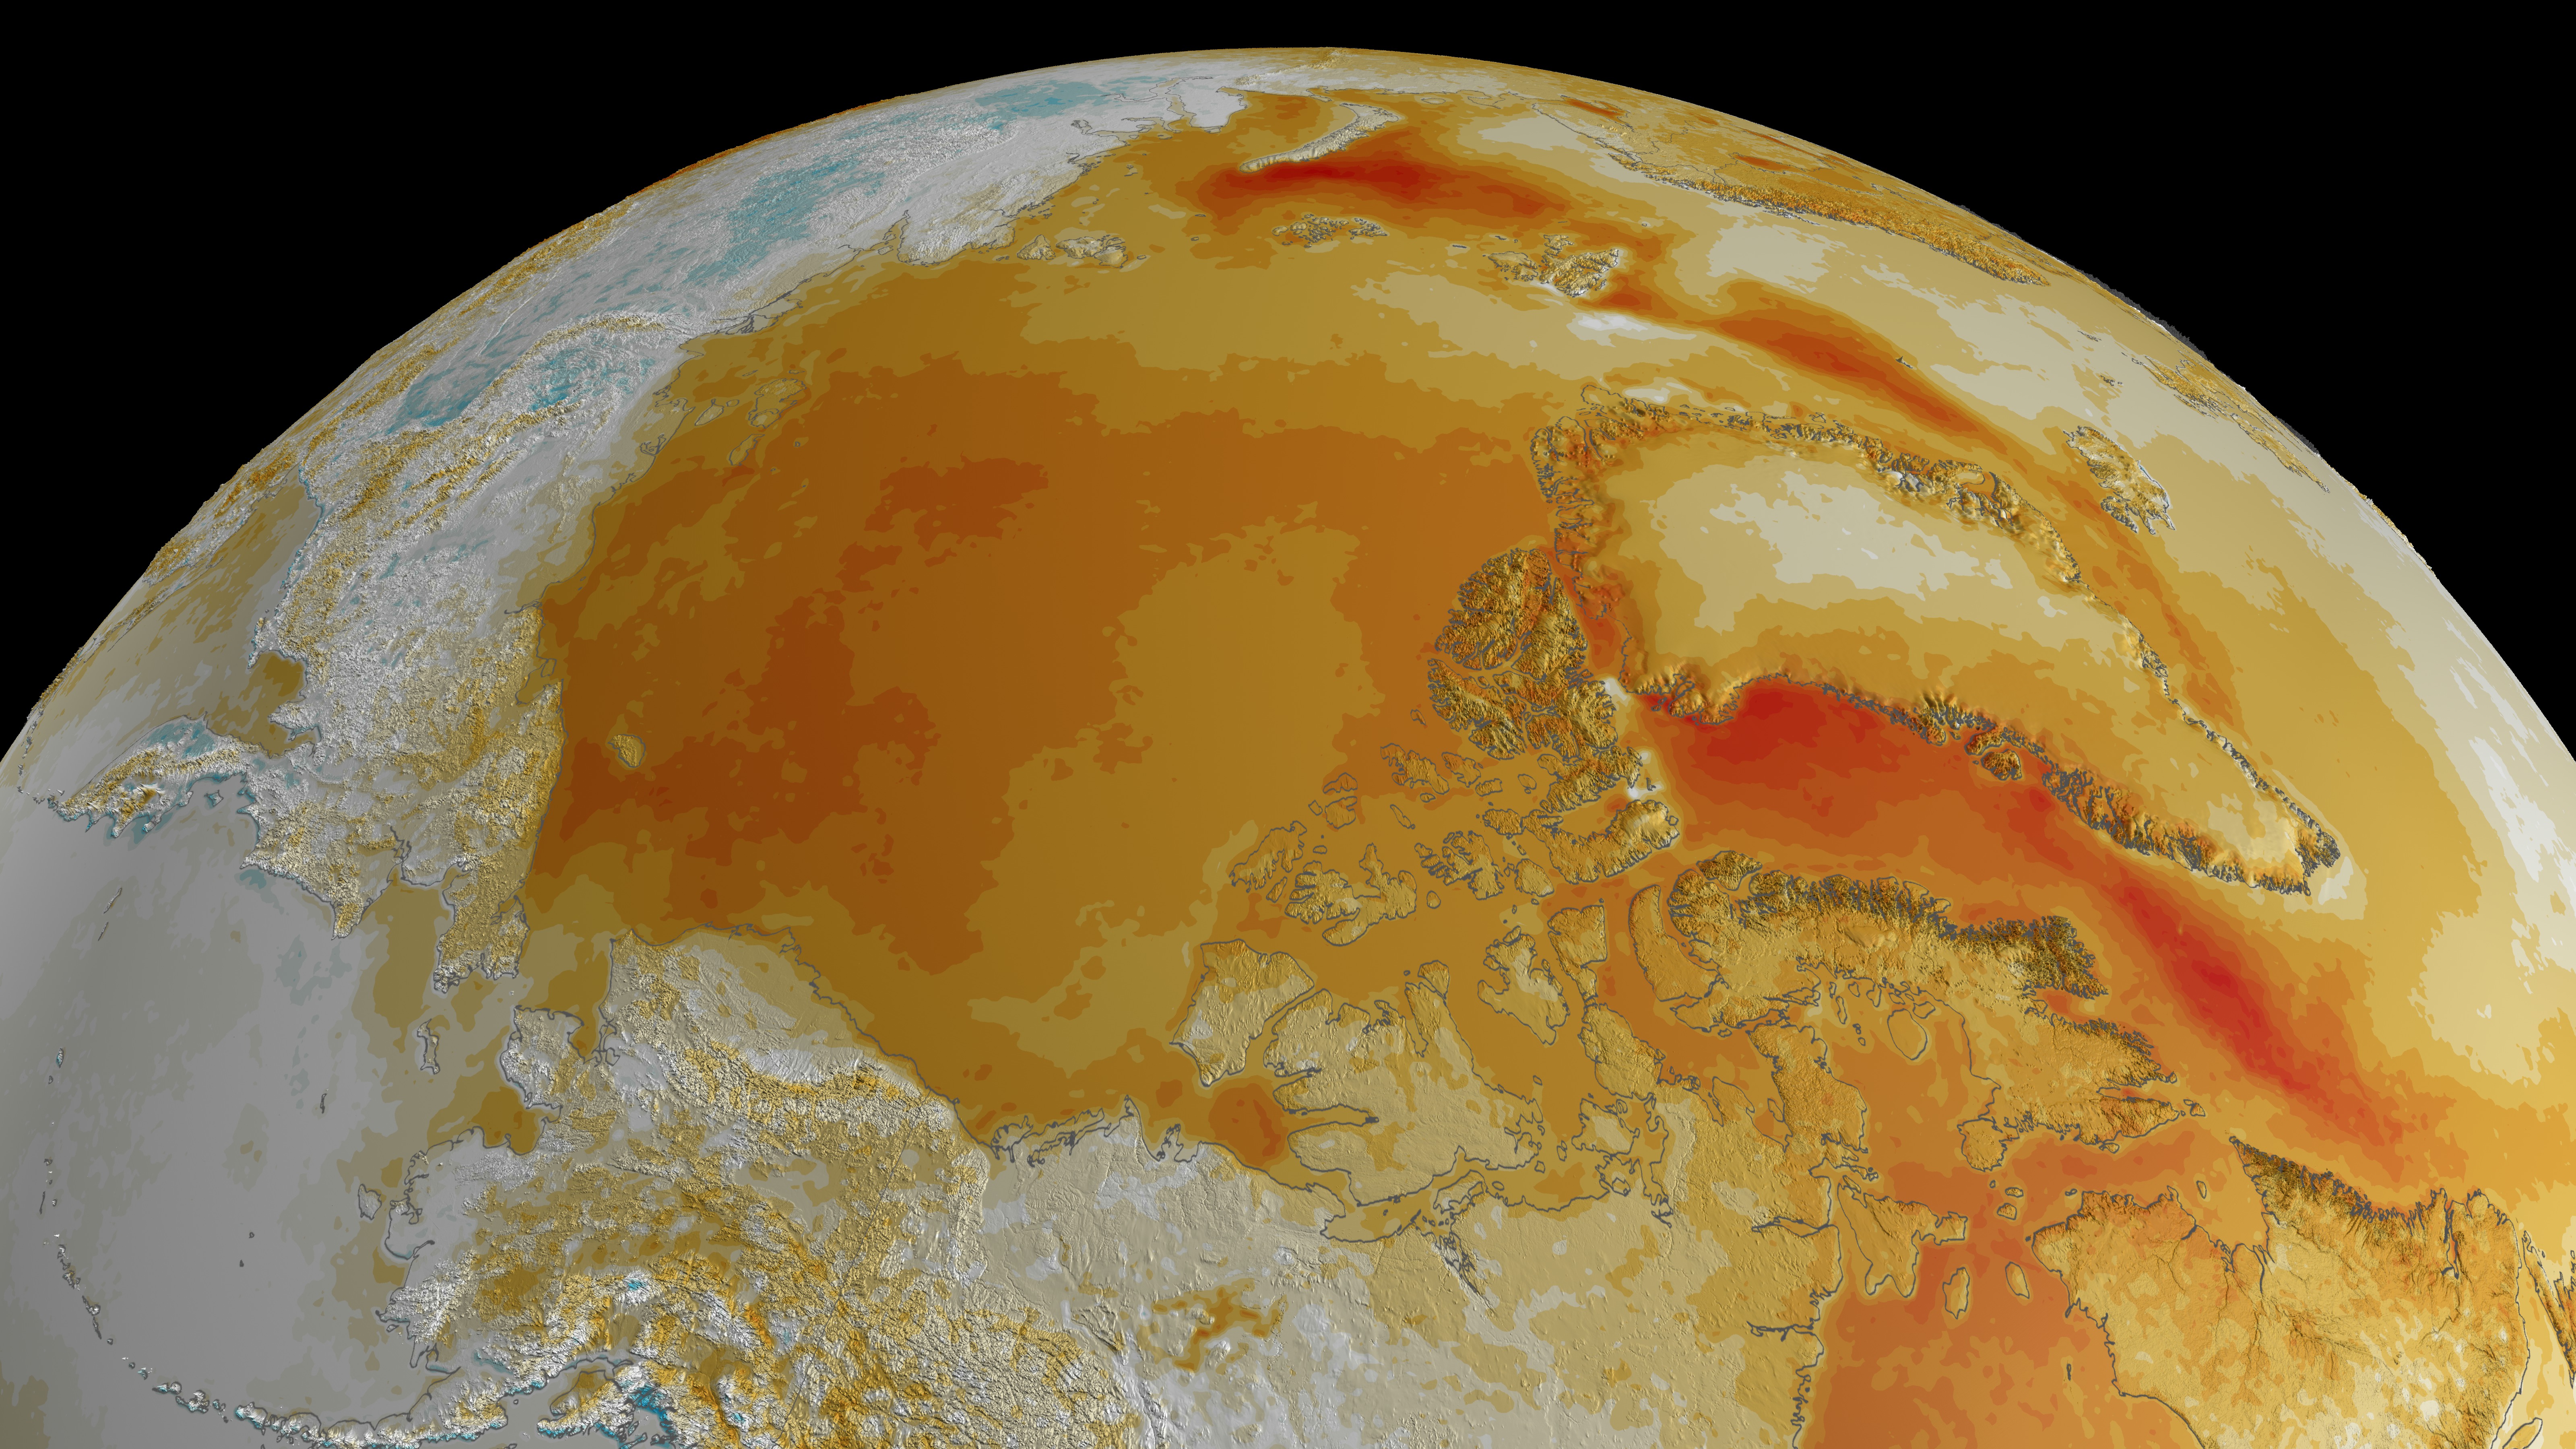
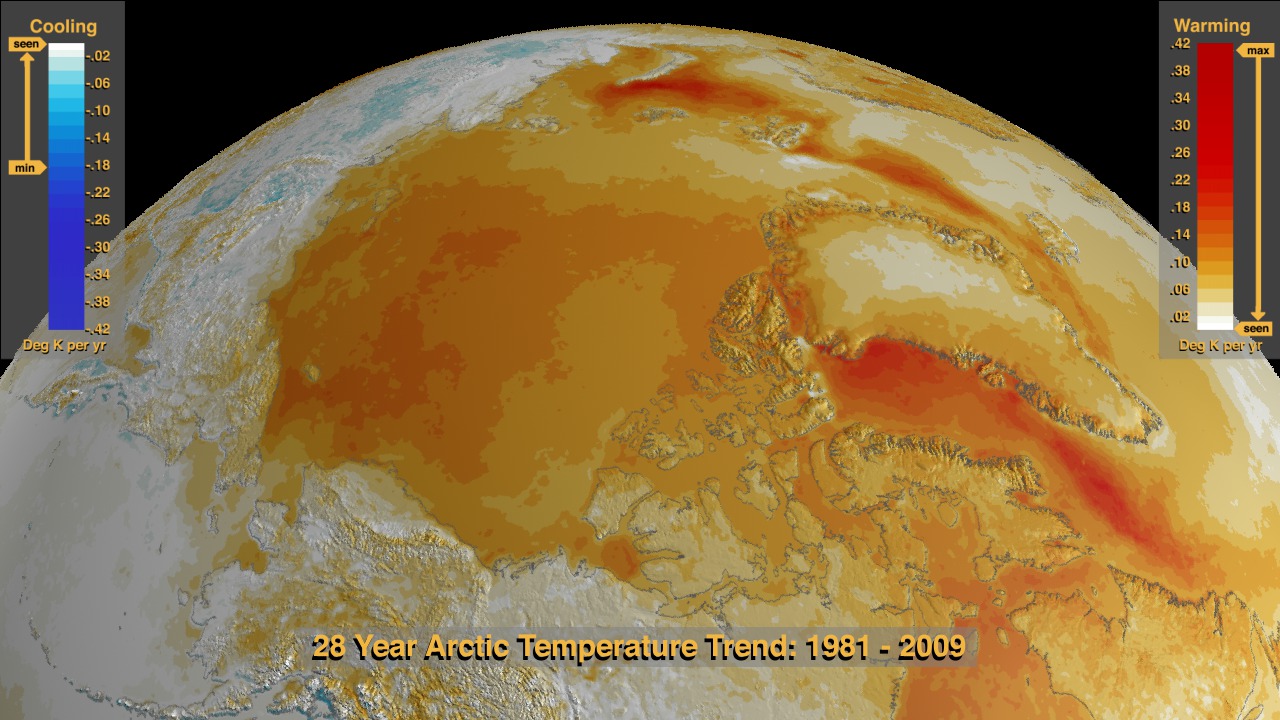
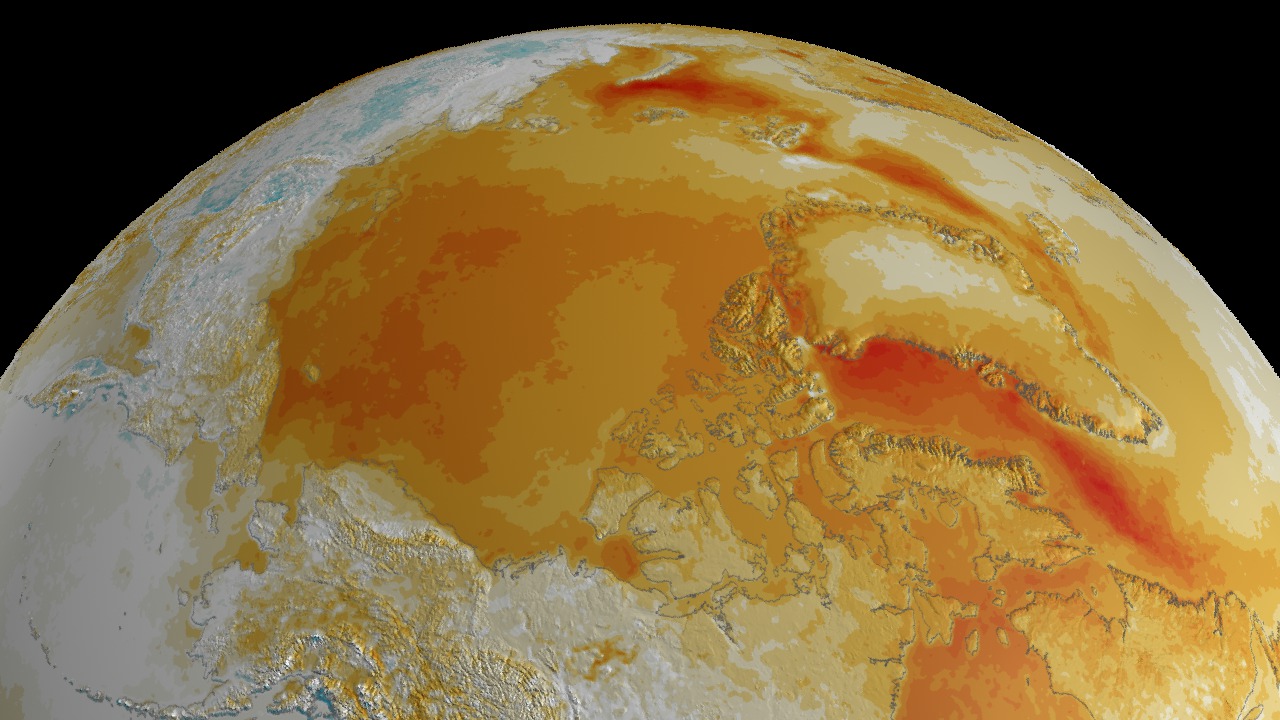
Scientists who study the Arctic region consider this area to be an early indicator of global warming, because changes in this area are amplified by the high albedo of the snow and ice. This animation depicts the 28-year surface temperature trend over the Arctic region determined from data collected between August 1981 and July 2009. The warming and cooling regions are shown in steps of .02 degrees Kelvin per year from the regions of greatest change to the areas of least change. Blue hues indicate cooling regions; red hues depict warming. The neutral region of -.02 to +.02 is shown in white. Light regions indicate less change while darker regions indicate more. The temperature scale used ranges from -0.42 to +0.42 degrees Kelvin, although the minimum data value is -0.1825 degrees Kelvin per year while the maximum value is 0.4185.
28 Year Arctic Temperature Trend
Visualization Credits
Cindy Starr (Global Science and Technology, Inc.): Lead Visualizer
Paul Reddish (Free Spirit Films): Producer
Josefino Comiso (NASA/GSFC): Scientist
Paul Reddish (Free Spirit Films): Producer
Josefino Comiso (NASA/GSFC): Scientist
Please give credit for this item to:
NASA/Goddard Space Flight Center Scientific Visualization Studio
NASA/Goddard Space Flight Center Scientific Visualization Studio
Short URL to share this page:
https://svs.gsfc.nasa.gov/3672
Data Used:
Note: While we identify the data sets used in these visualizations, we do not store any further details nor the data sets themselves on our site.
This item is part of this series:
28 Year Arctic Temperature Trend
Keywords:
SVS >> Global Warming
SVS >> HDTV
SVS >> Ice Sheets
SVS >> Sea Ice
SVS >> Surface Temperature
SVS >> Temperature
SVS >> Temperature Trend
GCMD >> Location >> Arctic
SVS >> For Educators
SVS >> Atmosphere >> Winds >> Circulation
SVS >> Cryosphere >> Snow/ice
SVS >> Glaciers
SVS >> Hydrosphere >> Ice
NASA Science >> Earth
GCMD keywords can be found on the Internet with the following citation: Olsen, L.M., G. Major, K. Shein, J. Scialdone, S. Ritz, T. Stevens, M. Morahan, A. Aleman, R. Vogel, S. Leicester, H. Weir, M. Meaux, S. Grebas, C.Solomon, M. Holland, T. Northcutt, R. A. Restrepo, R. Bilodeau, 2013. NASA/Global Change Master Directory (GCMD) Earth Science Keywords. Version 8.0.0.0.0
https://svs.gsfc.nasa.gov/3672
Data Used:
NOAA-7, 9, 11, 14, 16, 17, 18/AVHRR/Arctic Temperature Trends
Data Compilation - Josefino Comiso - 1981/08 - 2009/07This item is part of this series:
28 Year Arctic Temperature Trend
Keywords:
SVS >> Global Warming
SVS >> HDTV
SVS >> Ice Sheets
SVS >> Sea Ice
SVS >> Surface Temperature
SVS >> Temperature
SVS >> Temperature Trend
GCMD >> Location >> Arctic
SVS >> For Educators
SVS >> Atmosphere >> Winds >> Circulation
SVS >> Cryosphere >> Snow/ice
SVS >> Glaciers
SVS >> Hydrosphere >> Ice
NASA Science >> Earth
GCMD keywords can be found on the Internet with the following citation: Olsen, L.M., G. Major, K. Shein, J. Scialdone, S. Ritz, T. Stevens, M. Morahan, A. Aleman, R. Vogel, S. Leicester, H. Weir, M. Meaux, S. Grebas, C.Solomon, M. Holland, T. Northcutt, R. A. Restrepo, R. Bilodeau, 2013. NASA/Global Change Master Directory (GCMD) Earth Science Keywords. Version 8.0.0.0.0


