Earth
ID: 3136
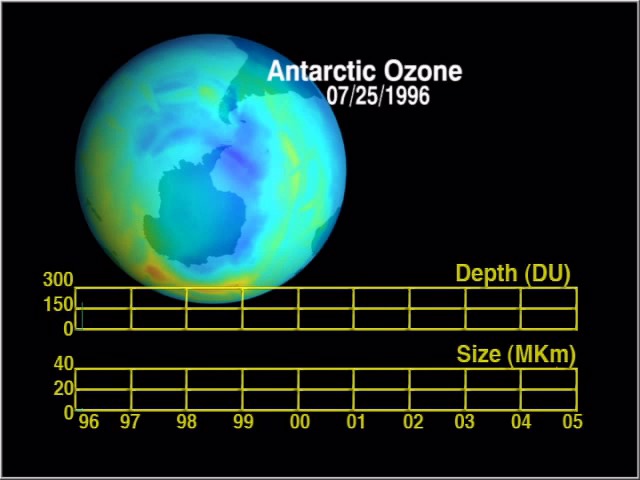
This animation shows total ozone in the Antarctic region along with the maximum ozone depth and size since the earliest measurements of the TOMS instrument on the Earth Probe satellite. This animation was created for an exhibit at the Smithsonium Museum.

Antarctic Ozone Sequence 1996 through 2004
Visualization Credits
Lori Perkins (NASA/GSFC): Lead Animator
Paul Newman (NASA/GSFC): Scientist
Ernest Hilsenrath (NASA/GSFC): Scientist
Paul Newman (NASA/GSFC): Scientist
Ernest Hilsenrath (NASA/GSFC): Scientist
Please give credit for this item to:
NASA/Goddard Space Flight Center Scientific Visualization Studio
NASA/Goddard Space Flight Center Scientific Visualization Studio
Short URL to share this page:
https://svs.gsfc.nasa.gov/3136
Data Used:
Note: While we identify the data sets used in these visualizations, we do not store any further details nor the data sets themselves on our site.
Dates of Data Used:
1996/7/26 - 2004/12/31
This item is part of this series:
Ozone
Keywords:
SVS >> Antarctic
DLESE >> Atmospheric science
SVS >> Ozone Hole
GCMD >> Earth Science >> Atmosphere >> Atmospheric Chemistry/Oxygen Compounds >> Ozone
NASA Science >> Earth
GCMD keywords can be found on the Internet with the following citation: Olsen, L.M., G. Major, K. Shein, J. Scialdone, S. Ritz, T. Stevens, M. Morahan, A. Aleman, R. Vogel, S. Leicester, H. Weir, M. Meaux, S. Grebas, C.Solomon, M. Holland, T. Northcutt, R. A. Restrepo, R. Bilodeau, 2013. NASA/Global Change Master Directory (GCMD) Earth Science Keywords. Version 8.0.0.0.0
https://svs.gsfc.nasa.gov/3136
Data Used:
Earth Probe/TOMS/Ozone
1996/7/26 - 2004/12/31Dates of Data Used:
1996/7/26 - 2004/12/31
This item is part of this series:
Ozone
Keywords:
SVS >> Antarctic
DLESE >> Atmospheric science
SVS >> Ozone Hole
GCMD >> Earth Science >> Atmosphere >> Atmospheric Chemistry/Oxygen Compounds >> Ozone
NASA Science >> Earth
GCMD keywords can be found on the Internet with the following citation: Olsen, L.M., G. Major, K. Shein, J. Scialdone, S. Ritz, T. Stevens, M. Morahan, A. Aleman, R. Vogel, S. Leicester, H. Weir, M. Meaux, S. Grebas, C.Solomon, M. Holland, T. Northcutt, R. A. Restrepo, R. Bilodeau, 2013. NASA/Global Change Master Directory (GCMD) Earth Science Keywords. Version 8.0.0.0.0


