Earth
ID: 3110
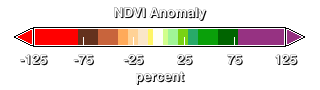
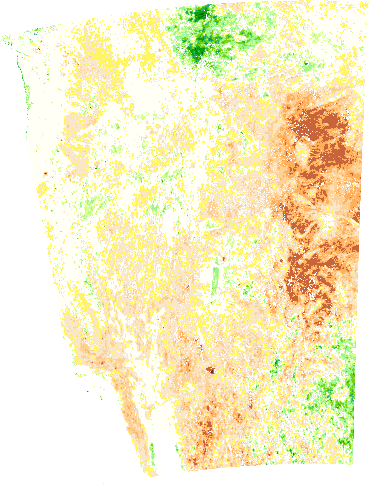
Satellite data can gauge the health of plants, which is a good indicator of drought. The Normalized Difference Vegetation Index (NDVI) measures how dense and green plant leaves are. NDVI images are useful as a measure of drought when compared to 'normal' plant health. Scientists calculate average NDVI values for an area to find out what is normal at a particular time of year. This animation uses satellite imagery to show changes in vegetation between 1999 and 2003. In 2002, drought had settled across the Midwest. Large dark brown sections of eastern Colorado show where vegetation was less lush and healthy than normal. This version of the visualization is a wide view showing the western United States. The data were measured by the vegetation instrument on Europe's SPOT-4 satellite, and were provided by DigitalGlobe/SPOT under agreement with the U.S. Department of Agriculture Foreign Agricultural Service (USDA/FAS).
Vegetation Images Show Drought in Western US (WMS)
Visualization Credits
Jeff de La Beaujardiere (NASA): Lead Animator
Greg Shirah (NASA/GSFC): Animator
Horace Mitchell (NASA/GSFC): Animator
Assaf Anyamba (UMBC): Scientist
Greg Shirah (NASA/GSFC): Animator
Horace Mitchell (NASA/GSFC): Animator
Assaf Anyamba (UMBC): Scientist
Please give credit for this item to:
NASA/Goddard Space Flight Center Scientific Visualization Studio
NASA/Goddard Space Flight Center Scientific Visualization Studio
Short URL to share this page:
https://svs.gsfc.nasa.gov/3110
Data Used:
Note: While we identify the data sets used in these visualizations, we do not store any further details nor the data sets themselves on our site.
Dates of Data Used:
1999--2003
This item is part of these series:
NDVI
WMS
Keywords:
DLESE >> Climatology
GCMD >> Earth Science >> Atmosphere >> Atmospheric Phenomena >> Drought
GCMD >> Earth Science >> Biosphere >> Vegetation >> Vegetation Index
NASA Science >> Earth
GCMD keywords can be found on the Internet with the following citation: Olsen, L.M., G. Major, K. Shein, J. Scialdone, S. Ritz, T. Stevens, M. Morahan, A. Aleman, R. Vogel, S. Leicester, H. Weir, M. Meaux, S. Grebas, C.Solomon, M. Holland, T. Northcutt, R. A. Restrepo, R. Bilodeau, 2013. NASA/Global Change Master Directory (GCMD) Earth Science Keywords. Version 8.0.0.0.0
https://svs.gsfc.nasa.gov/3110
Data Used:
SPOT-4/VGT-S10/NDVI
1999--2003Dates of Data Used:
1999--2003
This item is part of these series:
NDVI
WMS
Keywords:
DLESE >> Climatology
GCMD >> Earth Science >> Atmosphere >> Atmospheric Phenomena >> Drought
GCMD >> Earth Science >> Biosphere >> Vegetation >> Vegetation Index
NASA Science >> Earth
GCMD keywords can be found on the Internet with the following citation: Olsen, L.M., G. Major, K. Shein, J. Scialdone, S. Ritz, T. Stevens, M. Morahan, A. Aleman, R. Vogel, S. Leicester, H. Weir, M. Meaux, S. Grebas, C.Solomon, M. Holland, T. Northcutt, R. A. Restrepo, R. Bilodeau, 2013. NASA/Global Change Master Directory (GCMD) Earth Science Keywords. Version 8.0.0.0.0


