Earth
ID: 30748
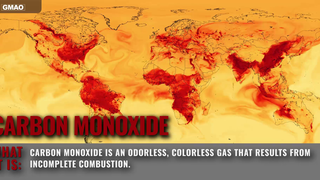
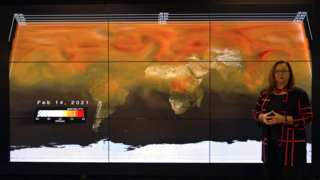
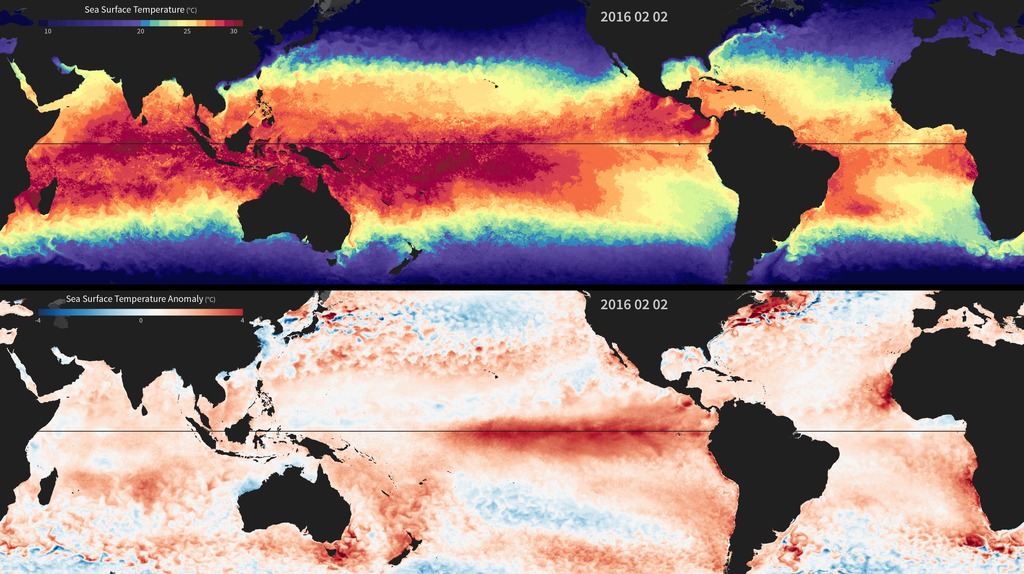
El Niño is characterized by unusually warm ocean temperatures in the eastern equatorial Pacific. Sea surface temperature is the temperature of the top millimeter of the ocean's surface. A sea surface temperature anomaly (SSTA) represents how different the ocean temperature, at a particular location and time, is from the normal (or average) temperature for that place and time.
Sea Surface Temperature and Temperature Anomaly 2015-2016
These maps, showing sea surface temperature and sea surface temperature anomalies, reveal the progression of the strong 2015-16 El Nino event from January 1, 2015 to January 2, 2016. The sea surface temperature data are seven-day averages calculated using daily thermal data from the Moderate Resolution Imaging Spectroradiometer (MODIS) instrument. Missing data have been filled with monthly-average data. The sea surface temperature anomaly data are seven-day averages calculated using the 5-kilometer Coral Reef Watch product produced by the National Oceanic and Atmospheric Administration. The data are based on observations from geostationary and polar-orbiting satellites.
Used Elsewhere In

Related

For More Information
Credits
Marit Jentoft-Nilsen: Visualizer
Please give credit for this item to:
NASA
Generated using SST data from MODIS and SSTA data from NOAA's Coral Reef Watch
Reef Watch Generated using AVISO Products
NASA
Generated using SST data from MODIS and SSTA data from NOAA's Coral Reef Watch
Reef Watch Generated using AVISO Products
Short URL to share this page:
https://svs.gsfc.nasa.gov/30748
Mission:
Aqua
Data Used:
Note: While we identify the data sets used in these visualizations, we do not store any further details nor the data sets themselves on our site.
Keywords:
SVS >> HDTV
SVS >> Sea Surface Temperature Anomaly
GCMD >> Earth Science >> Climate Indicators >> Teleconnections >> El Nino Southern Oscillation
GCMD >> Earth Science >> Oceans >> Ocean Temperature >> Sea Surface Temperature
SVS >> Hyperwall
NASA Science >> Earth
GCMD keywords can be found on the Internet with the following citation: Olsen, L.M., G. Major, K. Shein, J. Scialdone, S. Ritz, T. Stevens, M. Morahan, A. Aleman, R. Vogel, S. Leicester, H. Weir, M. Meaux, S. Grebas, C.Solomon, M. Holland, T. Northcutt, R. A. Restrepo, R. Bilodeau, 2013. NASA/Global Change Master Directory (GCMD) Earth Science Keywords. Version 8.0.0.0.0
https://svs.gsfc.nasa.gov/30748
Mission:
Aqua
Data Used:
Daily 5-km Satellite Coral Bleaching Thermal Stress Monitoring SST Anomaly also referred to as: NOAA Coral Reef Watch
Observed DataAqua/MODIS/Sea Surface Temperature
Keywords:
SVS >> HDTV
SVS >> Sea Surface Temperature Anomaly
GCMD >> Earth Science >> Climate Indicators >> Teleconnections >> El Nino Southern Oscillation
GCMD >> Earth Science >> Oceans >> Ocean Temperature >> Sea Surface Temperature
SVS >> Hyperwall
NASA Science >> Earth
GCMD keywords can be found on the Internet with the following citation: Olsen, L.M., G. Major, K. Shein, J. Scialdone, S. Ritz, T. Stevens, M. Morahan, A. Aleman, R. Vogel, S. Leicester, H. Weir, M. Meaux, S. Grebas, C.Solomon, M. Holland, T. Northcutt, R. A. Restrepo, R. Bilodeau, 2013. NASA/Global Change Master Directory (GCMD) Earth Science Keywords. Version 8.0.0.0.0


