Earth
ID: 30367
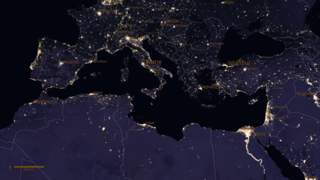
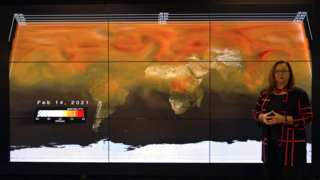
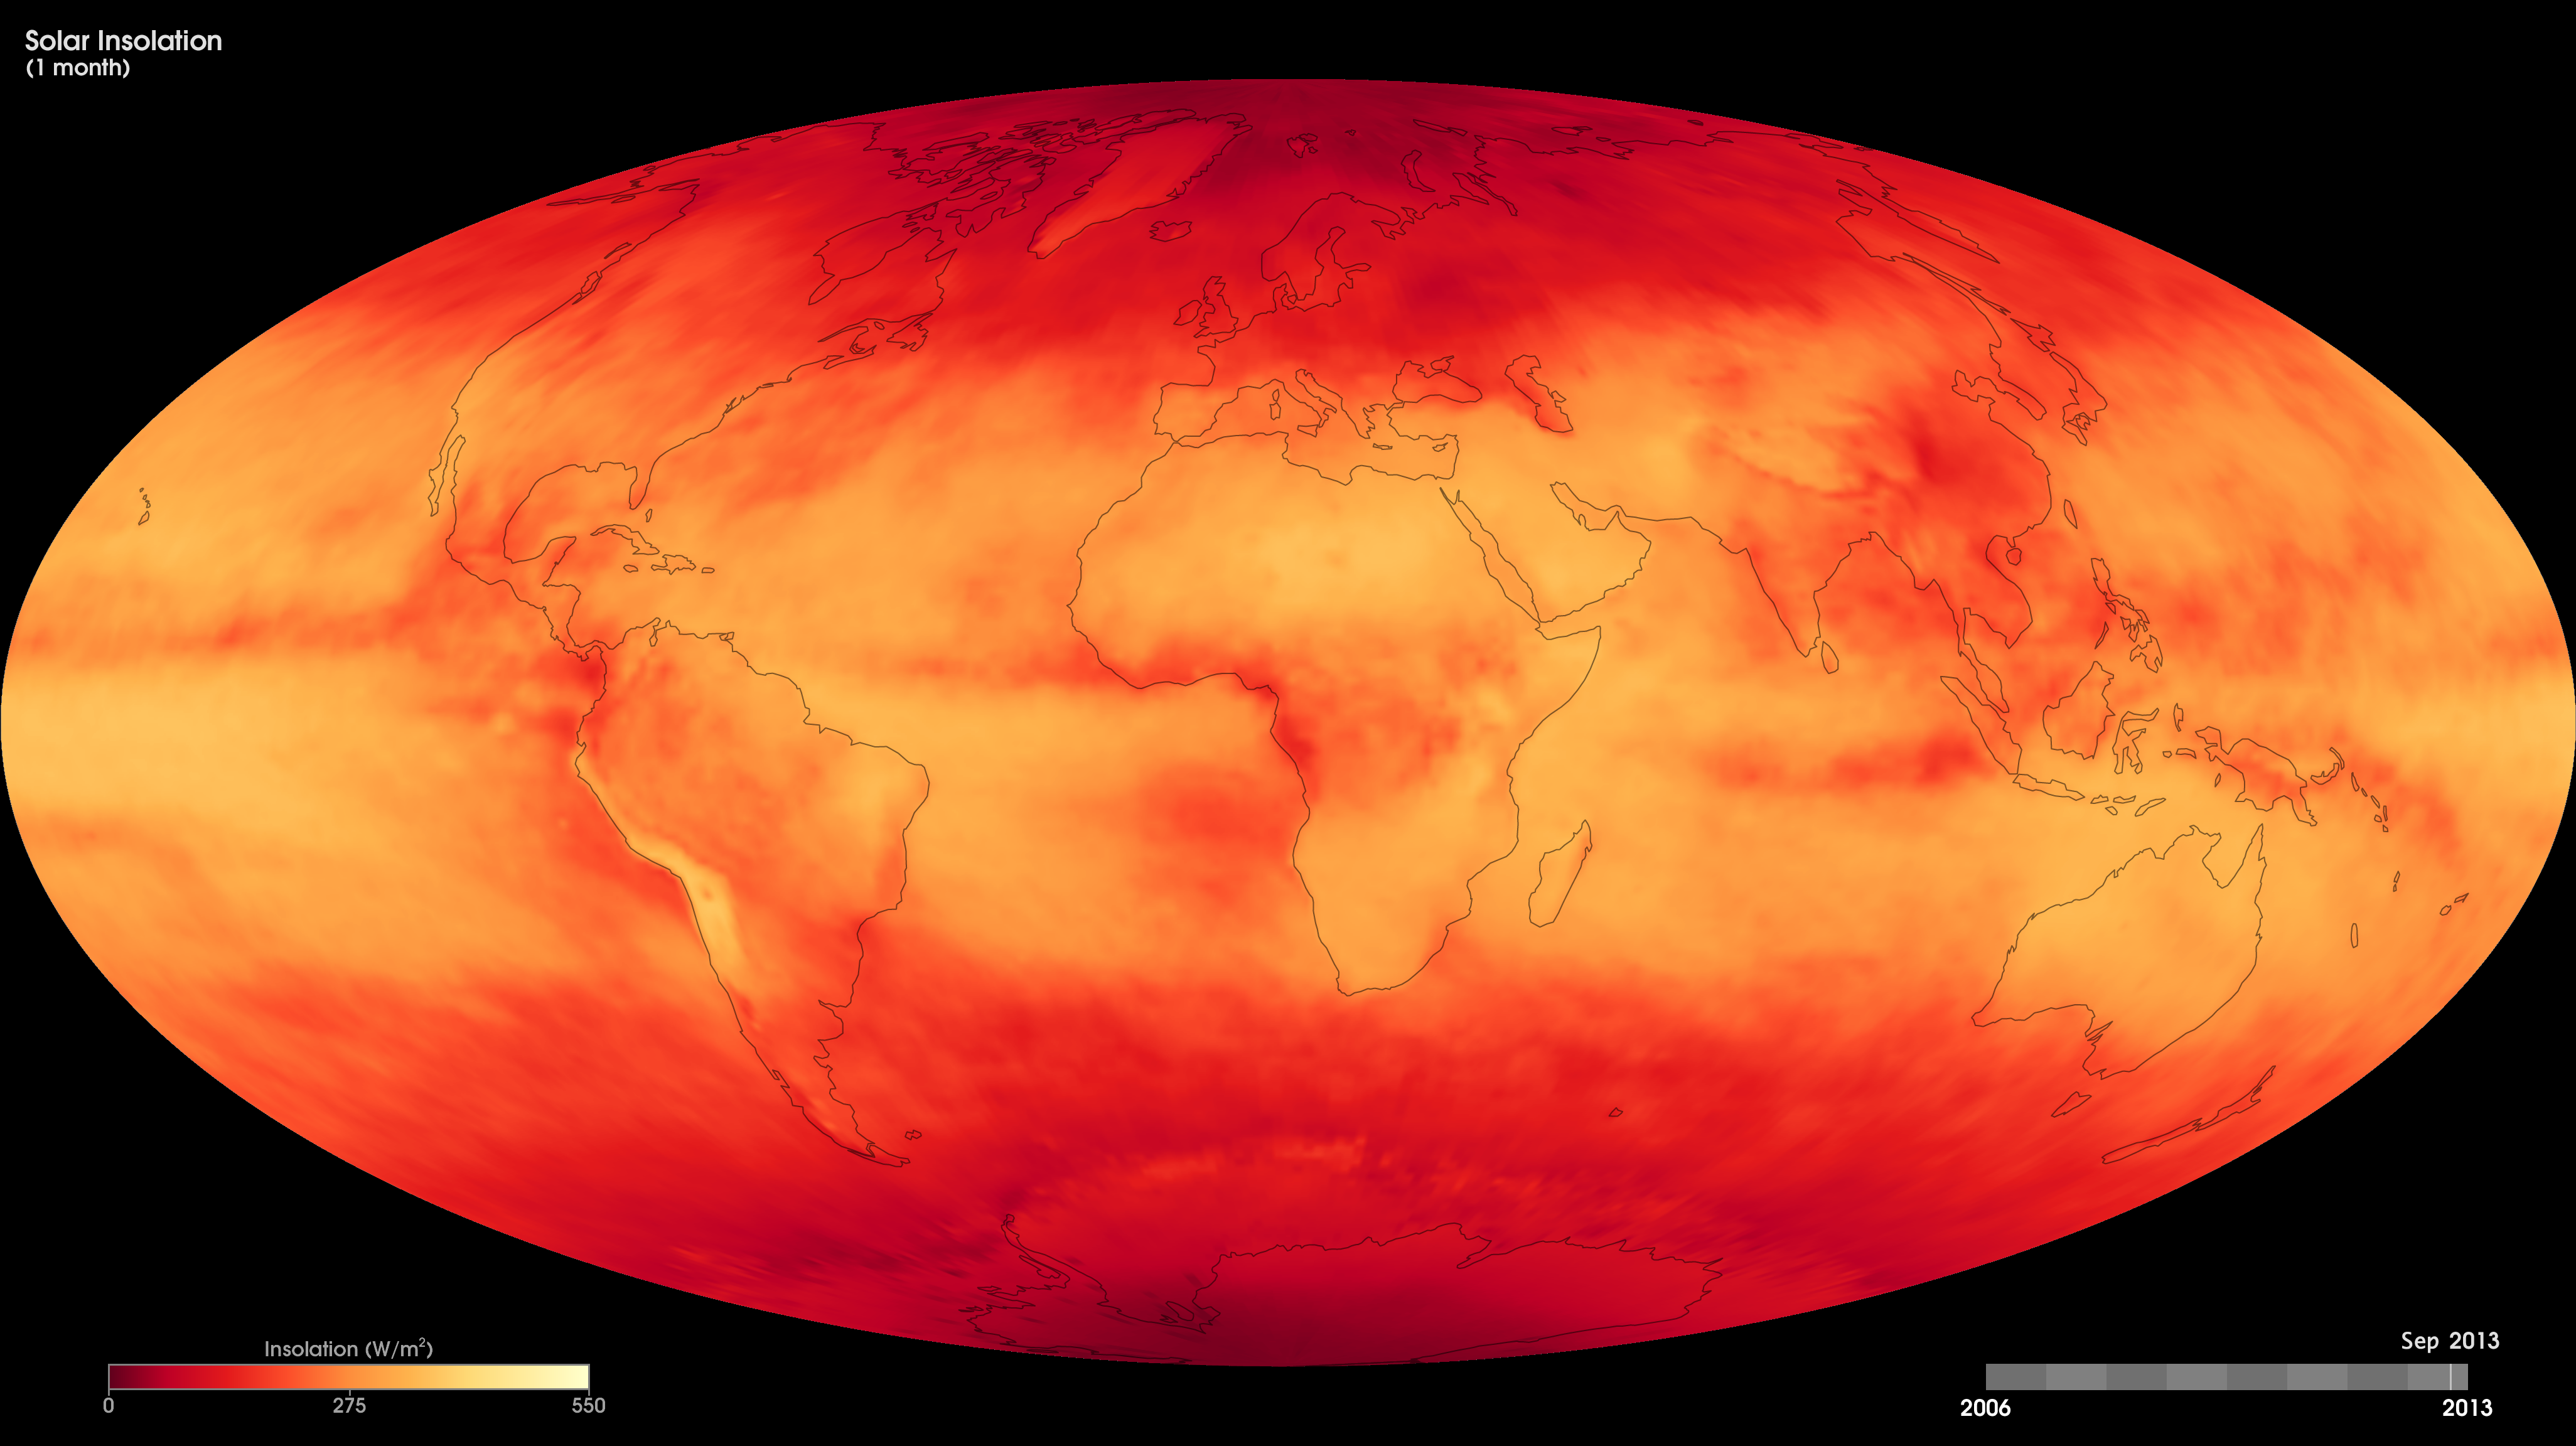
These maps show Earth's average monthly solar insolation, or the rate of incoming sunlight reaching the surface, from July 2006 to the present as derived from Clouds and Earth’s Radiant Energy System (CERES) measurements of radiant energy escaping the top of Earth's atmosphere. The CERES instrument flies onboard NASA’s Terra and Aqua satellites and makes these measurements every day on a global scale. The colors represent the kilowatt-hours of sunlight falling on every square meter of the surface per day, averaged over one month. Energy from the sun warms the surface, creating updrafts of air that carry warmth and moisture up into the atmosphere. Thus, knowing the rate of sunlight reaching the surface helps scientists understand weather and climate patterns. Exposure to sunlight is also a key limit to plant growth, particularly in tropical rainforests. Thus, insolation maps are also useful to scientists studying plant growth patterns in different parts of the world.
Monthly Solar Insolation
For More Information
Credits
Based on imagery by Jesse Allen, NASA Earth Observatory, based on FLASHFlux data. FLASHFlux data are produced using CERES observations convolved with MODIS measurements from both the Terra and Aqua satellite. Data provided by the FLASHFlux team, NASA Langley Research Center.
Short URL to share this page:
https://svs.gsfc.nasa.gov/30367
Missions:
Aqua
Terra
Data Used:
Note: While we identify the data sets used in these visualizations, we do not store any further details nor the data sets themselves on our site.
This item is part of this series:
NASA Earth Observations
Keywords:
SVS >> HDTV
GCMD >> Earth Science >> Atmosphere >> Atmospheric Radiation >> Incoming Solar Radiation
SVS >> Hyperwall
NASA Science >> Earth
SVS >> Presentation
GCMD keywords can be found on the Internet with the following citation: Olsen, L.M., G. Major, K. Shein, J. Scialdone, S. Ritz, T. Stevens, M. Morahan, A. Aleman, R. Vogel, S. Leicester, H. Weir, M. Meaux, S. Grebas, C.Solomon, M. Holland, T. Northcutt, R. A. Restrepo, R. Bilodeau, 2013. NASA/Global Change Master Directory (GCMD) Earth Science Keywords. Version 8.0.0.0.0
https://svs.gsfc.nasa.gov/30367
Missions:
Aqua
Terra
Data Used:
Terra/CERES
The CERES instrument aboard many Earth-orbiting satellites records the flow of reflected Solar radiation and reprocessed longwave radiation in the Earth's radiation budget.
Aqua/CERES/Incoming Solar Radiation
Data from SORCE for the flux magnitude at the Earth's orbit, coupled with solar incidence angles based on CERES measurement locations and times
This item is part of this series:
NASA Earth Observations
Keywords:
SVS >> HDTV
GCMD >> Earth Science >> Atmosphere >> Atmospheric Radiation >> Incoming Solar Radiation
SVS >> Hyperwall
NASA Science >> Earth
SVS >> Presentation
GCMD keywords can be found on the Internet with the following citation: Olsen, L.M., G. Major, K. Shein, J. Scialdone, S. Ritz, T. Stevens, M. Morahan, A. Aleman, R. Vogel, S. Leicester, H. Weir, M. Meaux, S. Grebas, C.Solomon, M. Holland, T. Northcutt, R. A. Restrepo, R. Bilodeau, 2013. NASA/Global Change Master Directory (GCMD) Earth Science Keywords. Version 8.0.0.0.0


