Earth
ID: 2995
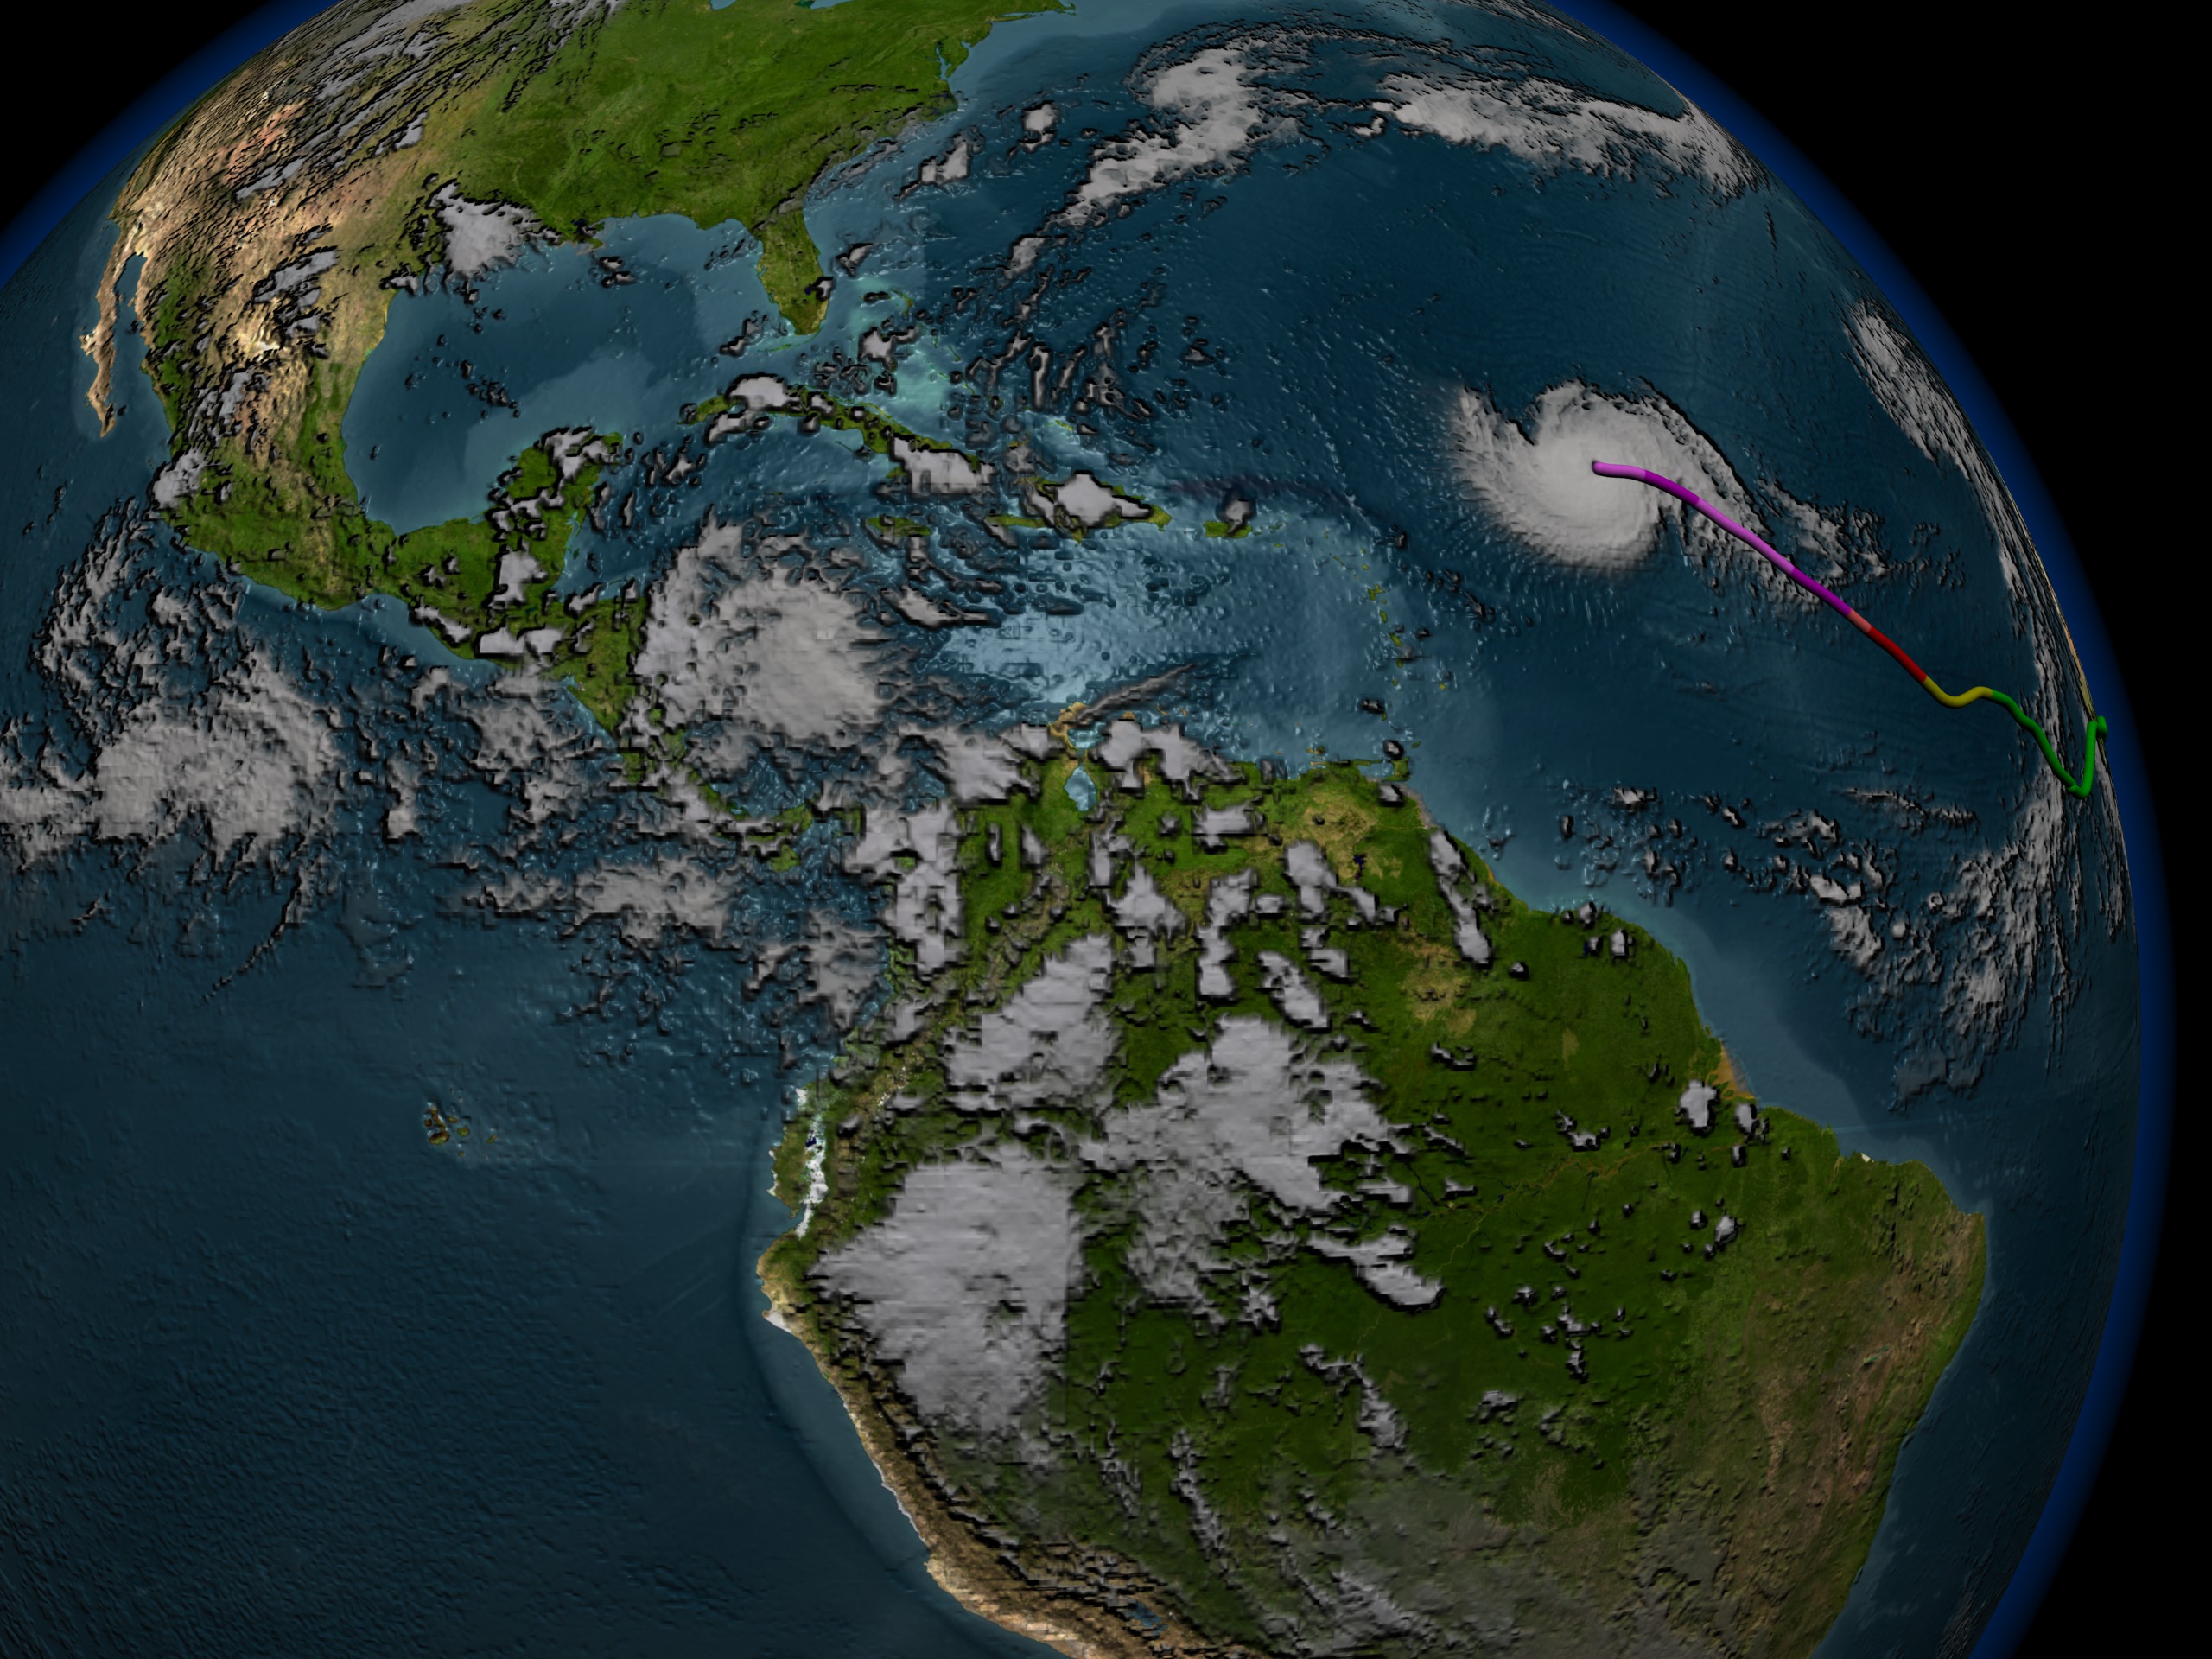
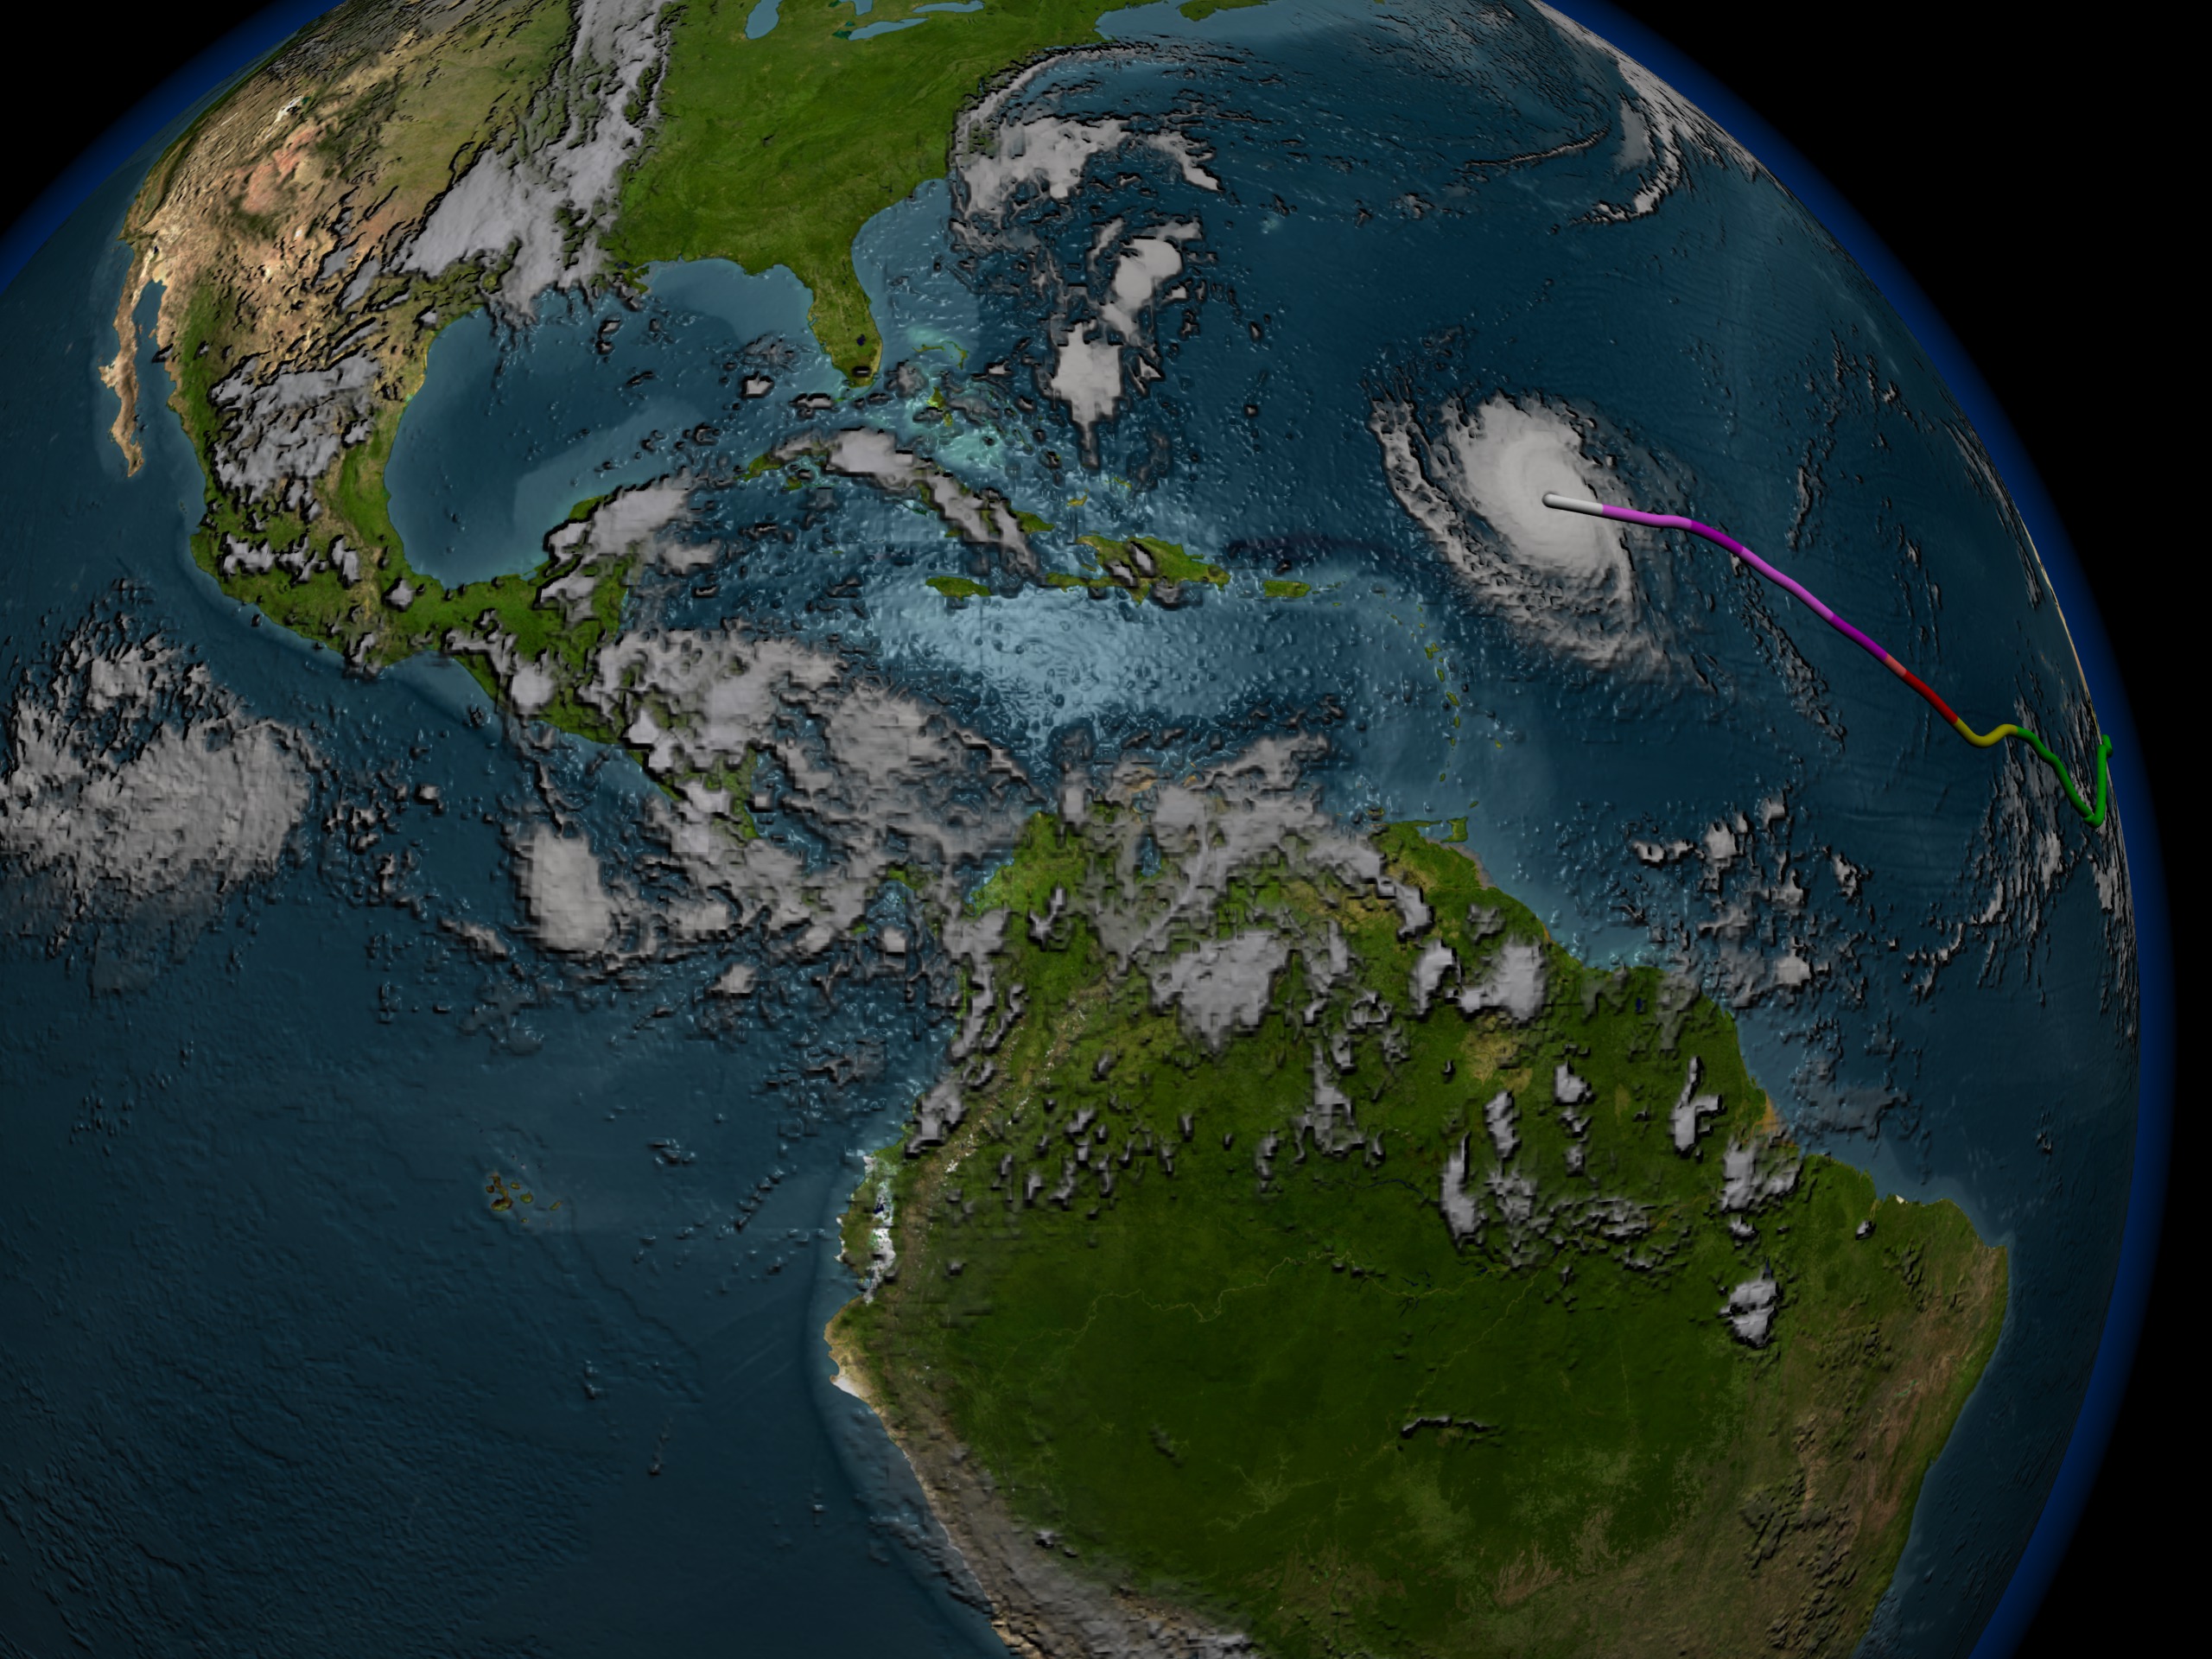
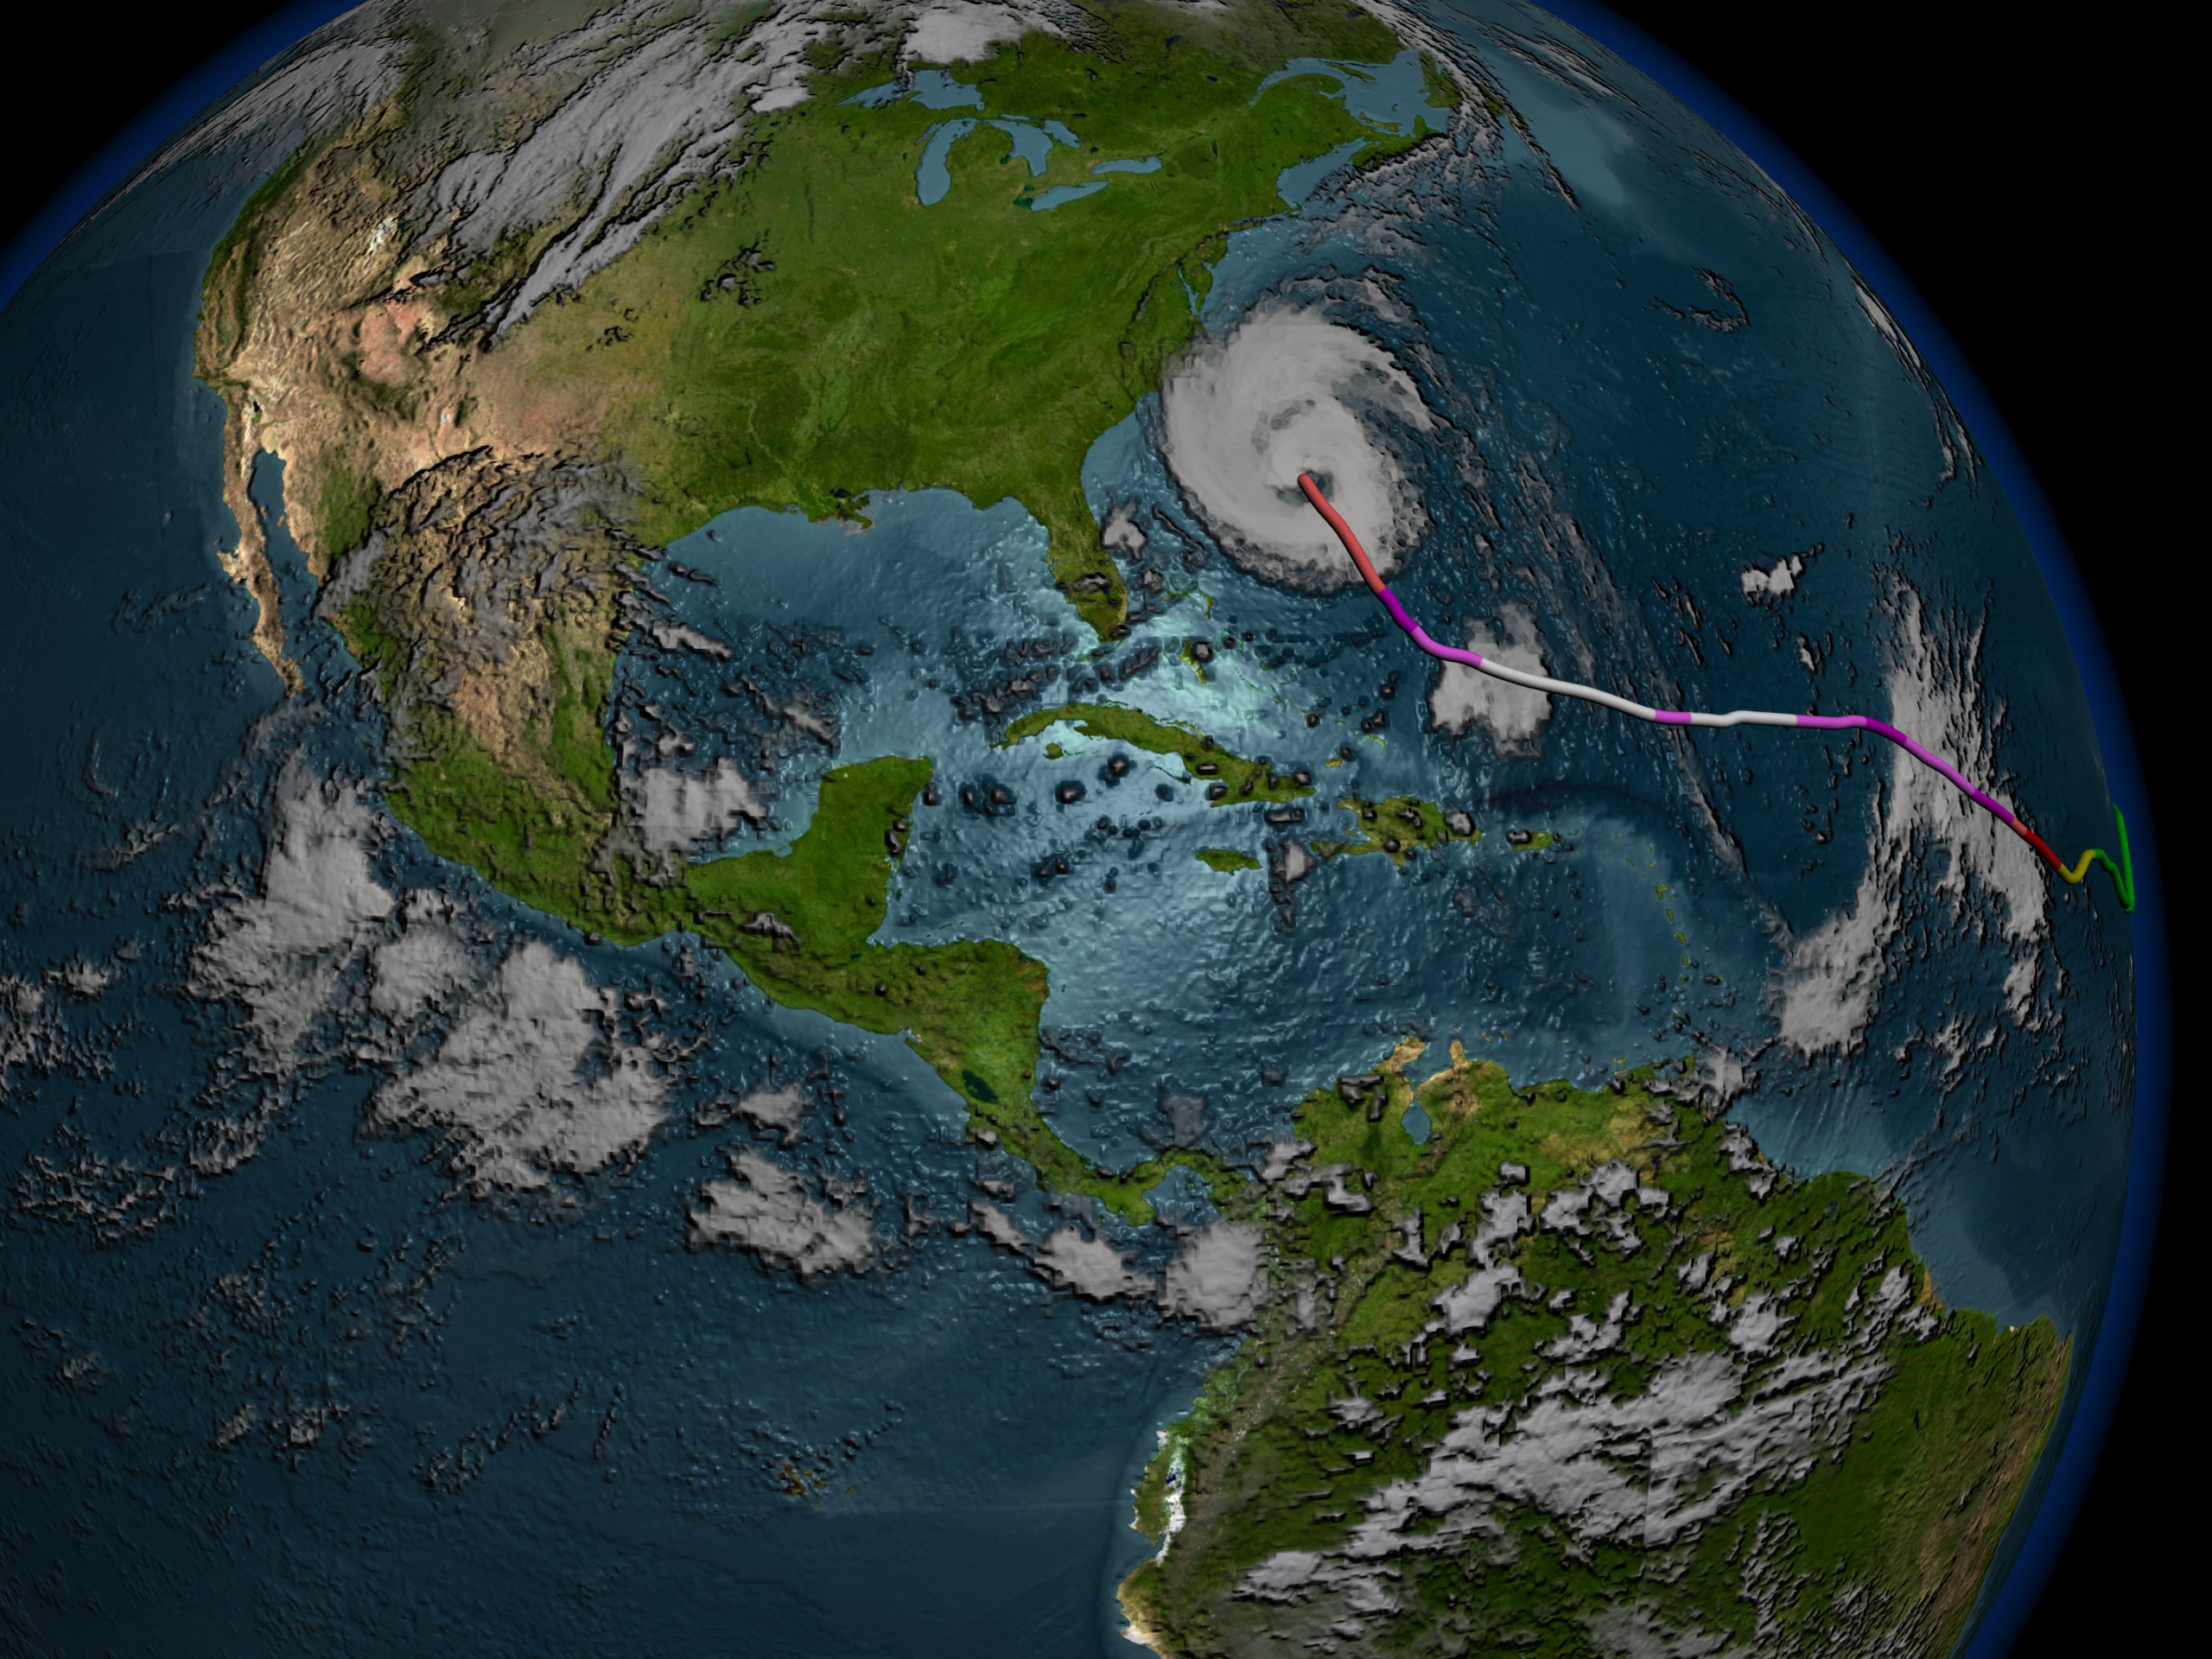
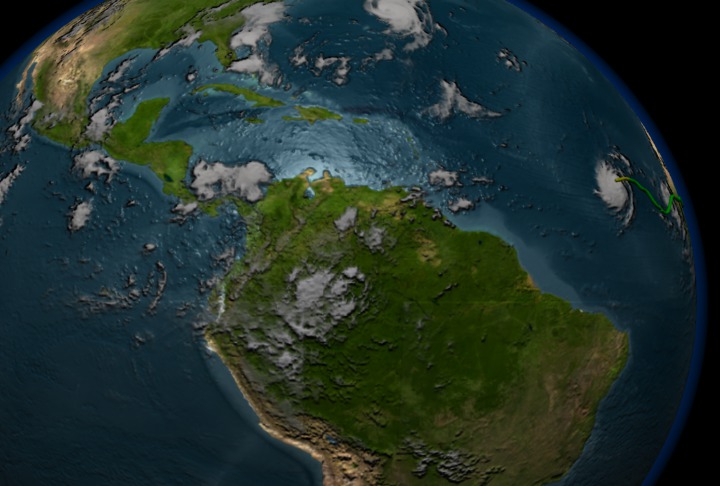
This visualization shows NOAA/GOES infrared (IR) data of Hurricane Isabel as it makes its way across the Atlantic towards landfall. The track of Isabel is shown using a color code to indicate the storm's category: green=tropical depression, yellow=tropical storm, red=category 1, light red=category 2, purple=category 3, light purple=category4, white=category 5. This visualization is the background for animation ID 2996.
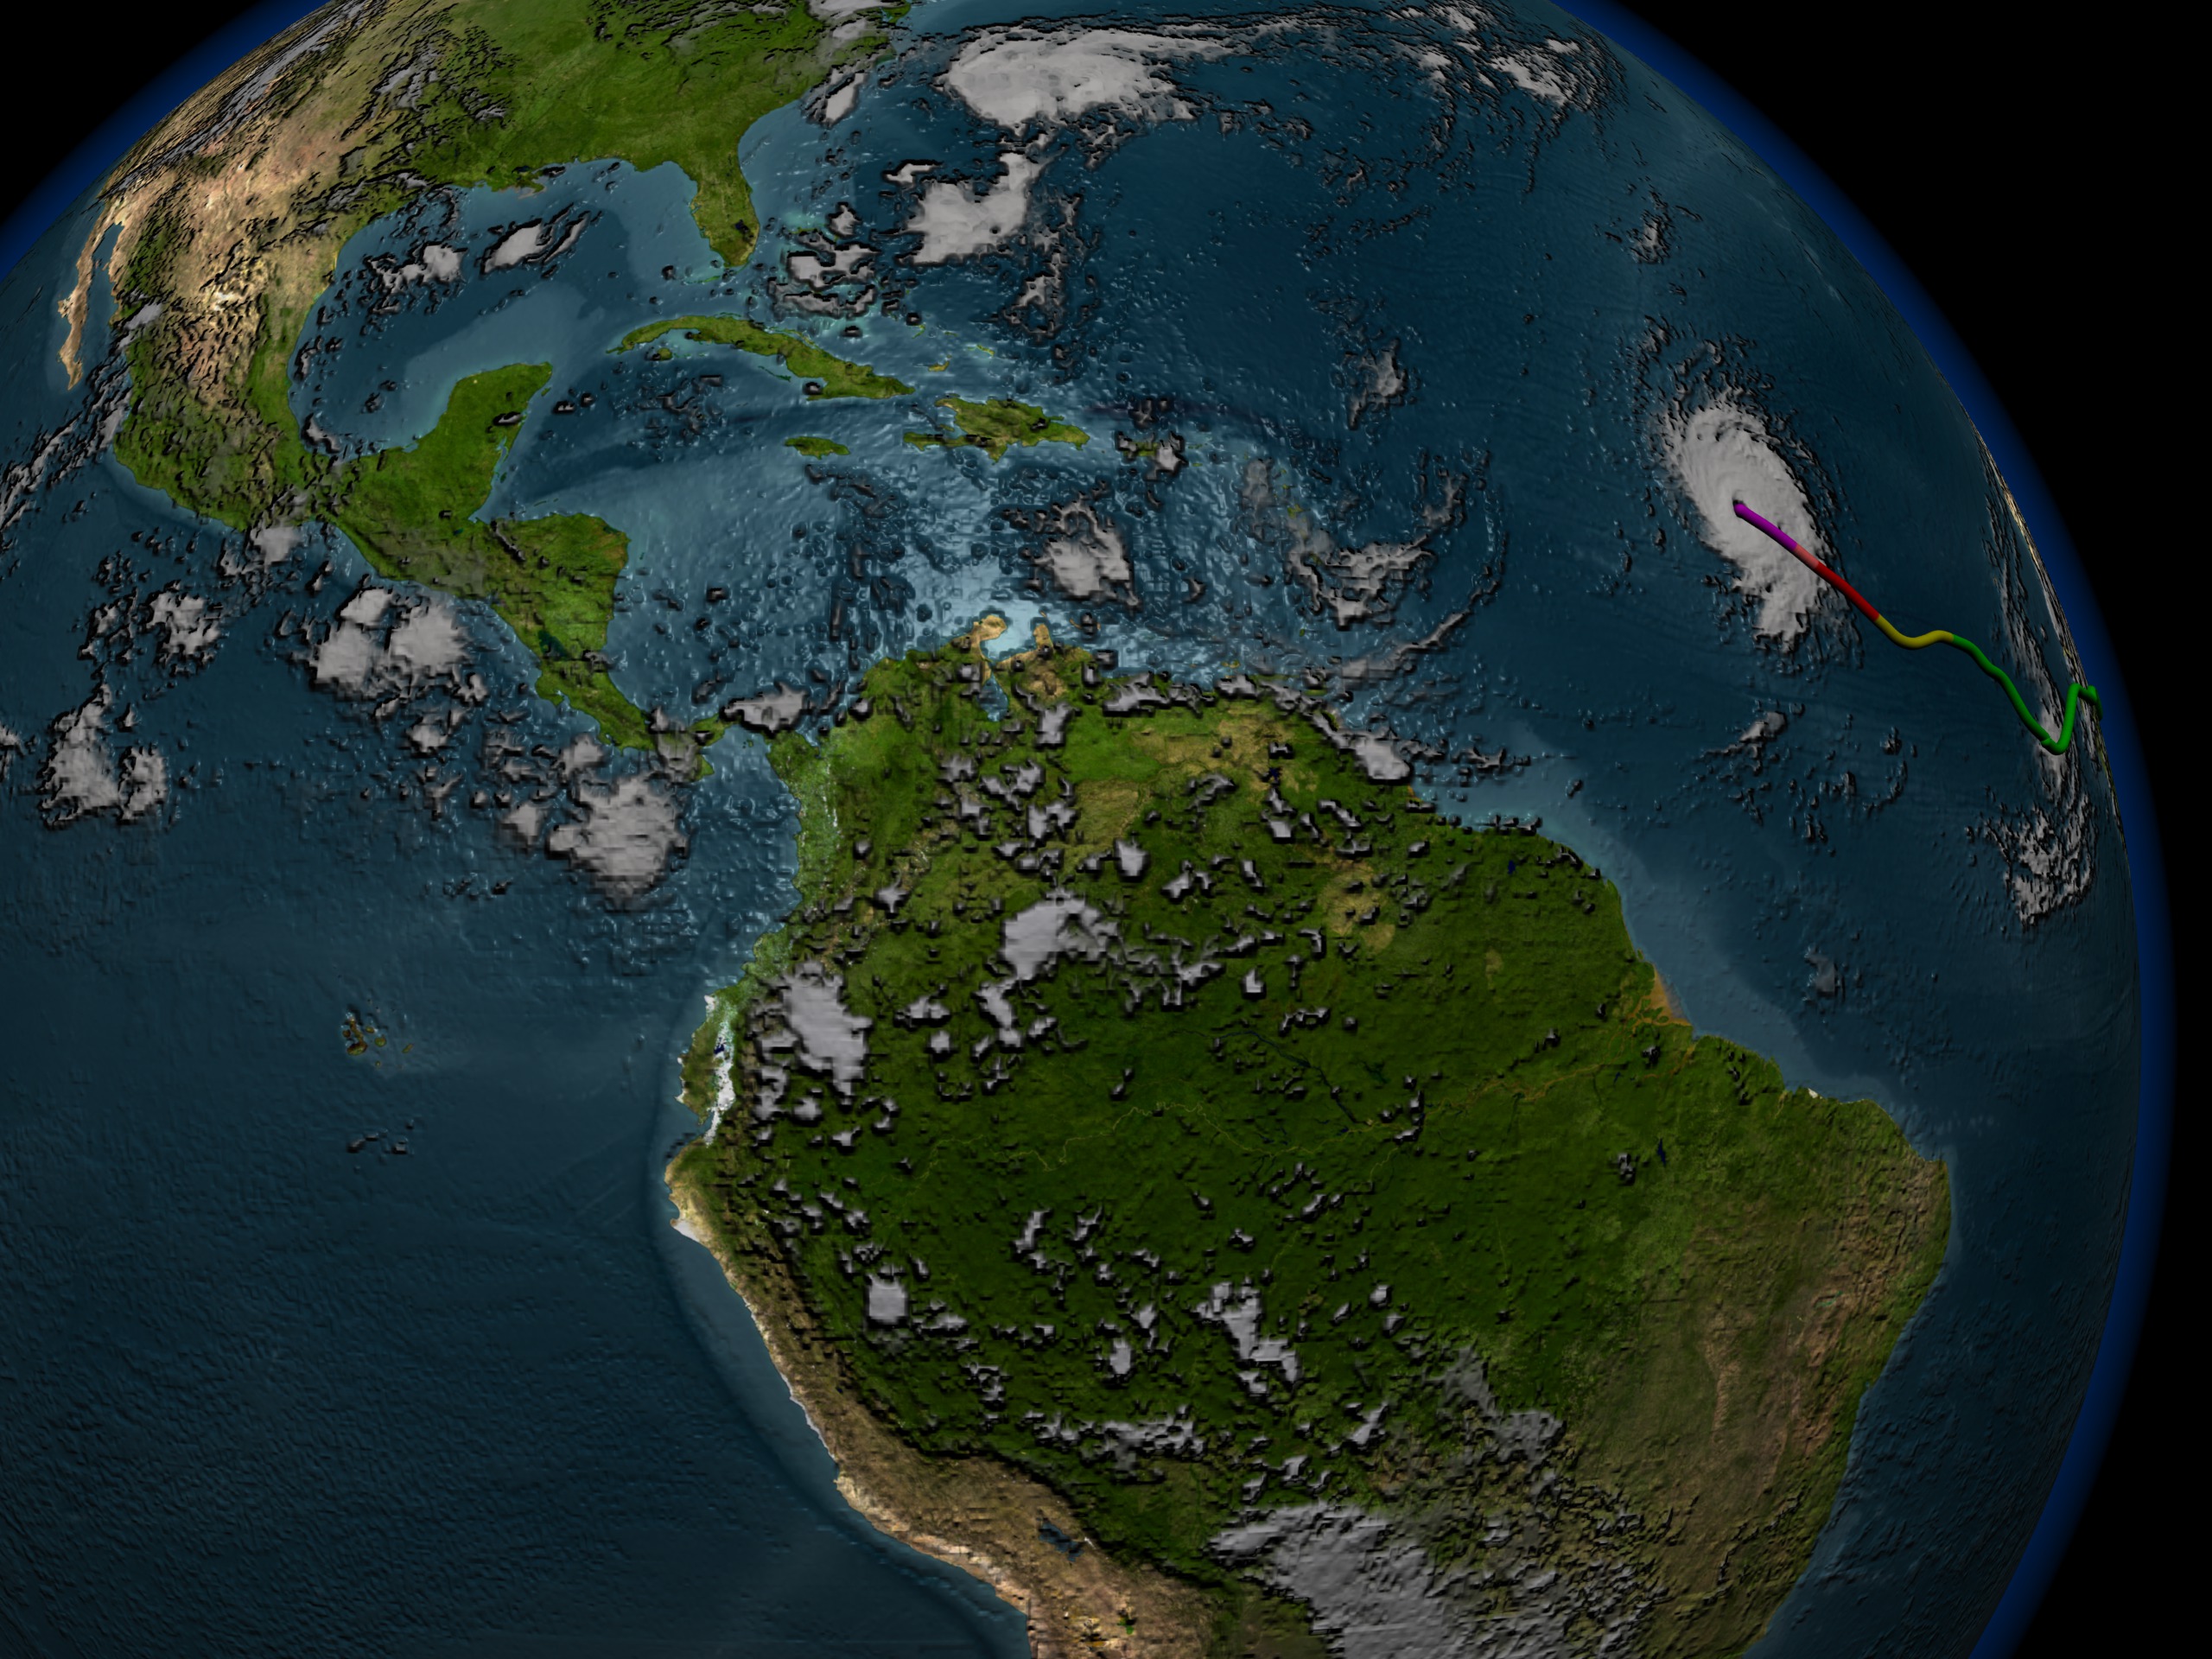

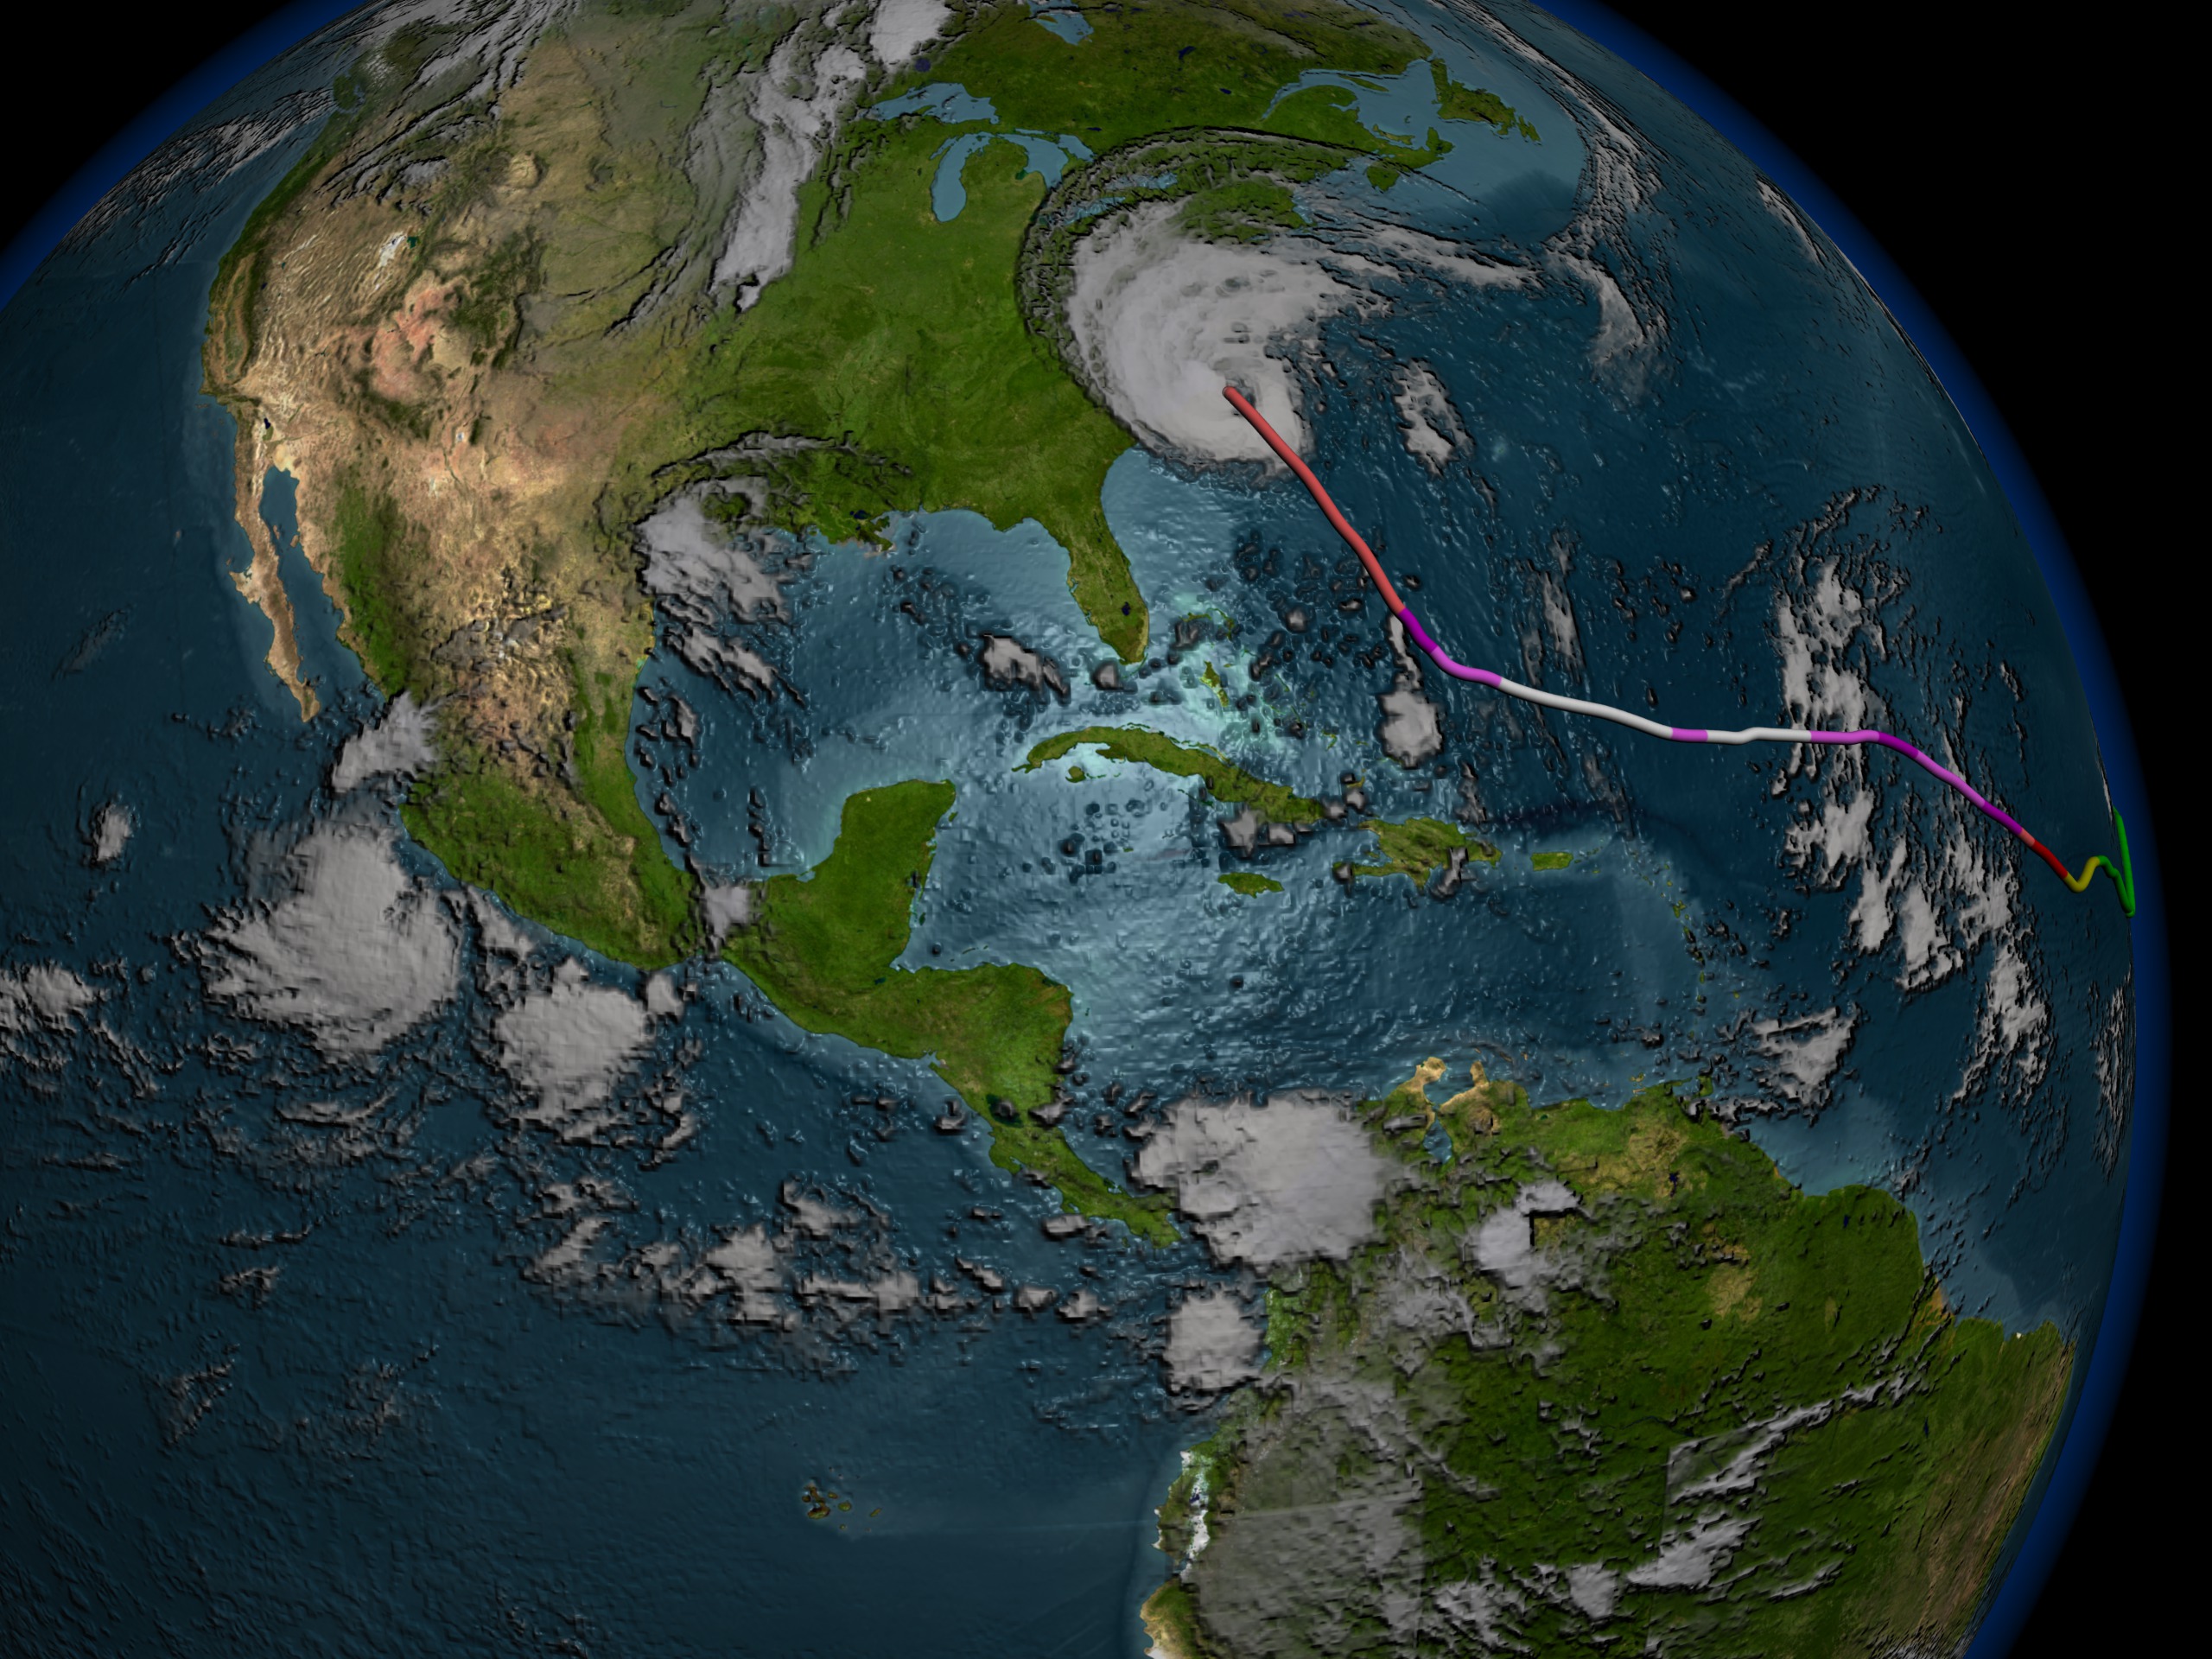
Hurricane Isabel: Under the Hood (background only)
Visualization Credits
Greg Shirah (NASA/GSFC): Lead Animator
Lori Perkins (NASA/GSFC): Animator
Marte Newcombe (GST): Animator
Alex Kekesi (Global Science and Technology, Inc.): Animator
Jeff Halverson (JCET UMBC): Scientist
Lori Perkins (NASA/GSFC): Animator
Marte Newcombe (GST): Animator
Alex Kekesi (Global Science and Technology, Inc.): Animator
Jeff Halverson (JCET UMBC): Scientist
Please give credit for this item to:
NASA/Goddard Space Flight Center Scientific Visualization Studio
NASA/Goddard Space Flight Center Scientific Visualization Studio
Short URL to share this page:
https://svs.gsfc.nasa.gov/2995
Mission:
Tropical Rainfall Measuring Mission - TRMM
Data Used:
Note: While we identify the data sets used in these visualizations, we do not store any further details nor the data sets themselves on our site.
This item is part of these series:
Hurricanes
TRMM 3D Hurricanes
Keywords:
GCMD >> Earth Science >> Atmosphere >> Precipitation
GCMD >> Earth Science >> Atmosphere >> Atmospheric Phenomena >> Hurricanes
GCMD >> Earth Science >> Human Dimensions >> Natural Hazards >> Meteorological Hazards
SVS >> GOES
SVS >> For Educators
SVS >> Atmospheric Circulation
SVS >> Atmospheric Science
SVS >> Meteorological Phenomenon
NASA Science >> Earth
GCMD keywords can be found on the Internet with the following citation: Olsen, L.M., G. Major, K. Shein, J. Scialdone, S. Ritz, T. Stevens, M. Morahan, A. Aleman, R. Vogel, S. Leicester, H. Weir, M. Meaux, S. Grebas, C.Solomon, M. Holland, T. Northcutt, R. A. Restrepo, R. Bilodeau, 2013. NASA/Global Change Master Directory (GCMD) Earth Science Keywords. Version 8.0.0.0.0
https://svs.gsfc.nasa.gov/2995
Mission:
Tropical Rainfall Measuring Mission - TRMM
Data Used:
TRMM/PR
2004/09/08, 2004/09/10, 2004/09/12, 2004/09/14-16GOES/AMSU
2003/09/07-2003/09/19GOES/HIRS
2003/09/07-2003/09/19This item is part of these series:
Hurricanes
TRMM 3D Hurricanes
Keywords:
GCMD >> Earth Science >> Atmosphere >> Precipitation
GCMD >> Earth Science >> Atmosphere >> Atmospheric Phenomena >> Hurricanes
GCMD >> Earth Science >> Human Dimensions >> Natural Hazards >> Meteorological Hazards
SVS >> GOES
SVS >> For Educators
SVS >> Atmospheric Circulation
SVS >> Atmospheric Science
SVS >> Meteorological Phenomenon
NASA Science >> Earth
GCMD keywords can be found on the Internet with the following citation: Olsen, L.M., G. Major, K. Shein, J. Scialdone, S. Ritz, T. Stevens, M. Morahan, A. Aleman, R. Vogel, S. Leicester, H. Weir, M. Meaux, S. Grebas, C.Solomon, M. Holland, T. Northcutt, R. A. Restrepo, R. Bilodeau, 2013. NASA/Global Change Master Directory (GCMD) Earth Science Keywords. Version 8.0.0.0.0


