Earth
ID: 2927
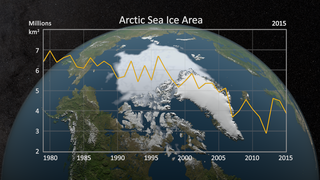
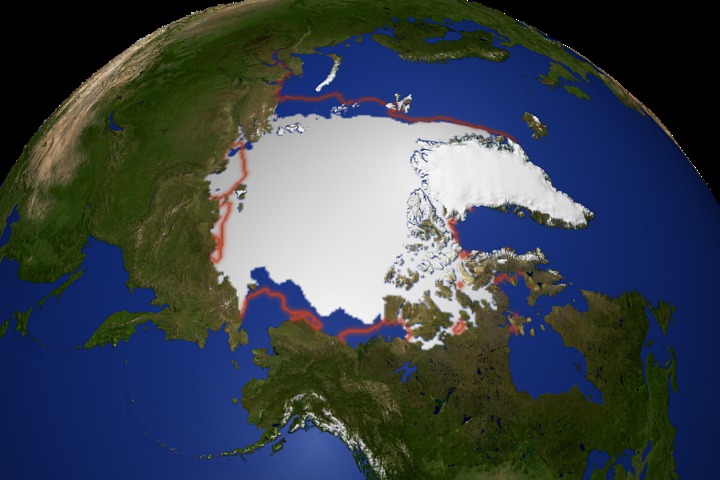
This animation shows the Arctic yearly minimum sea ice extent from September for each year from 1979 through 2003. The average sea ice extent from 1979-2002 is outlined in orange.
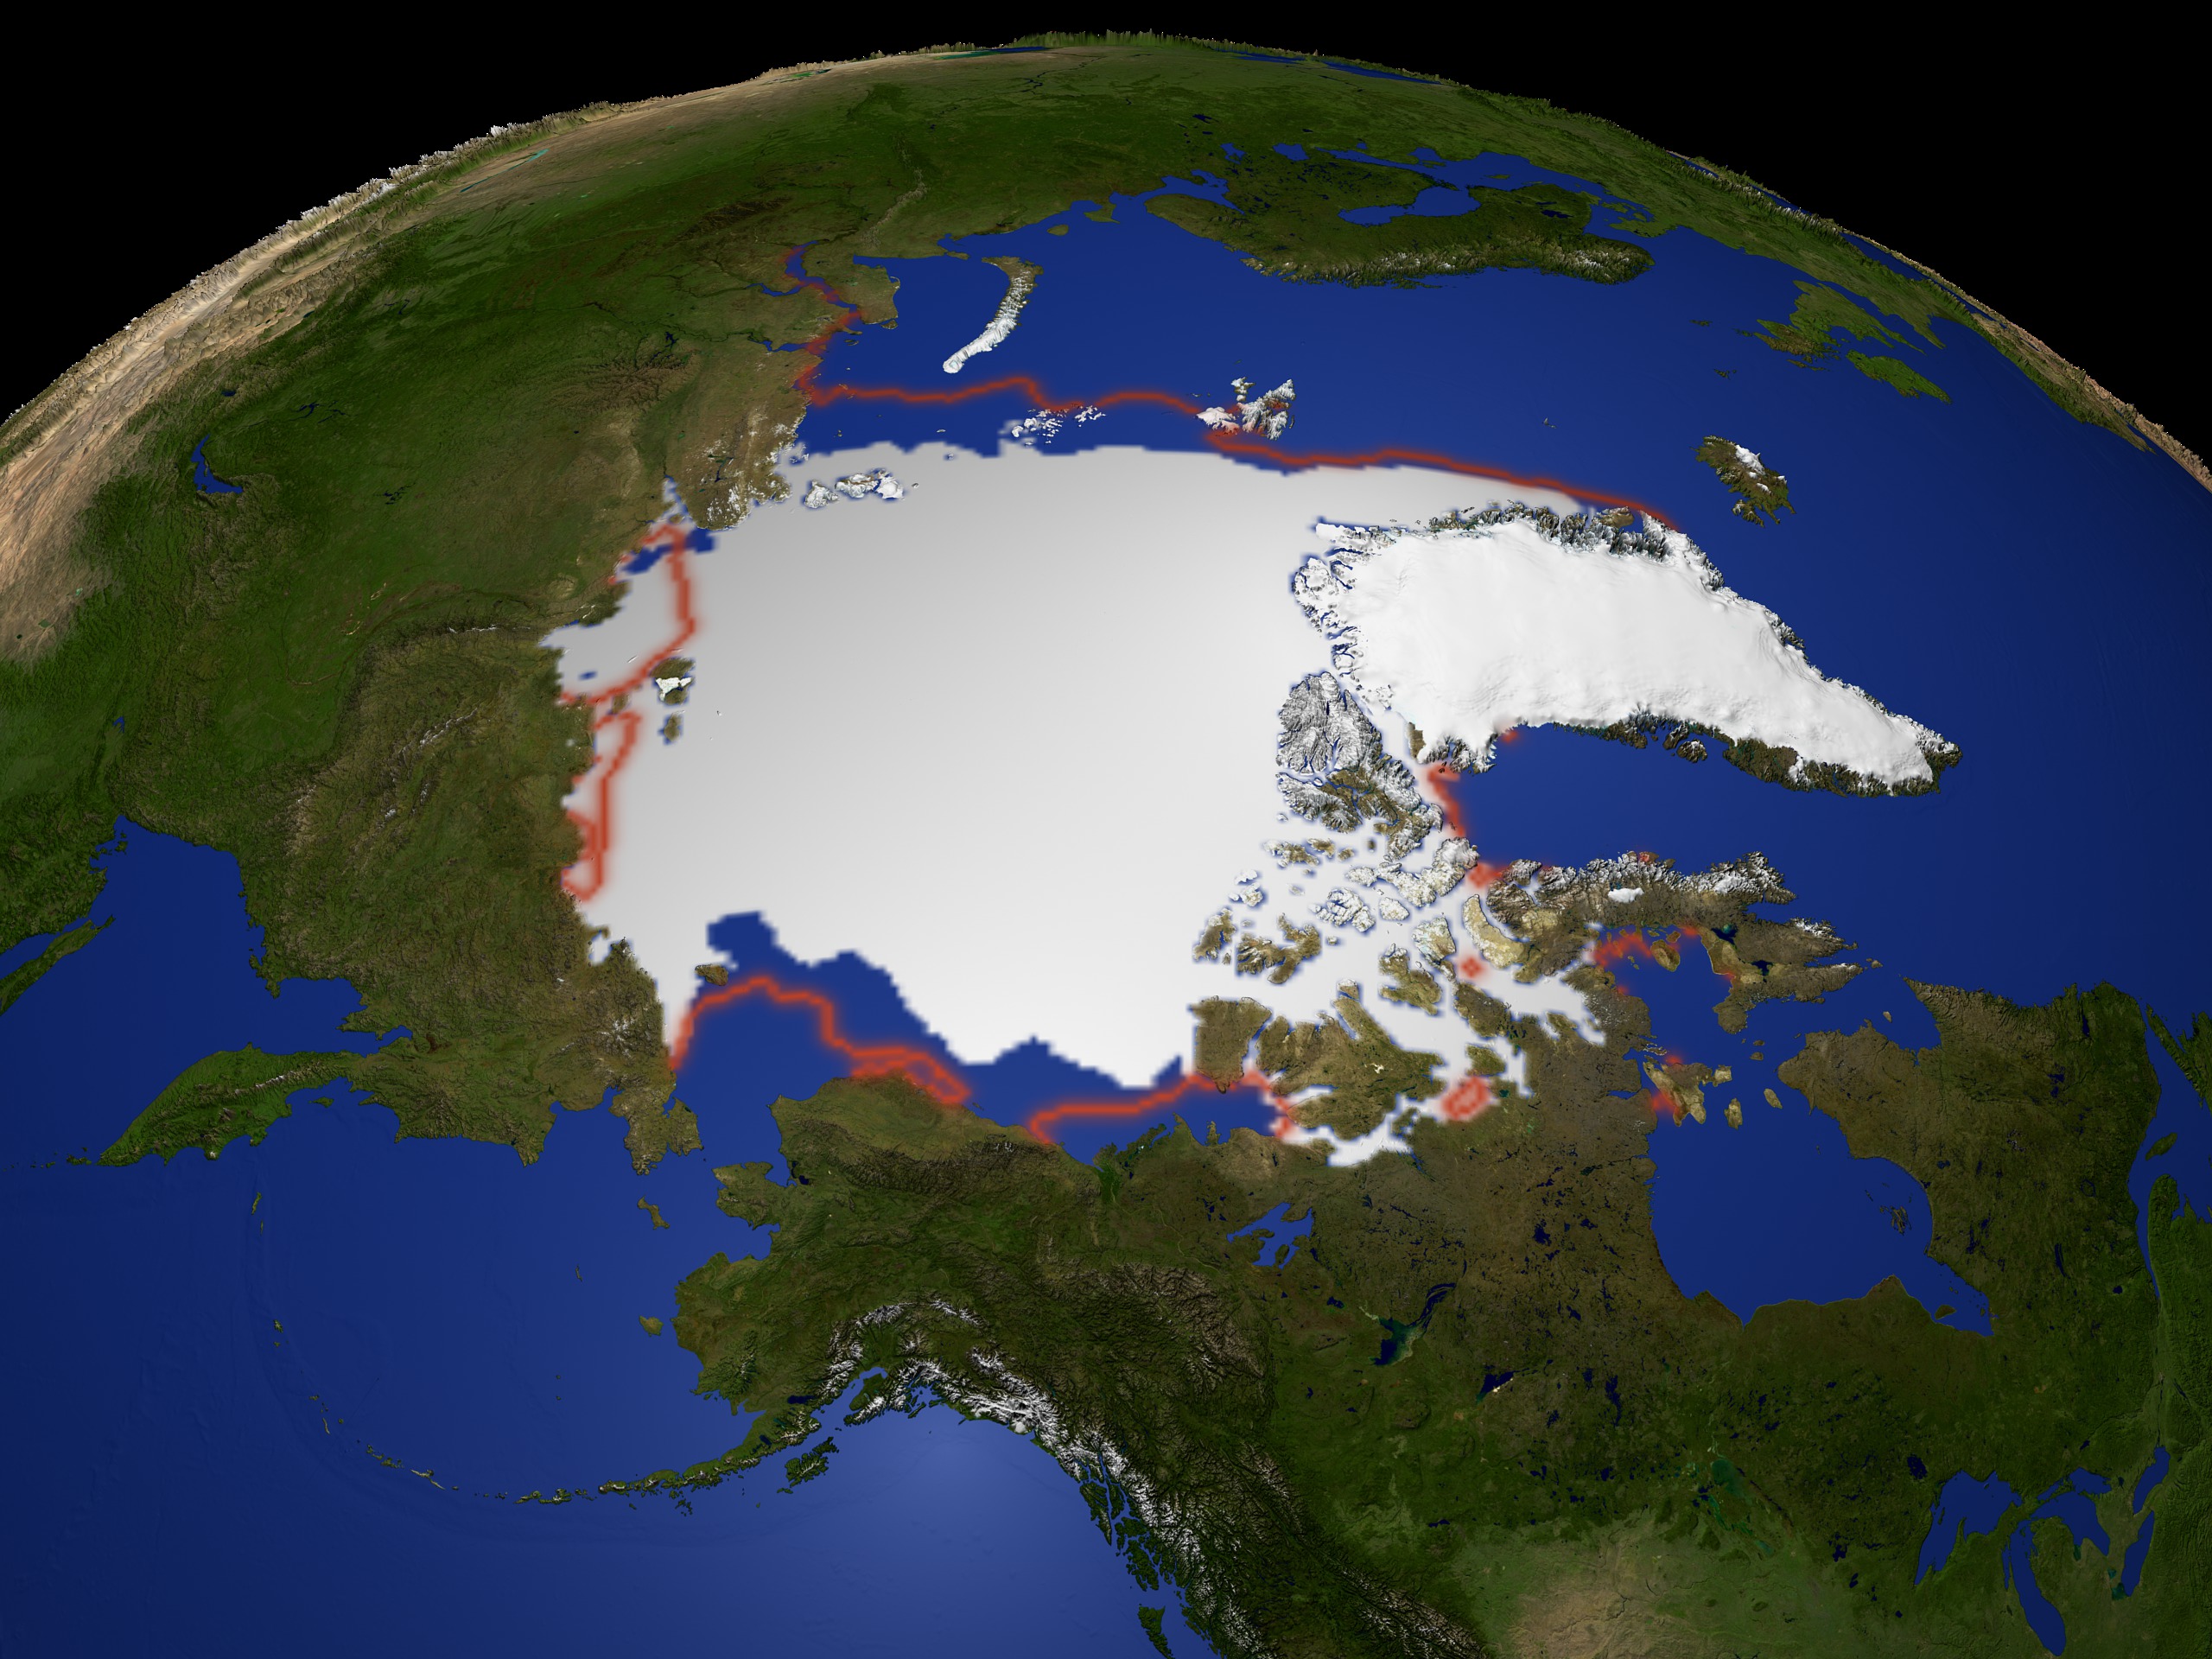
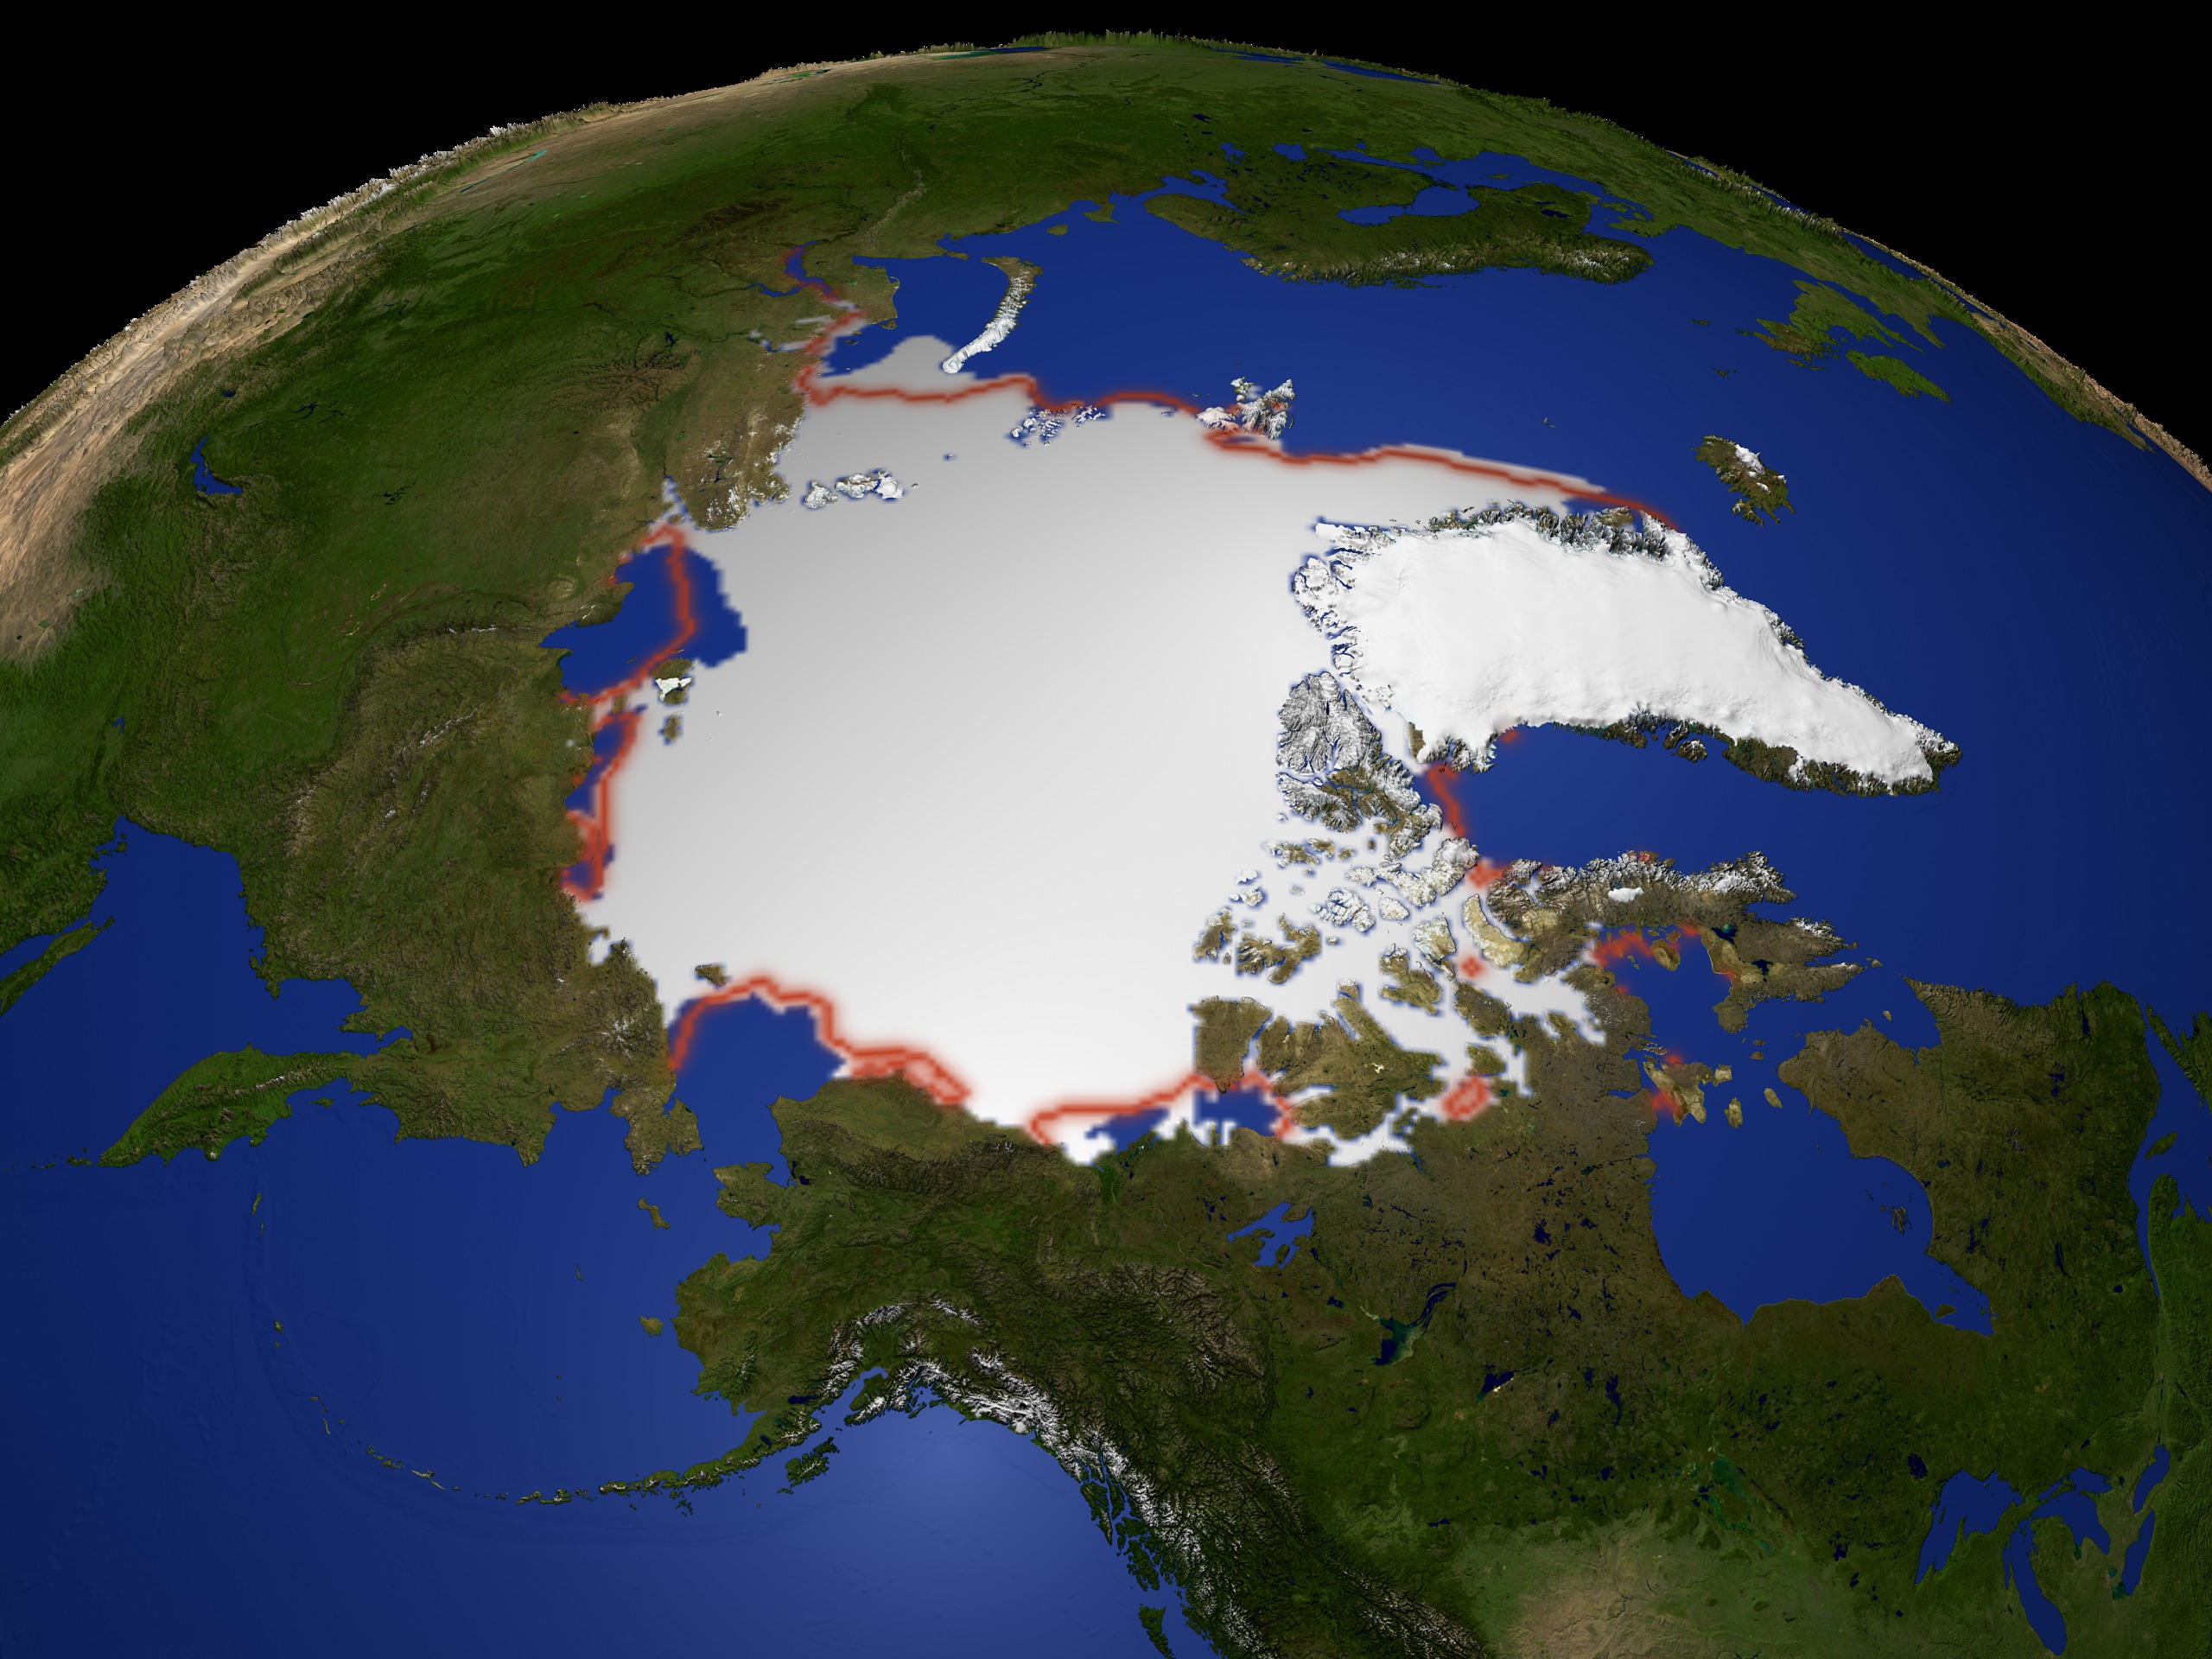
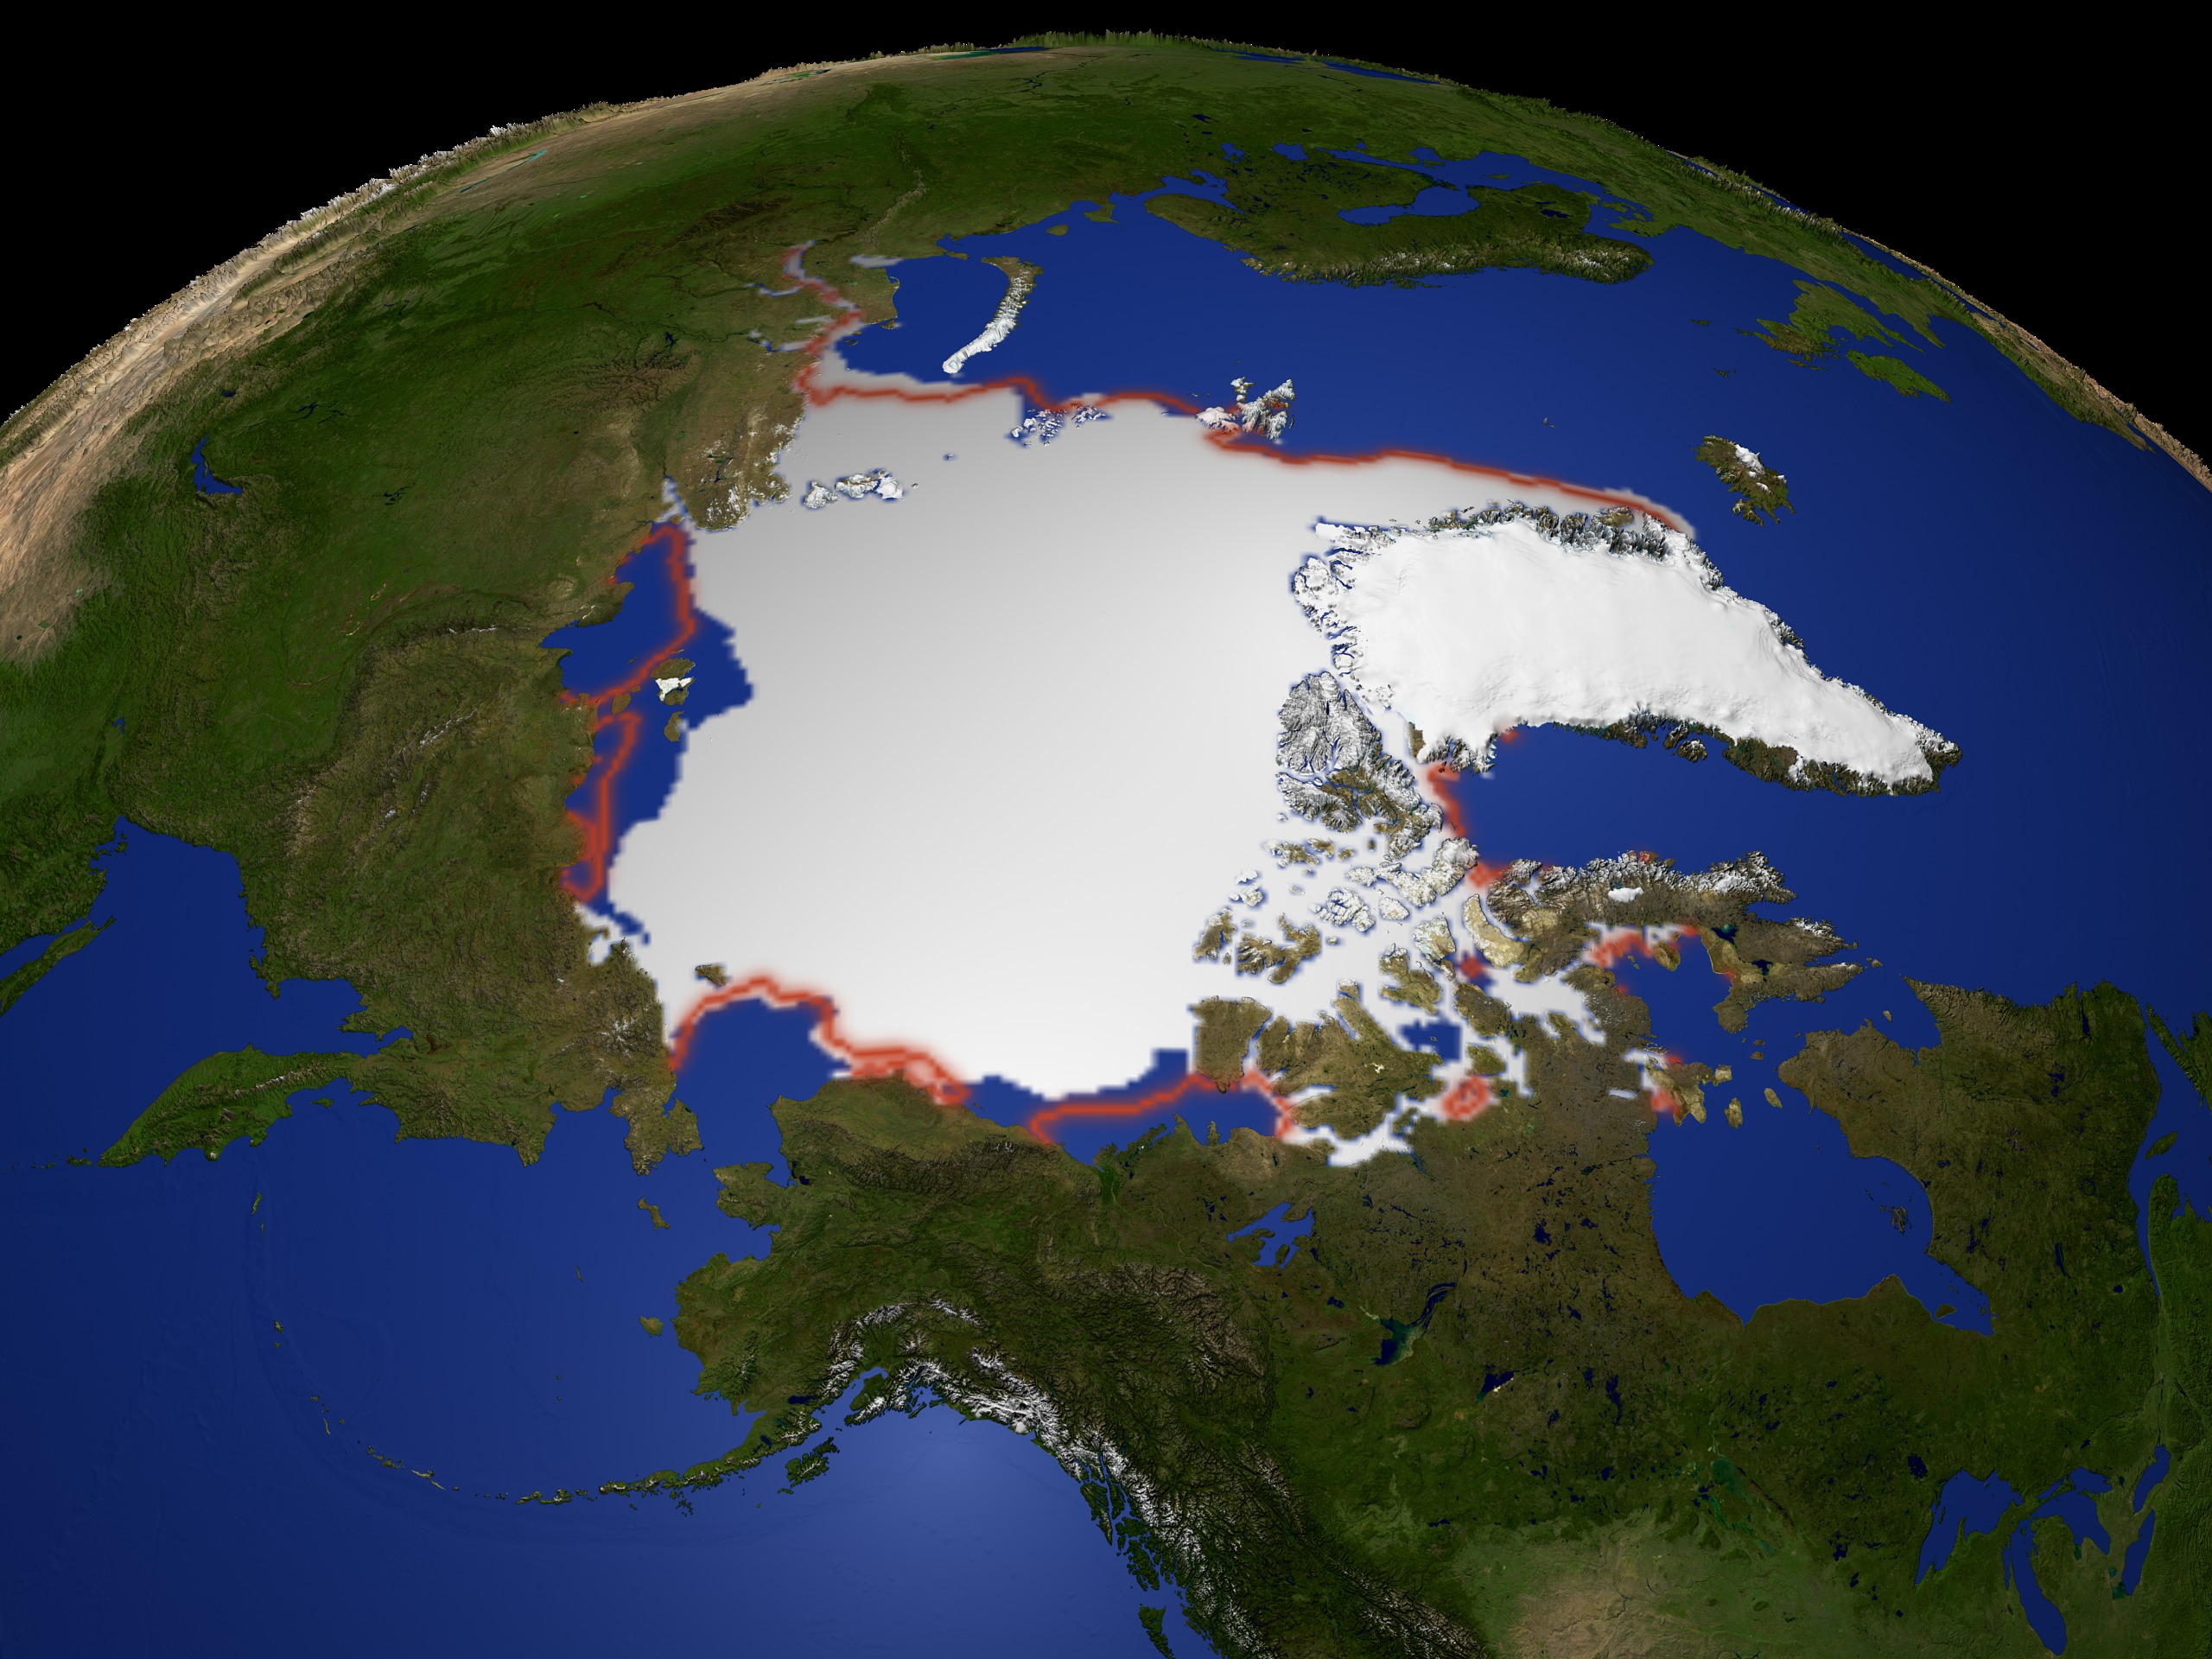
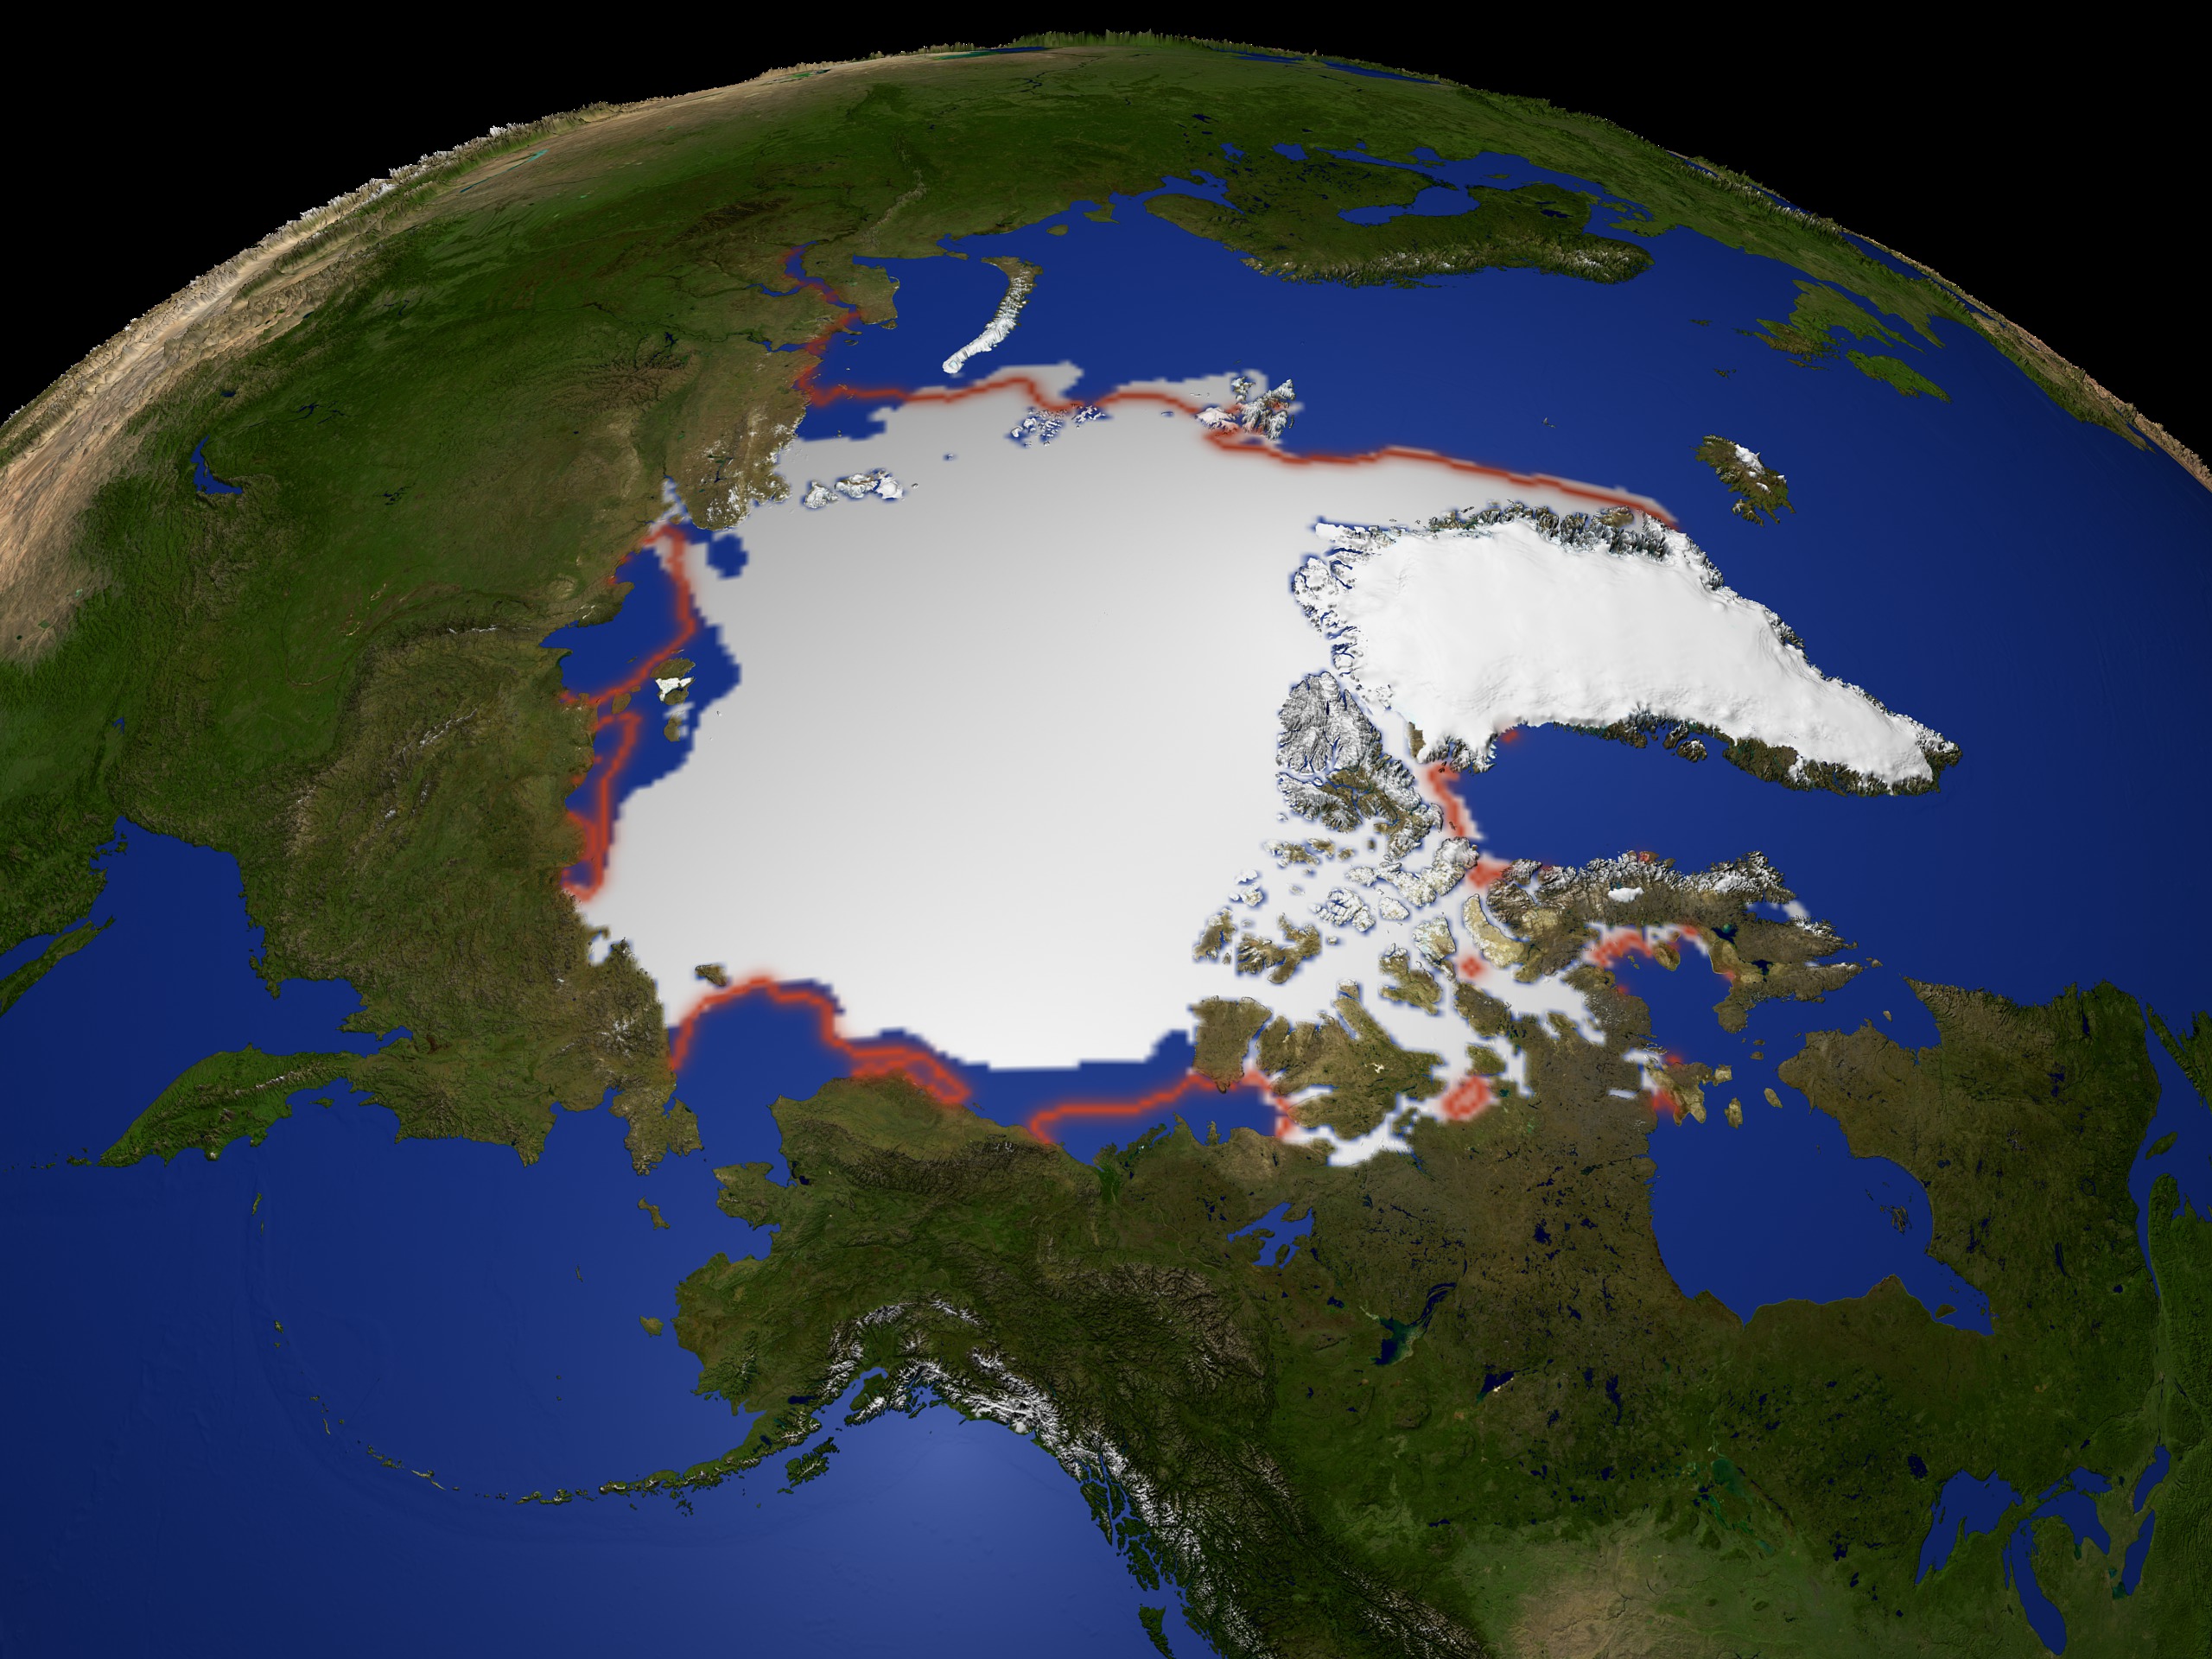
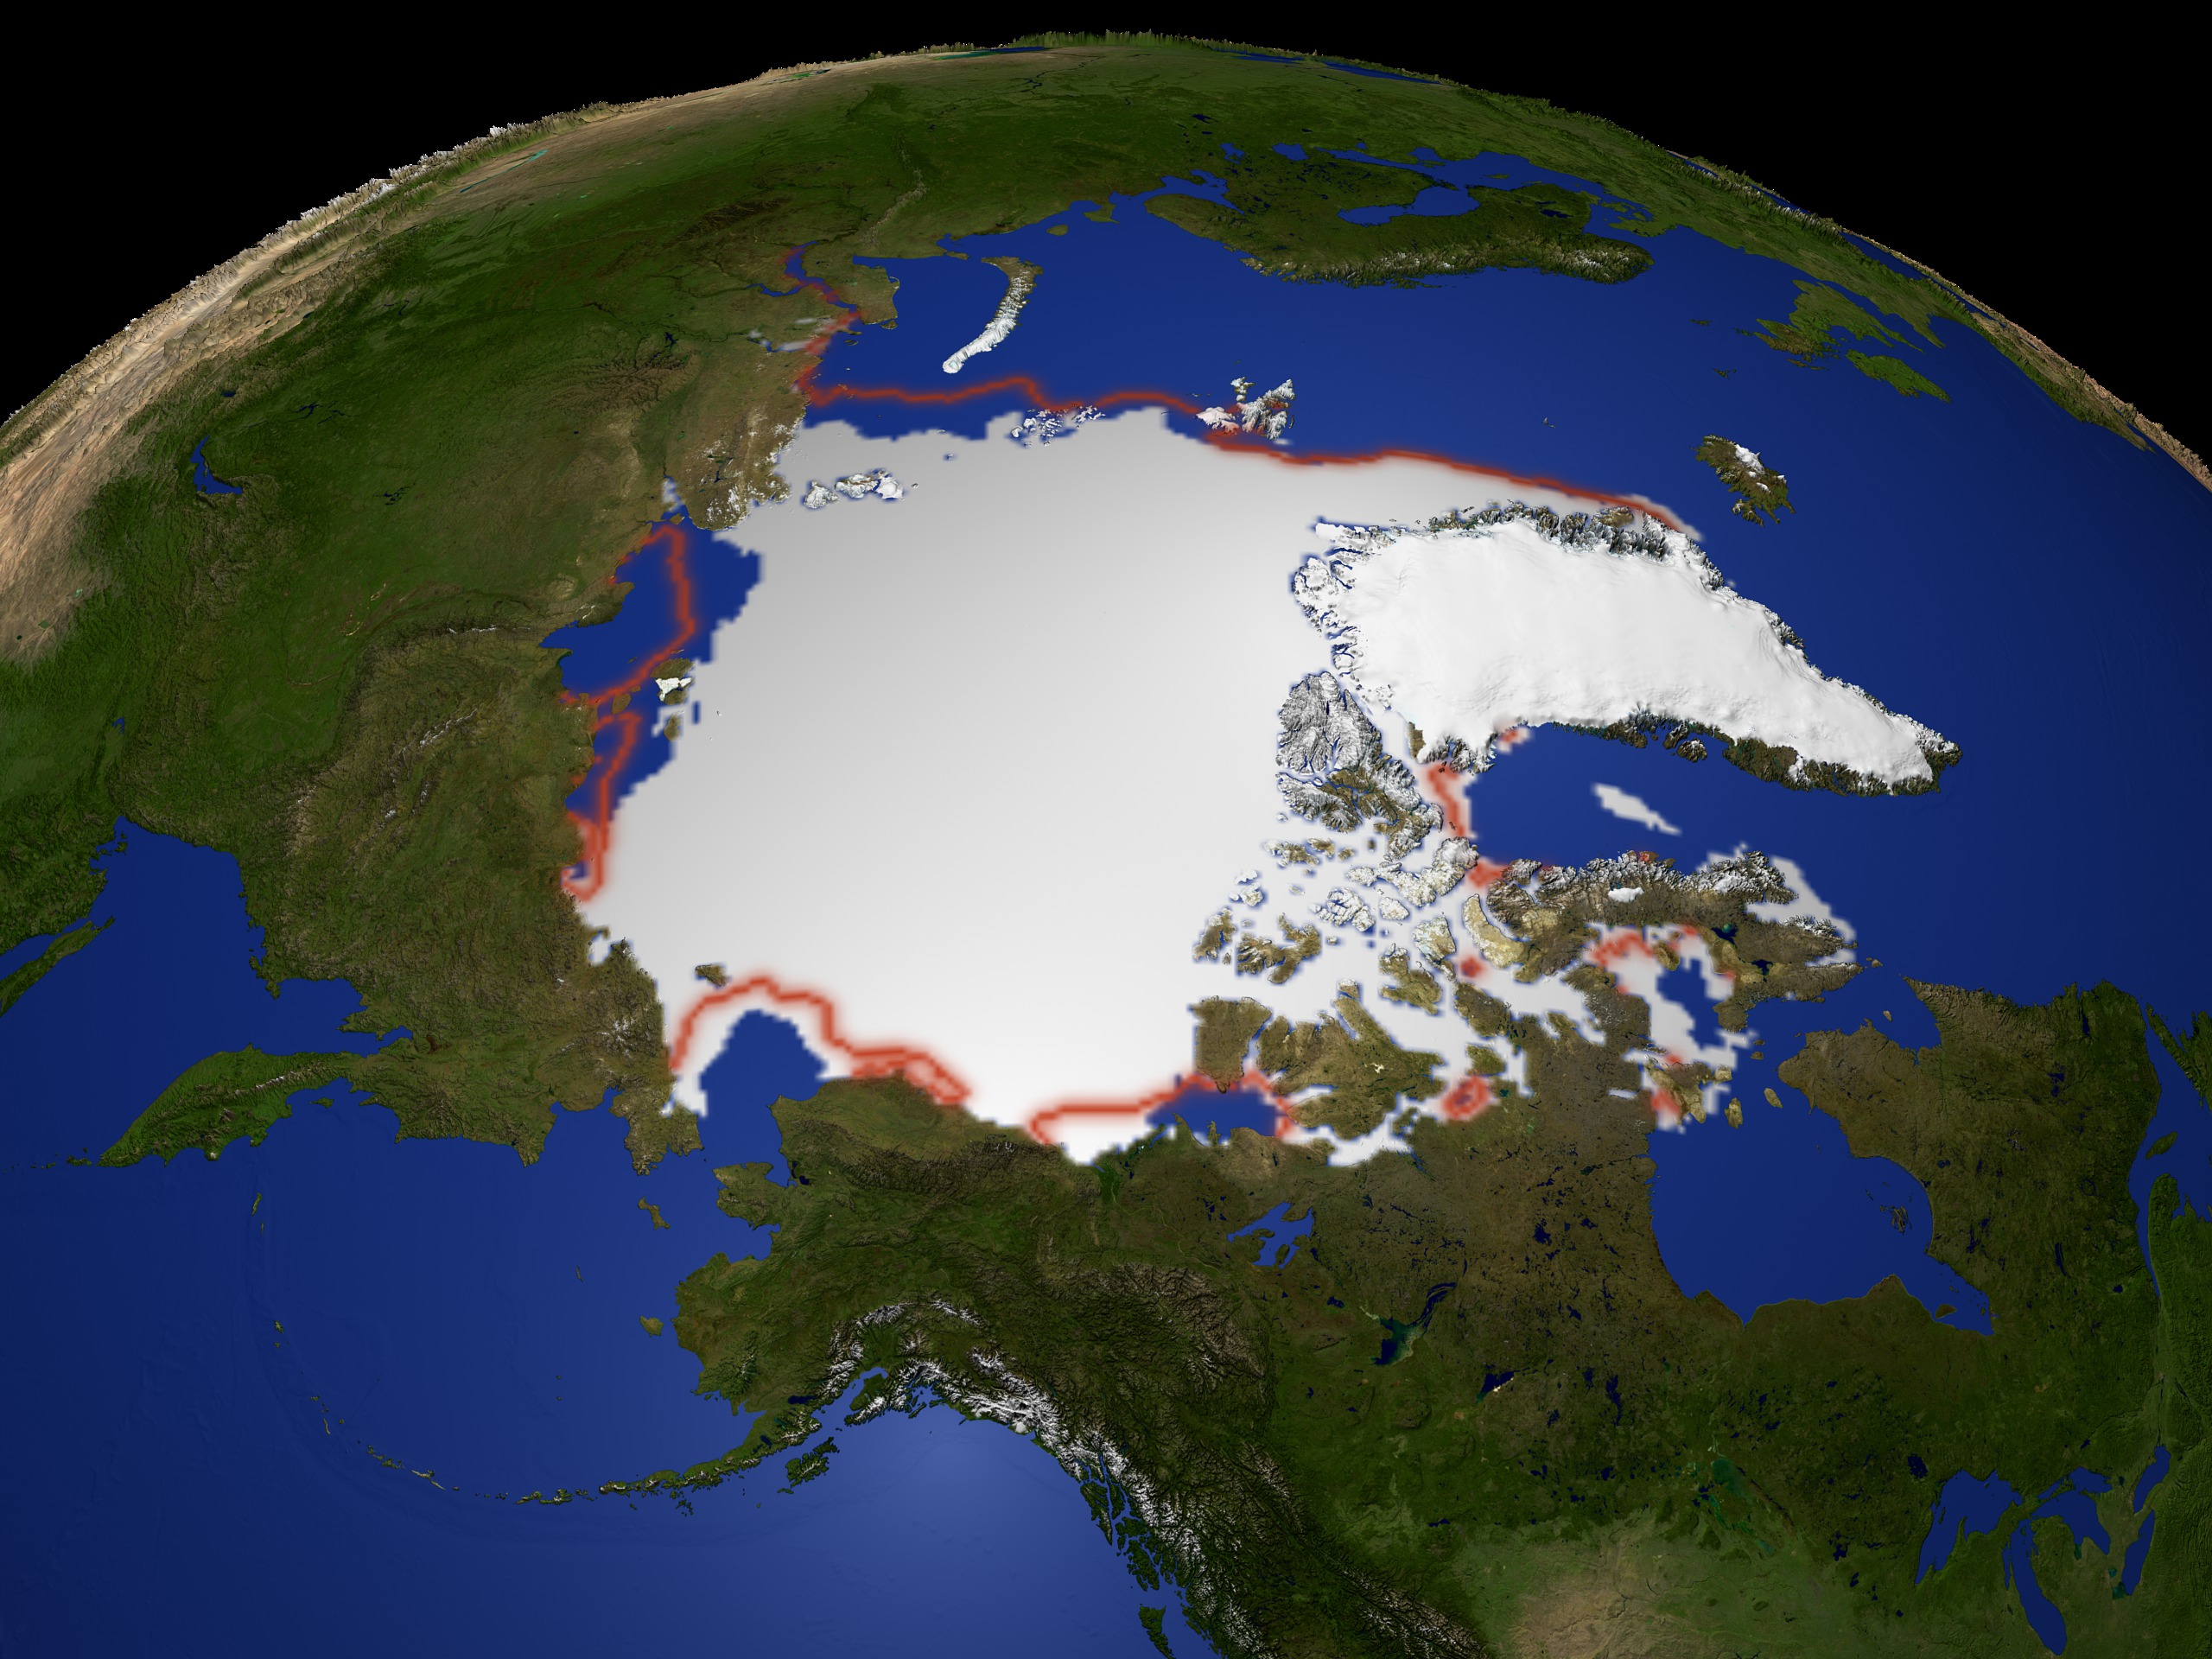

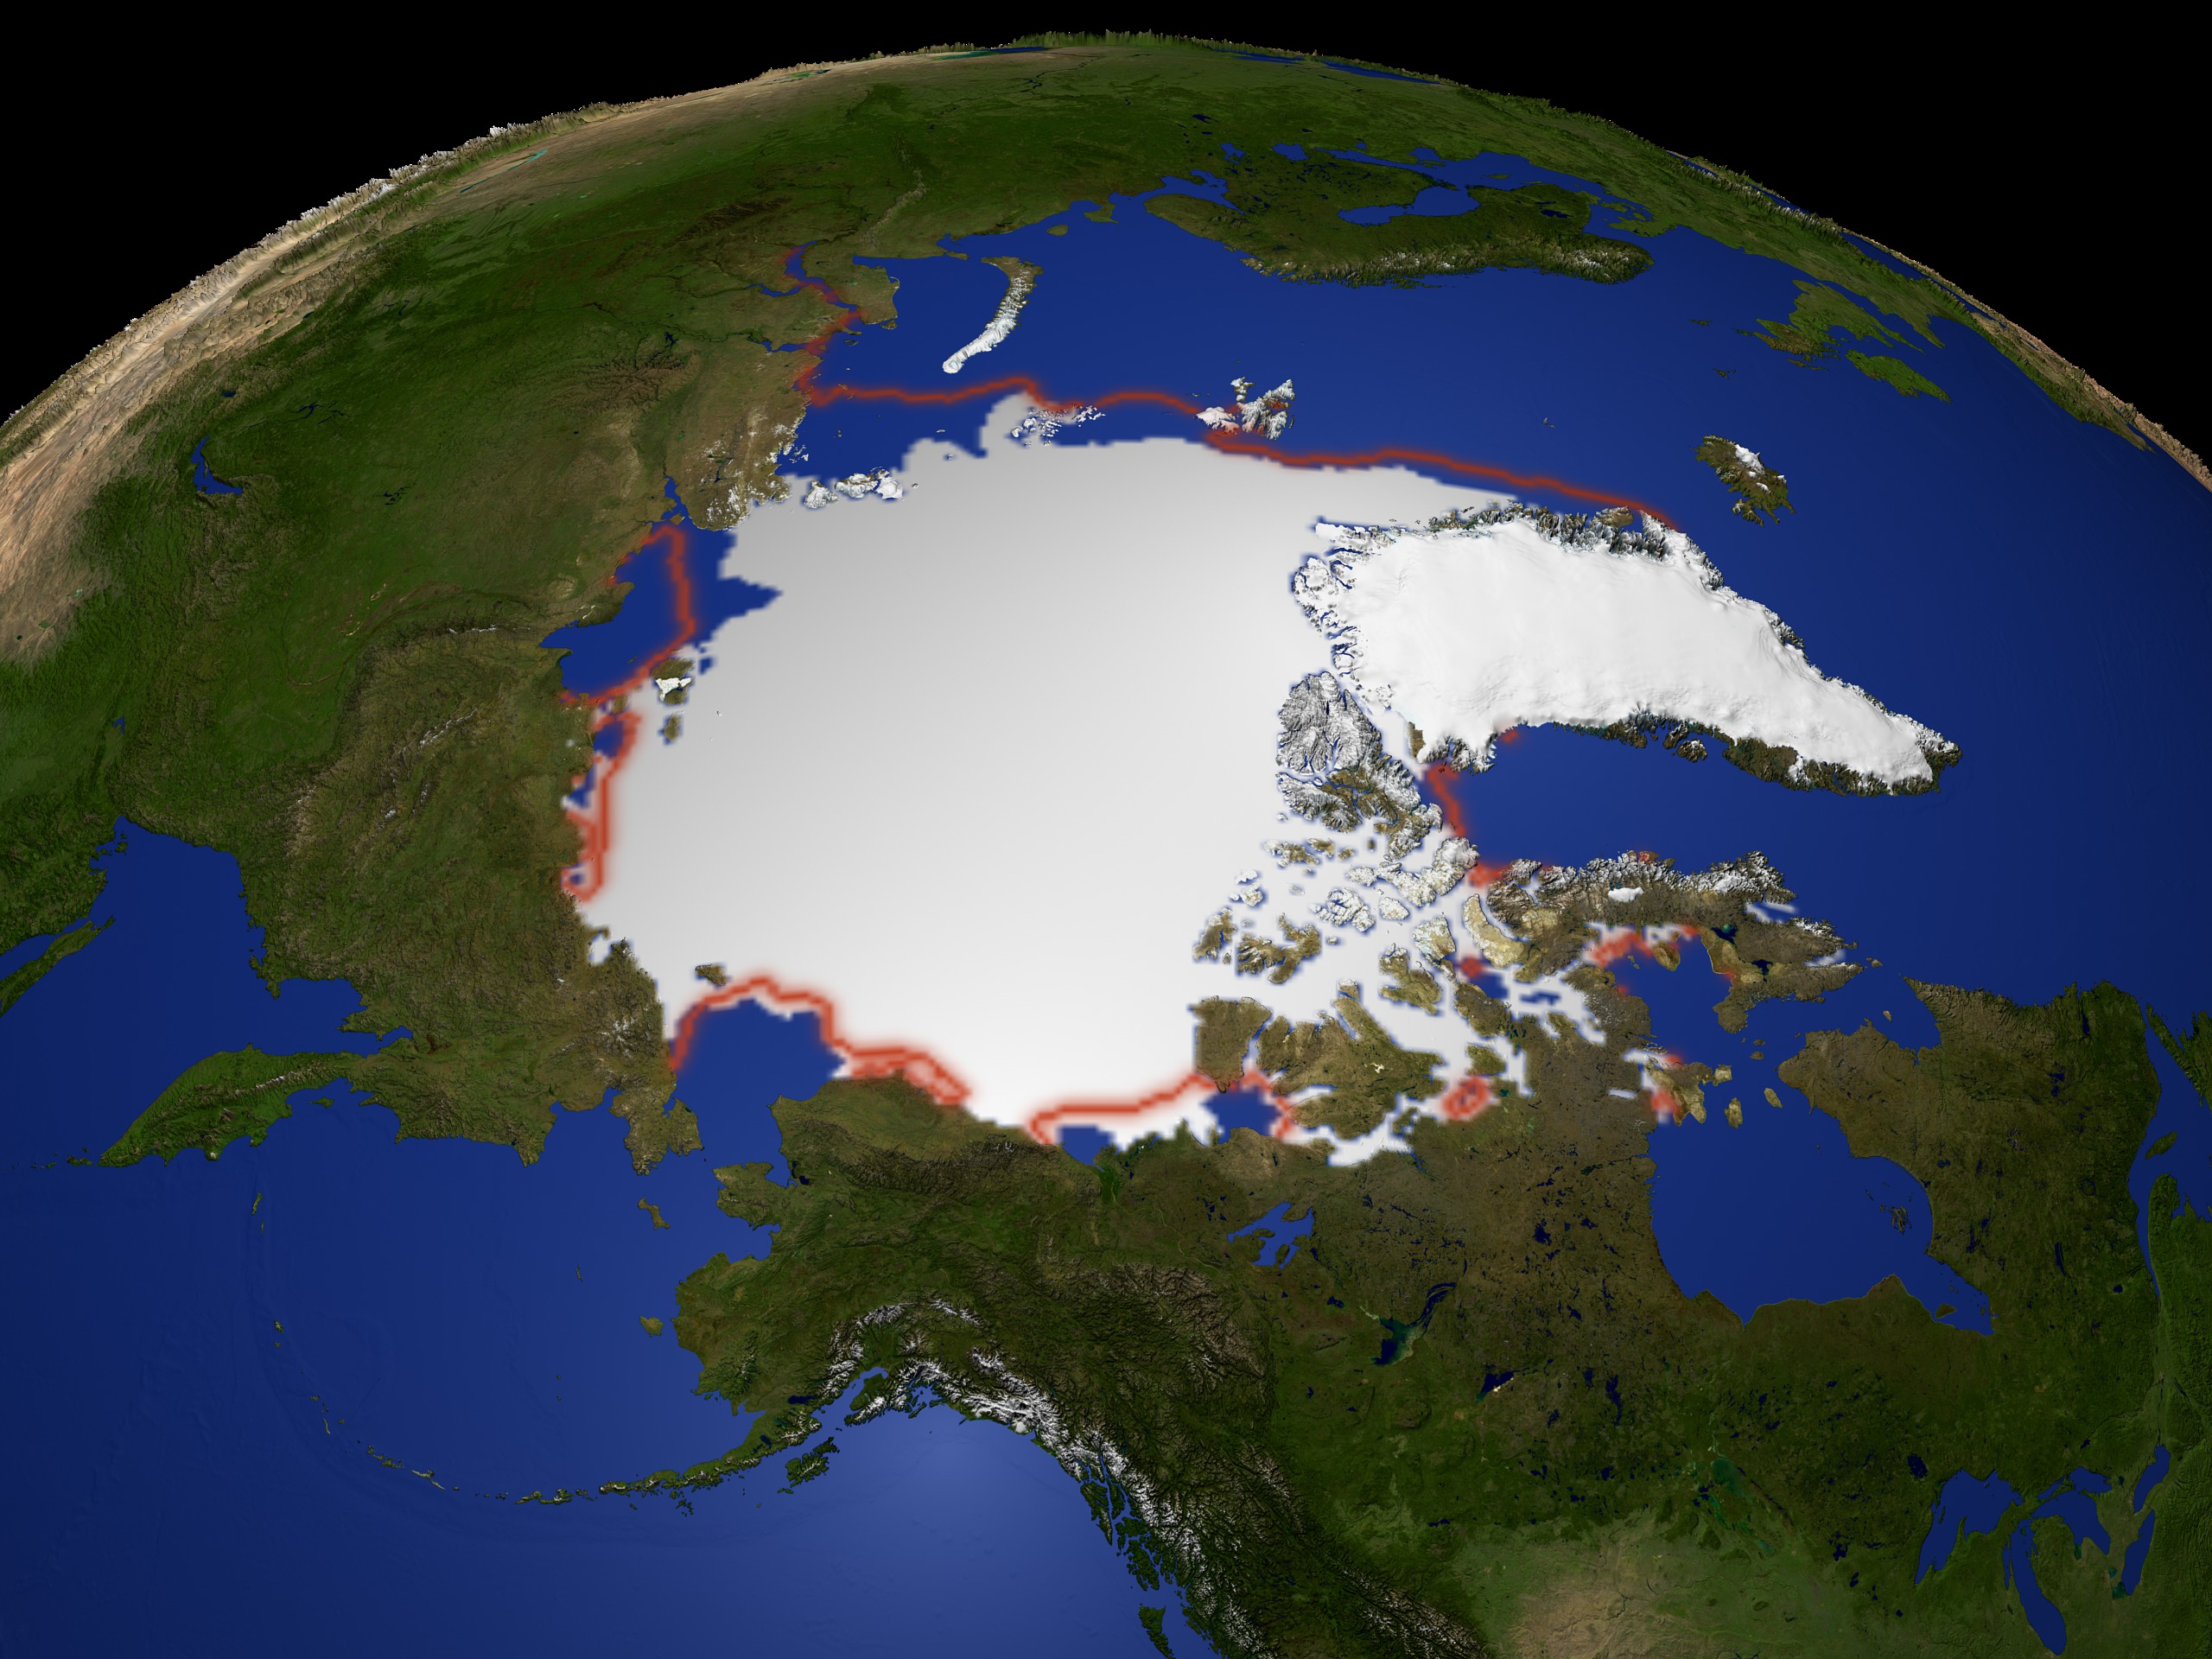
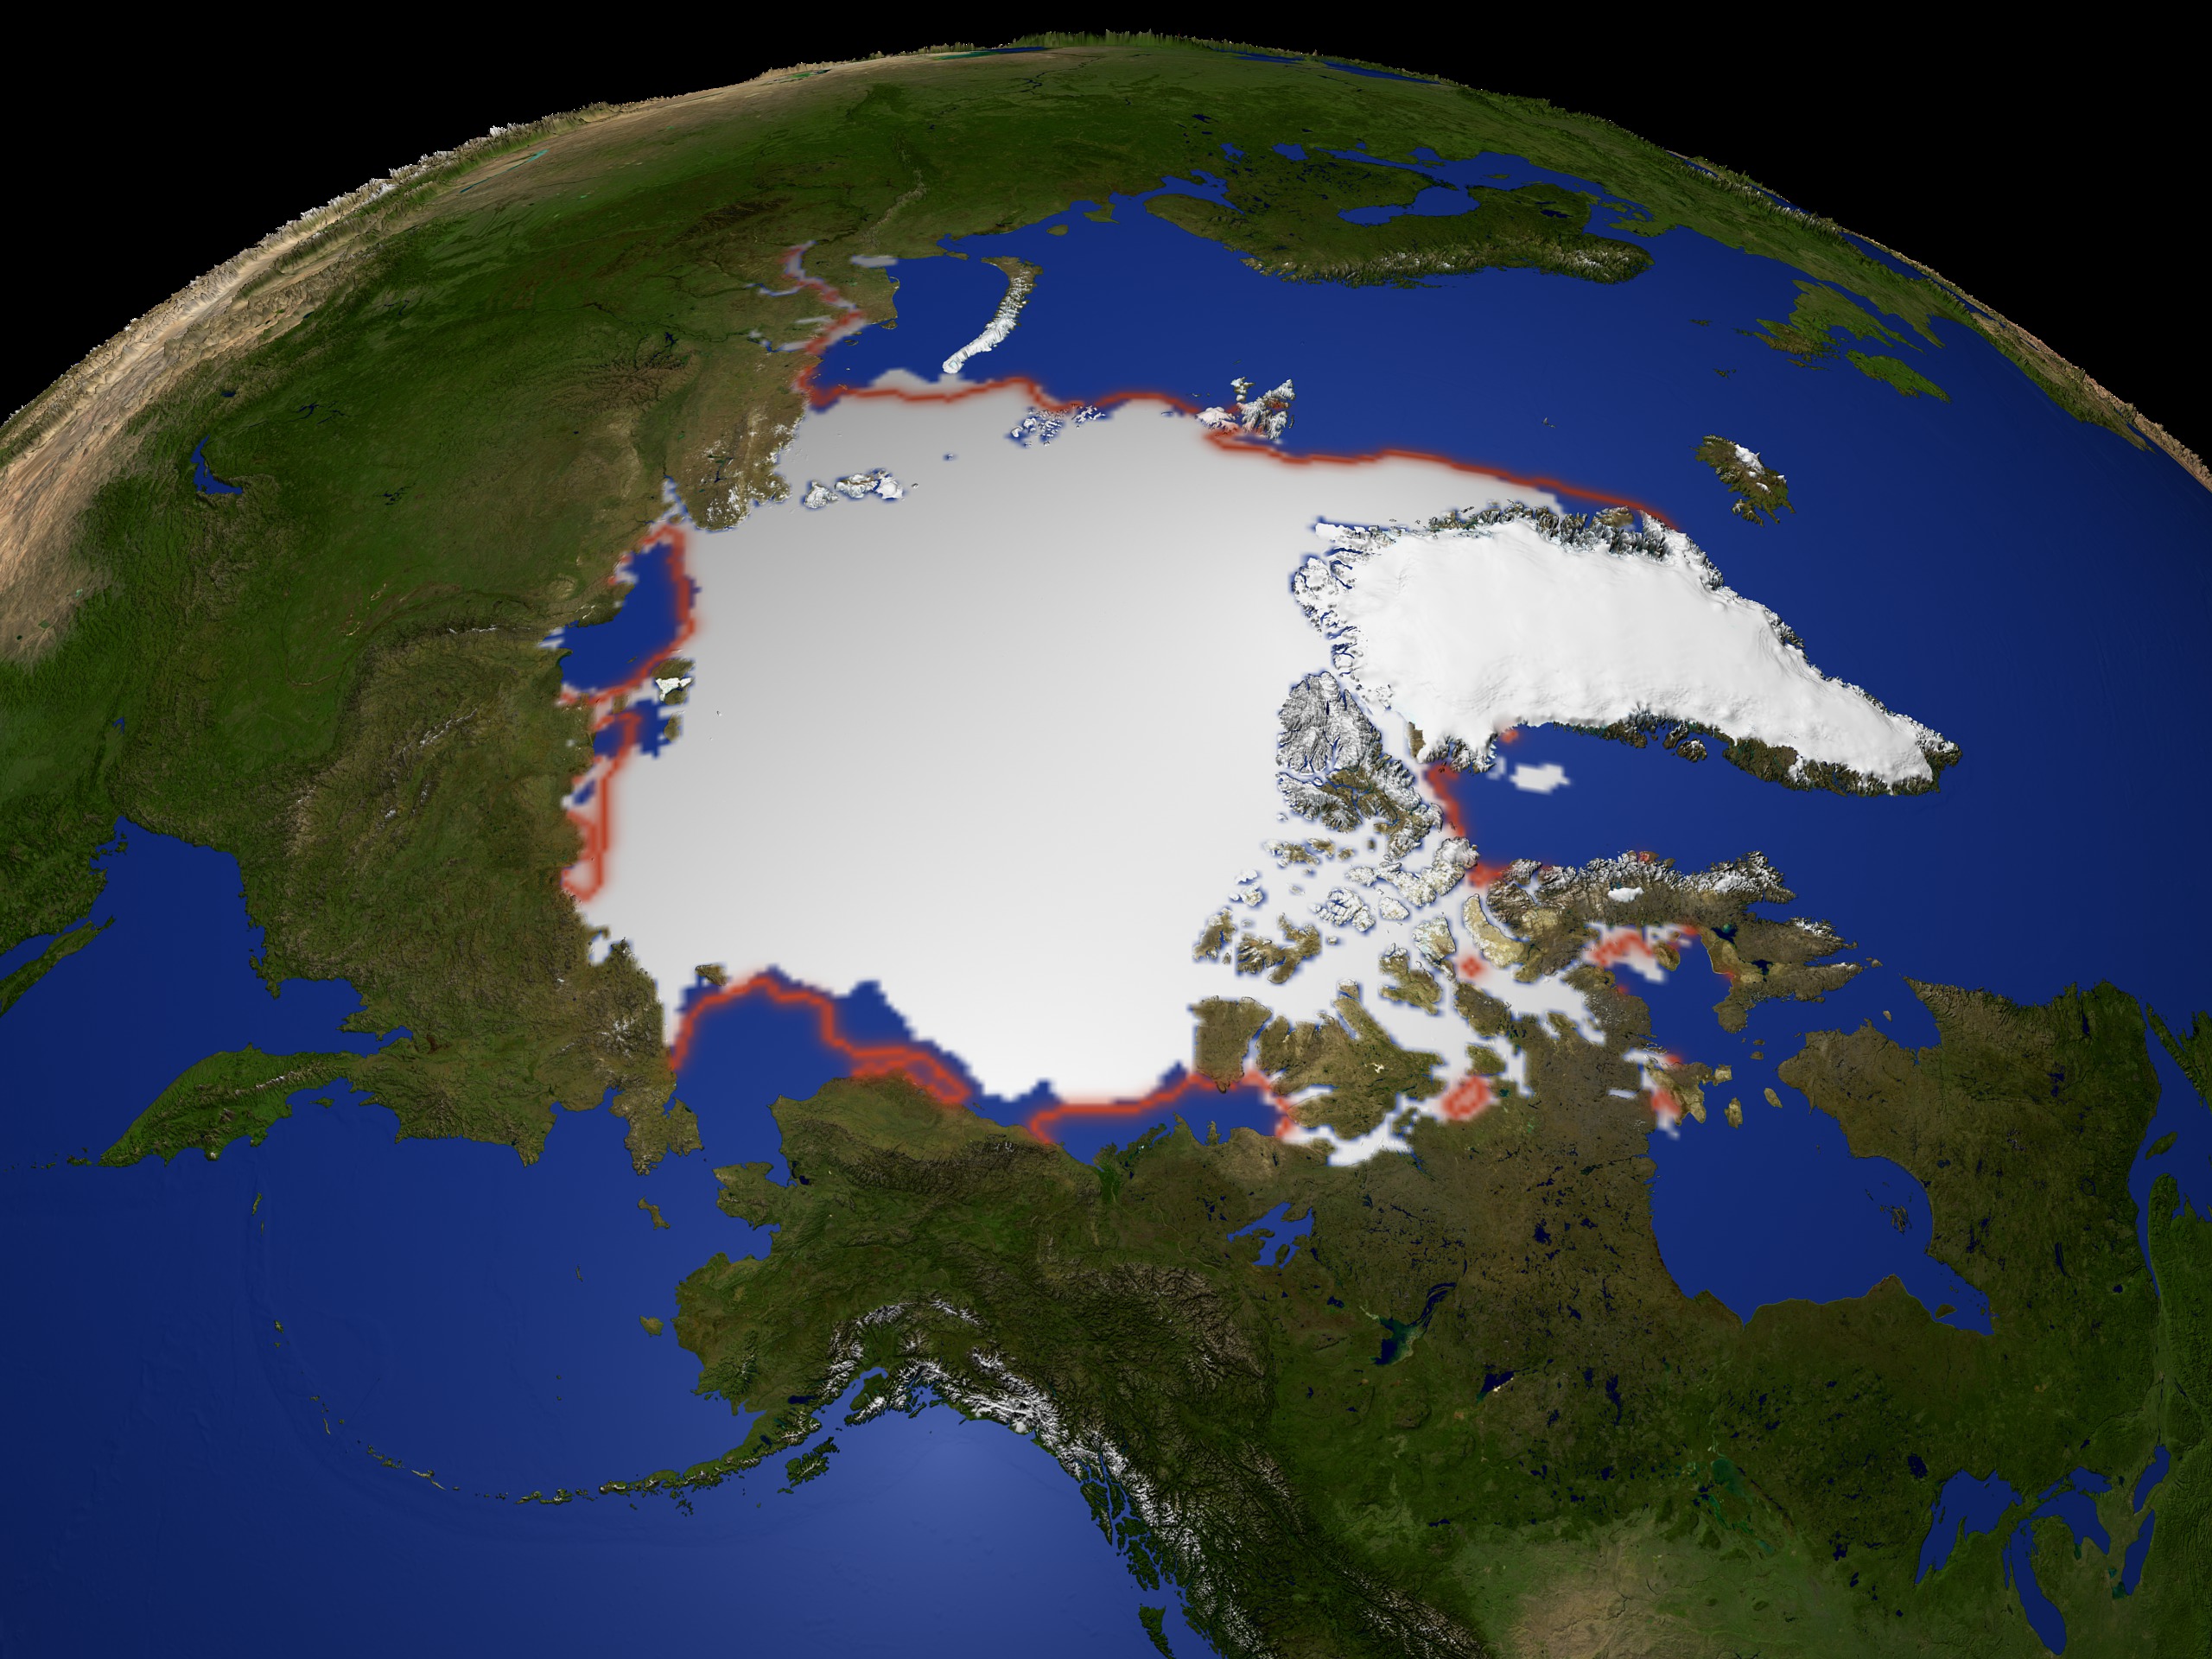
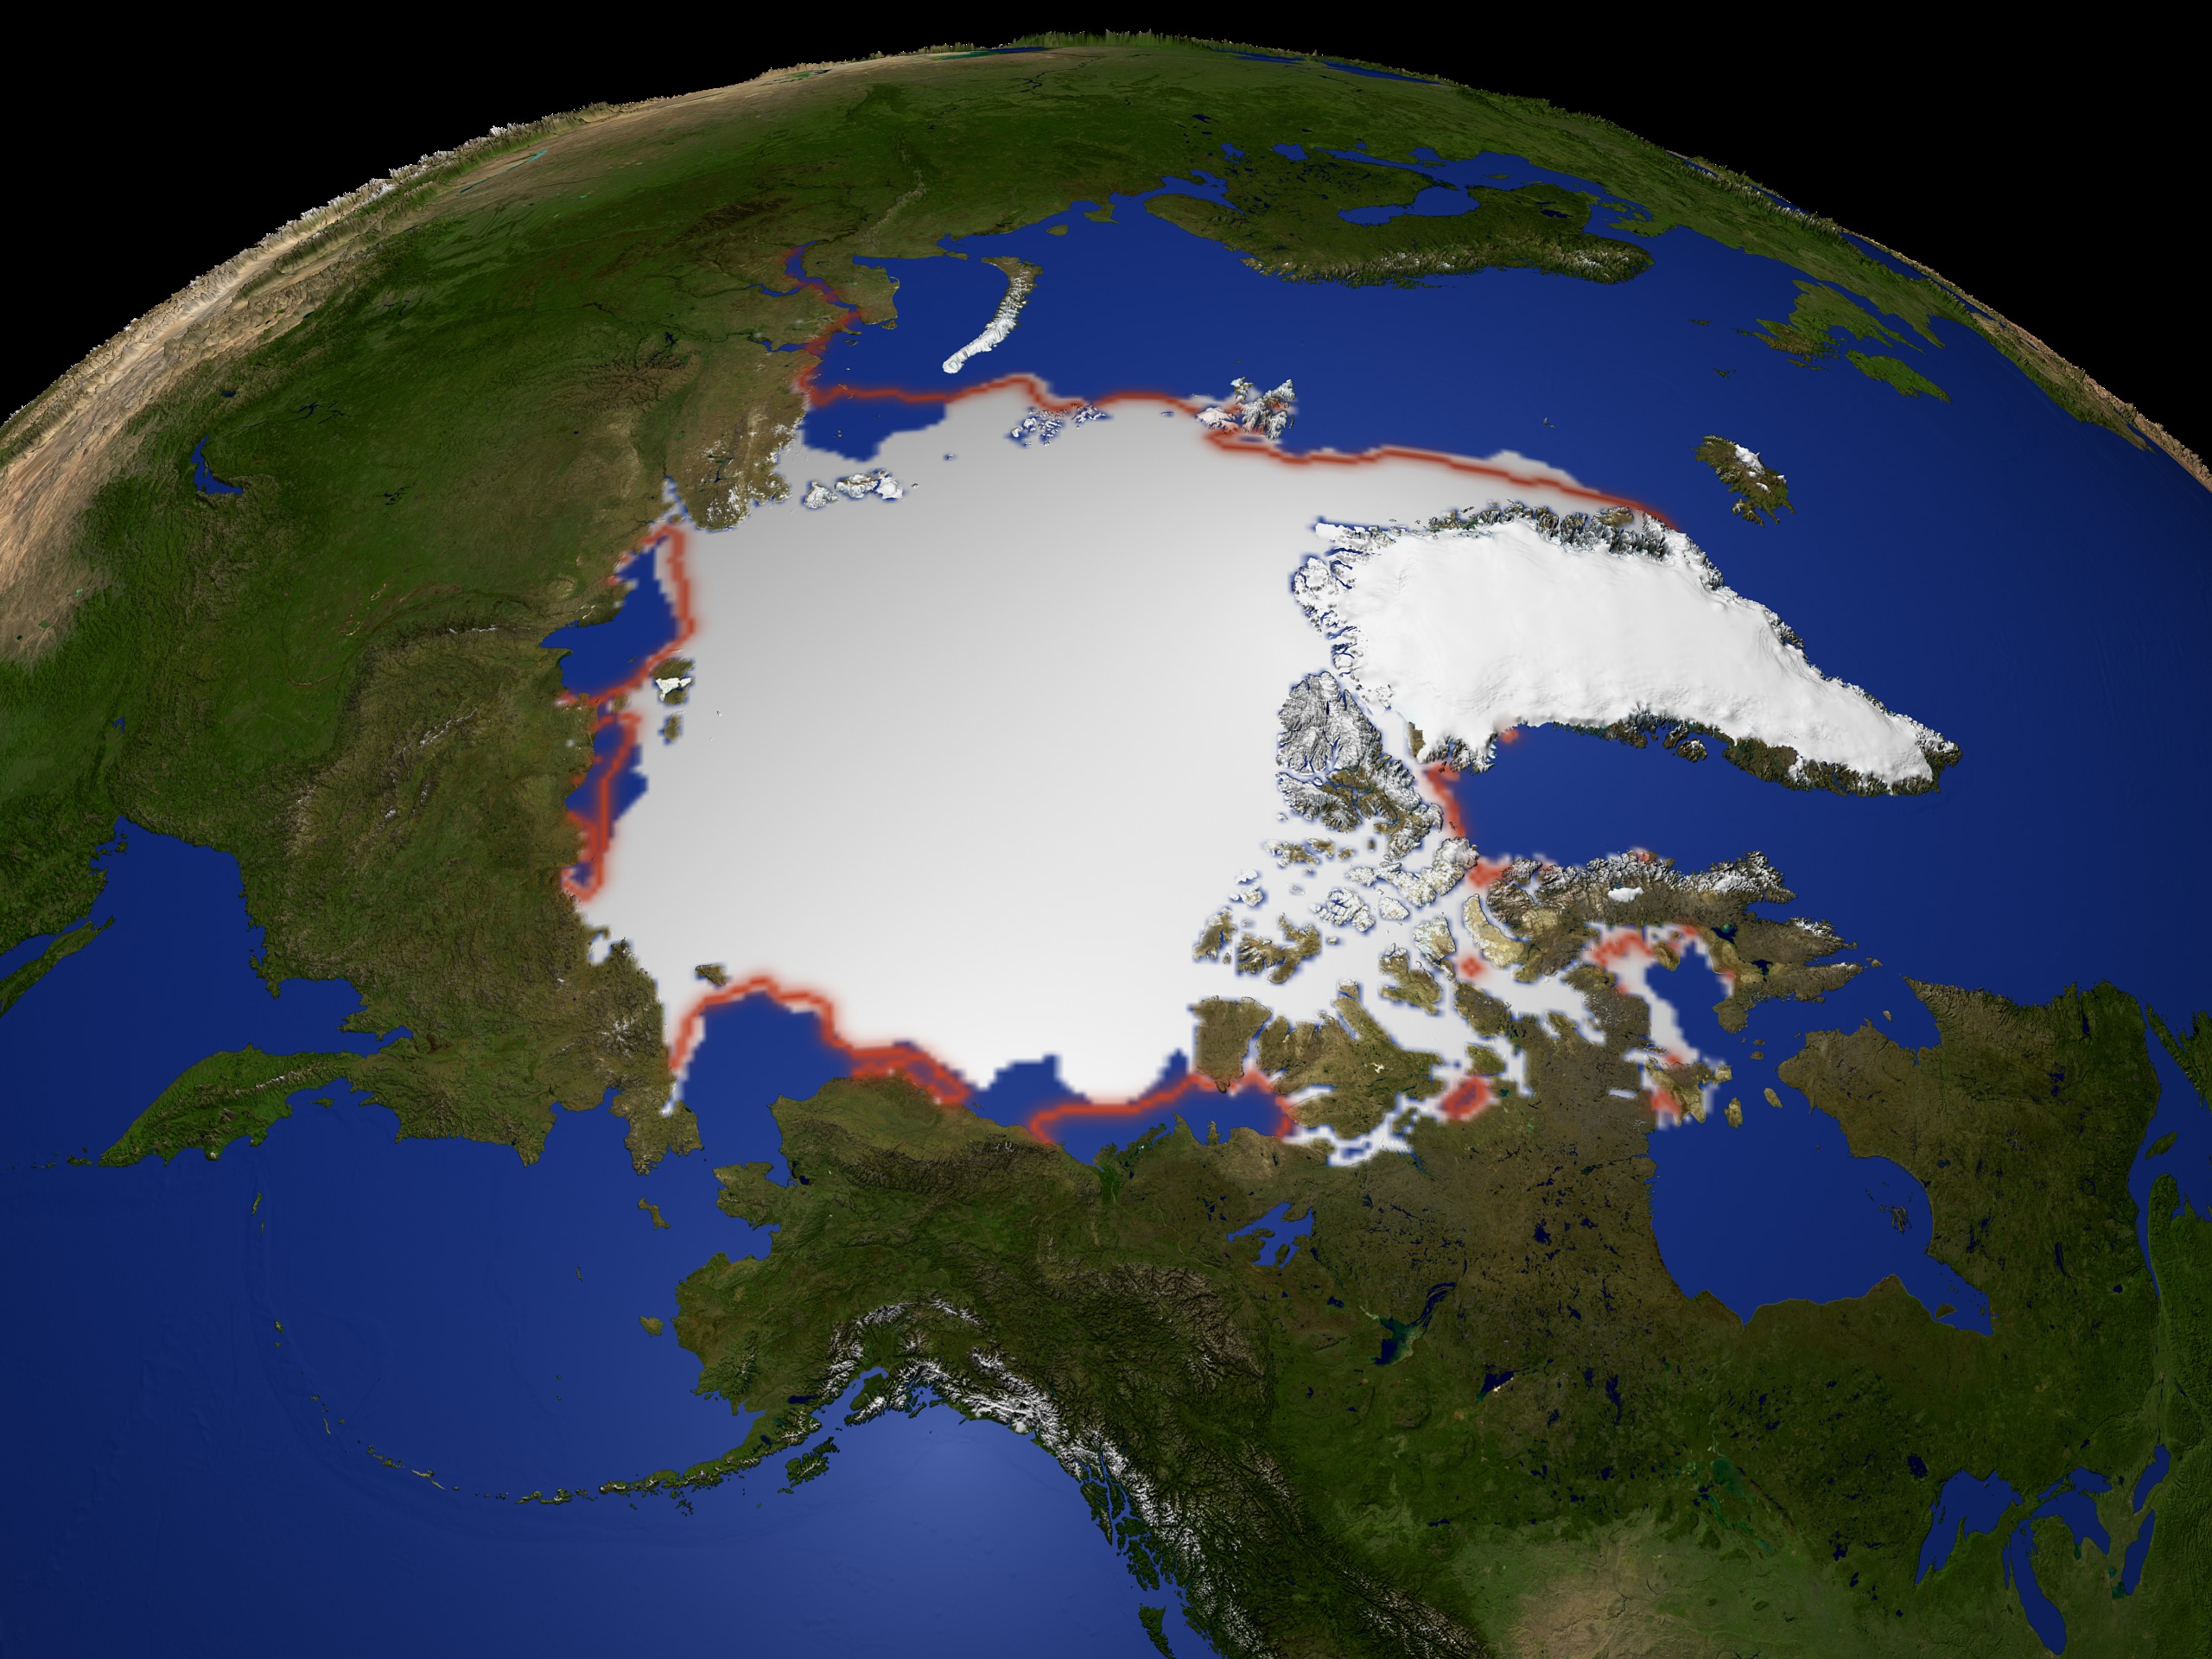
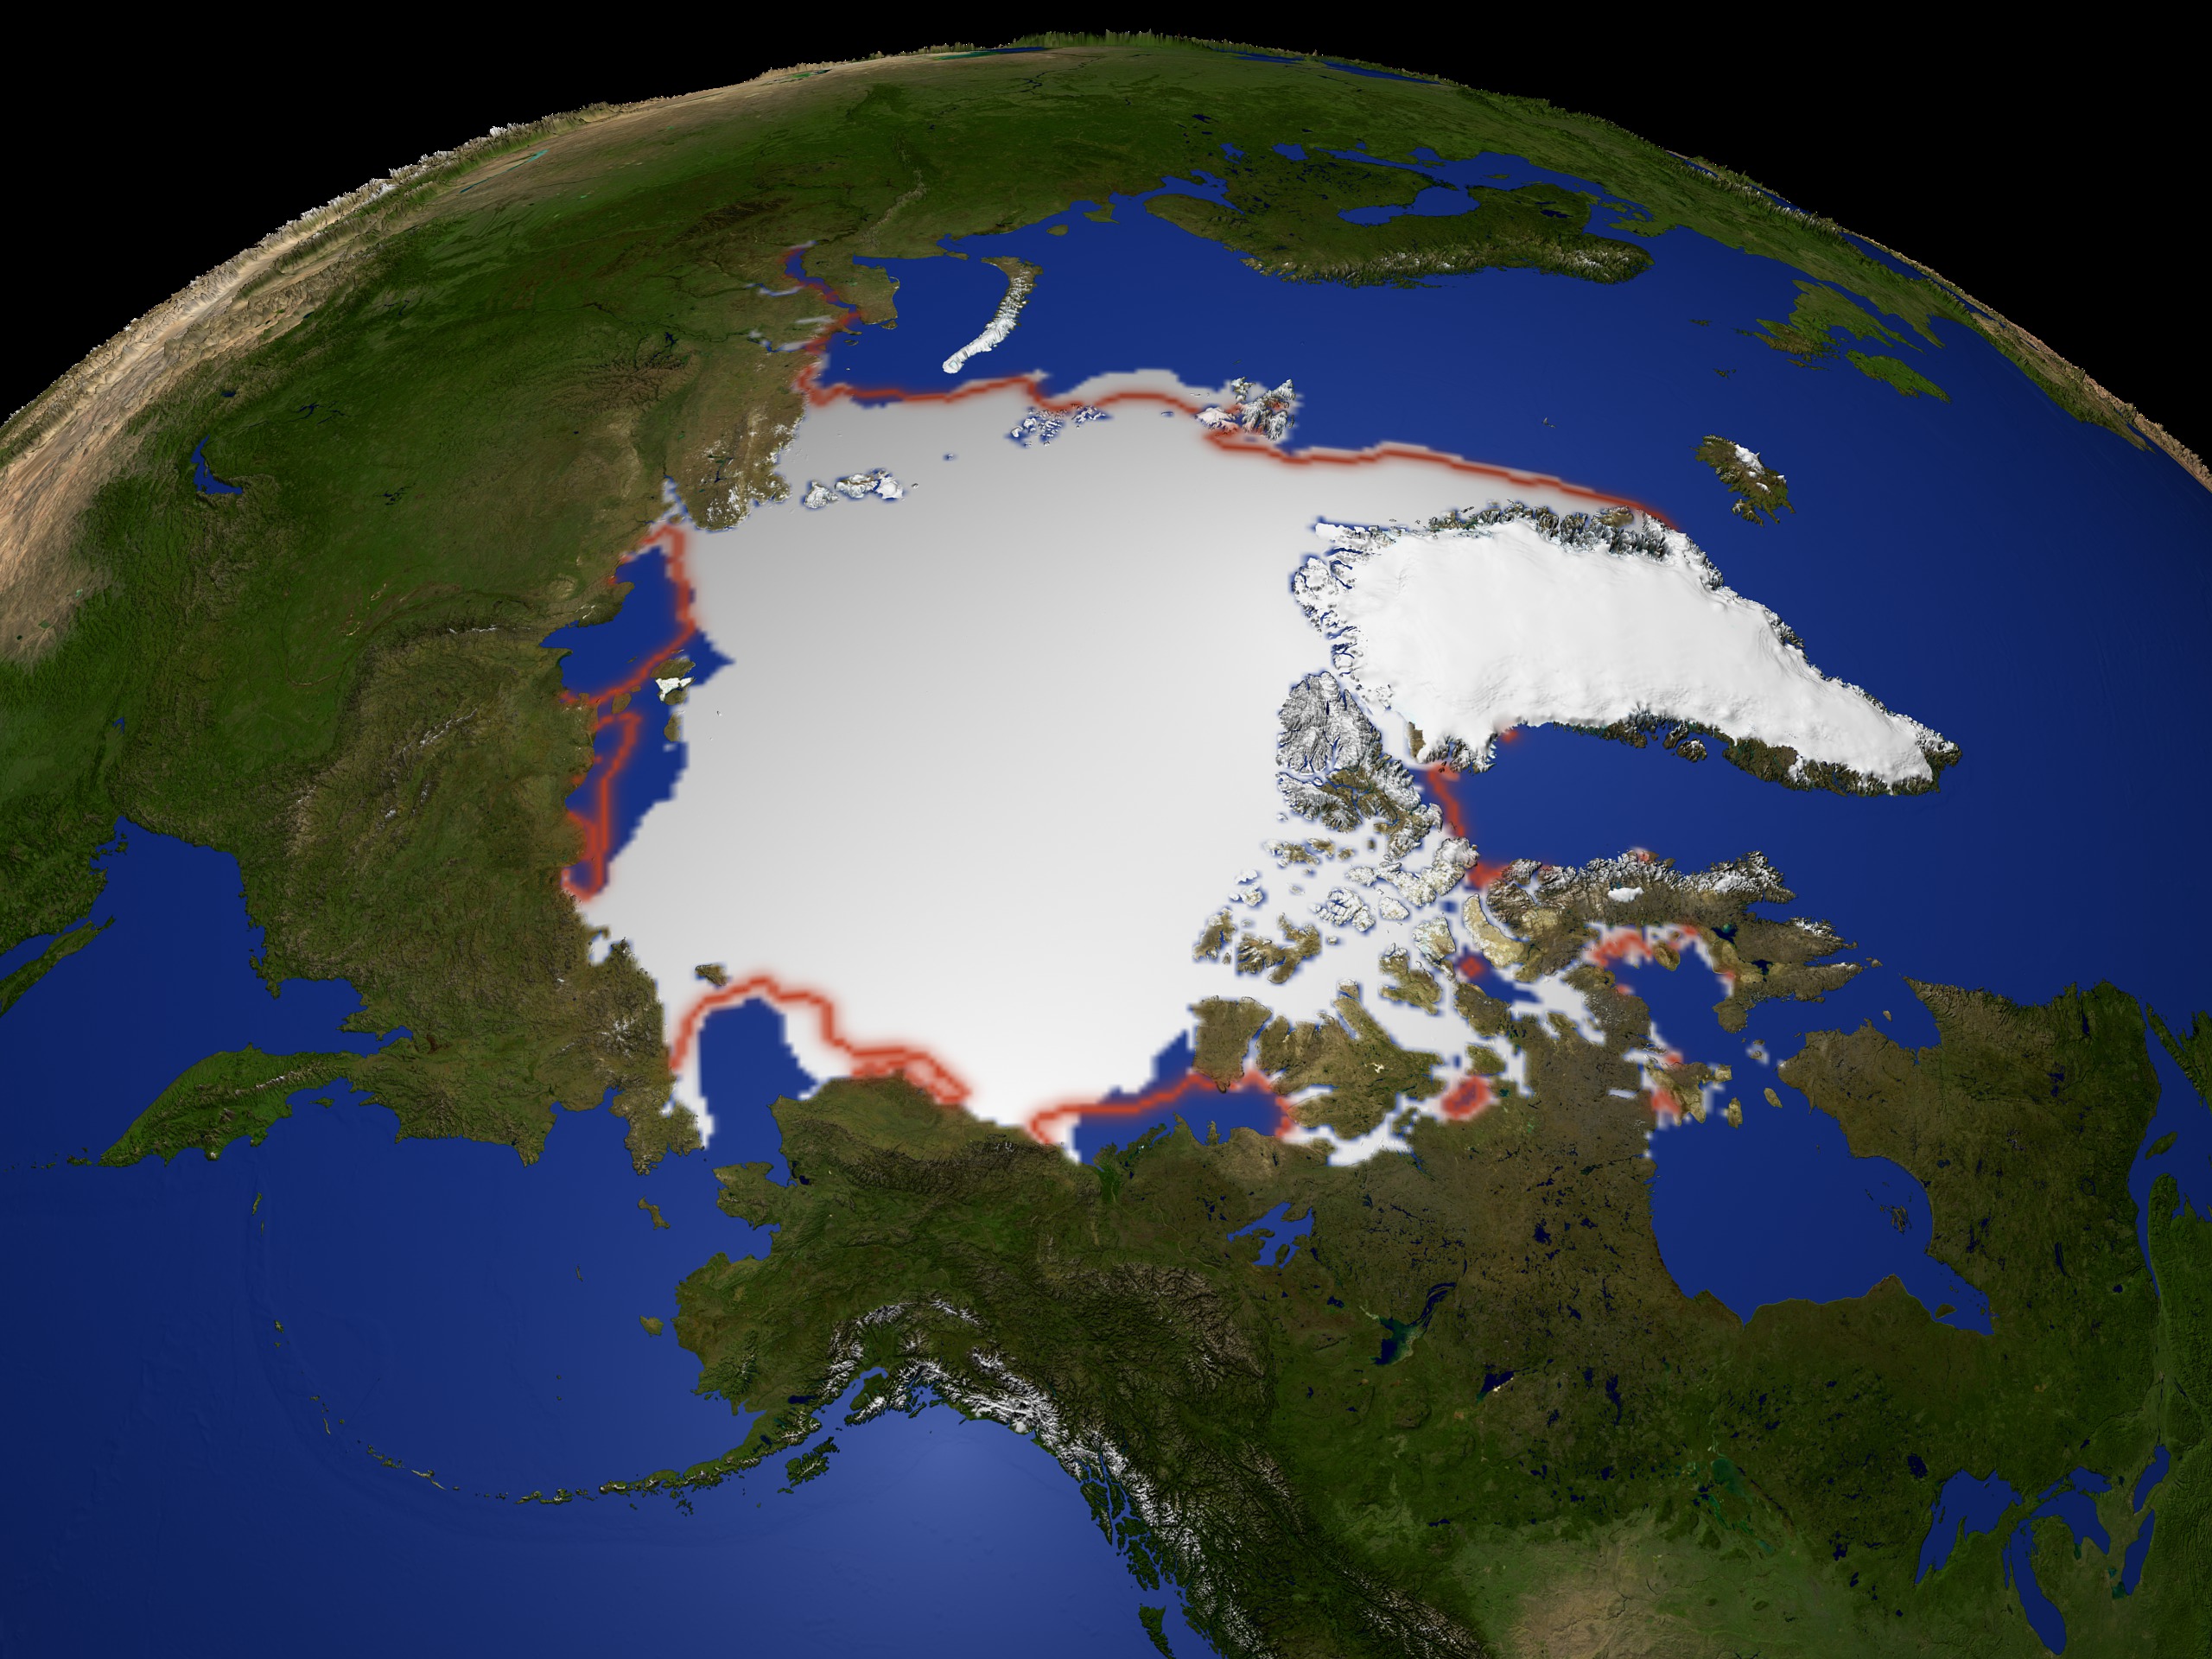
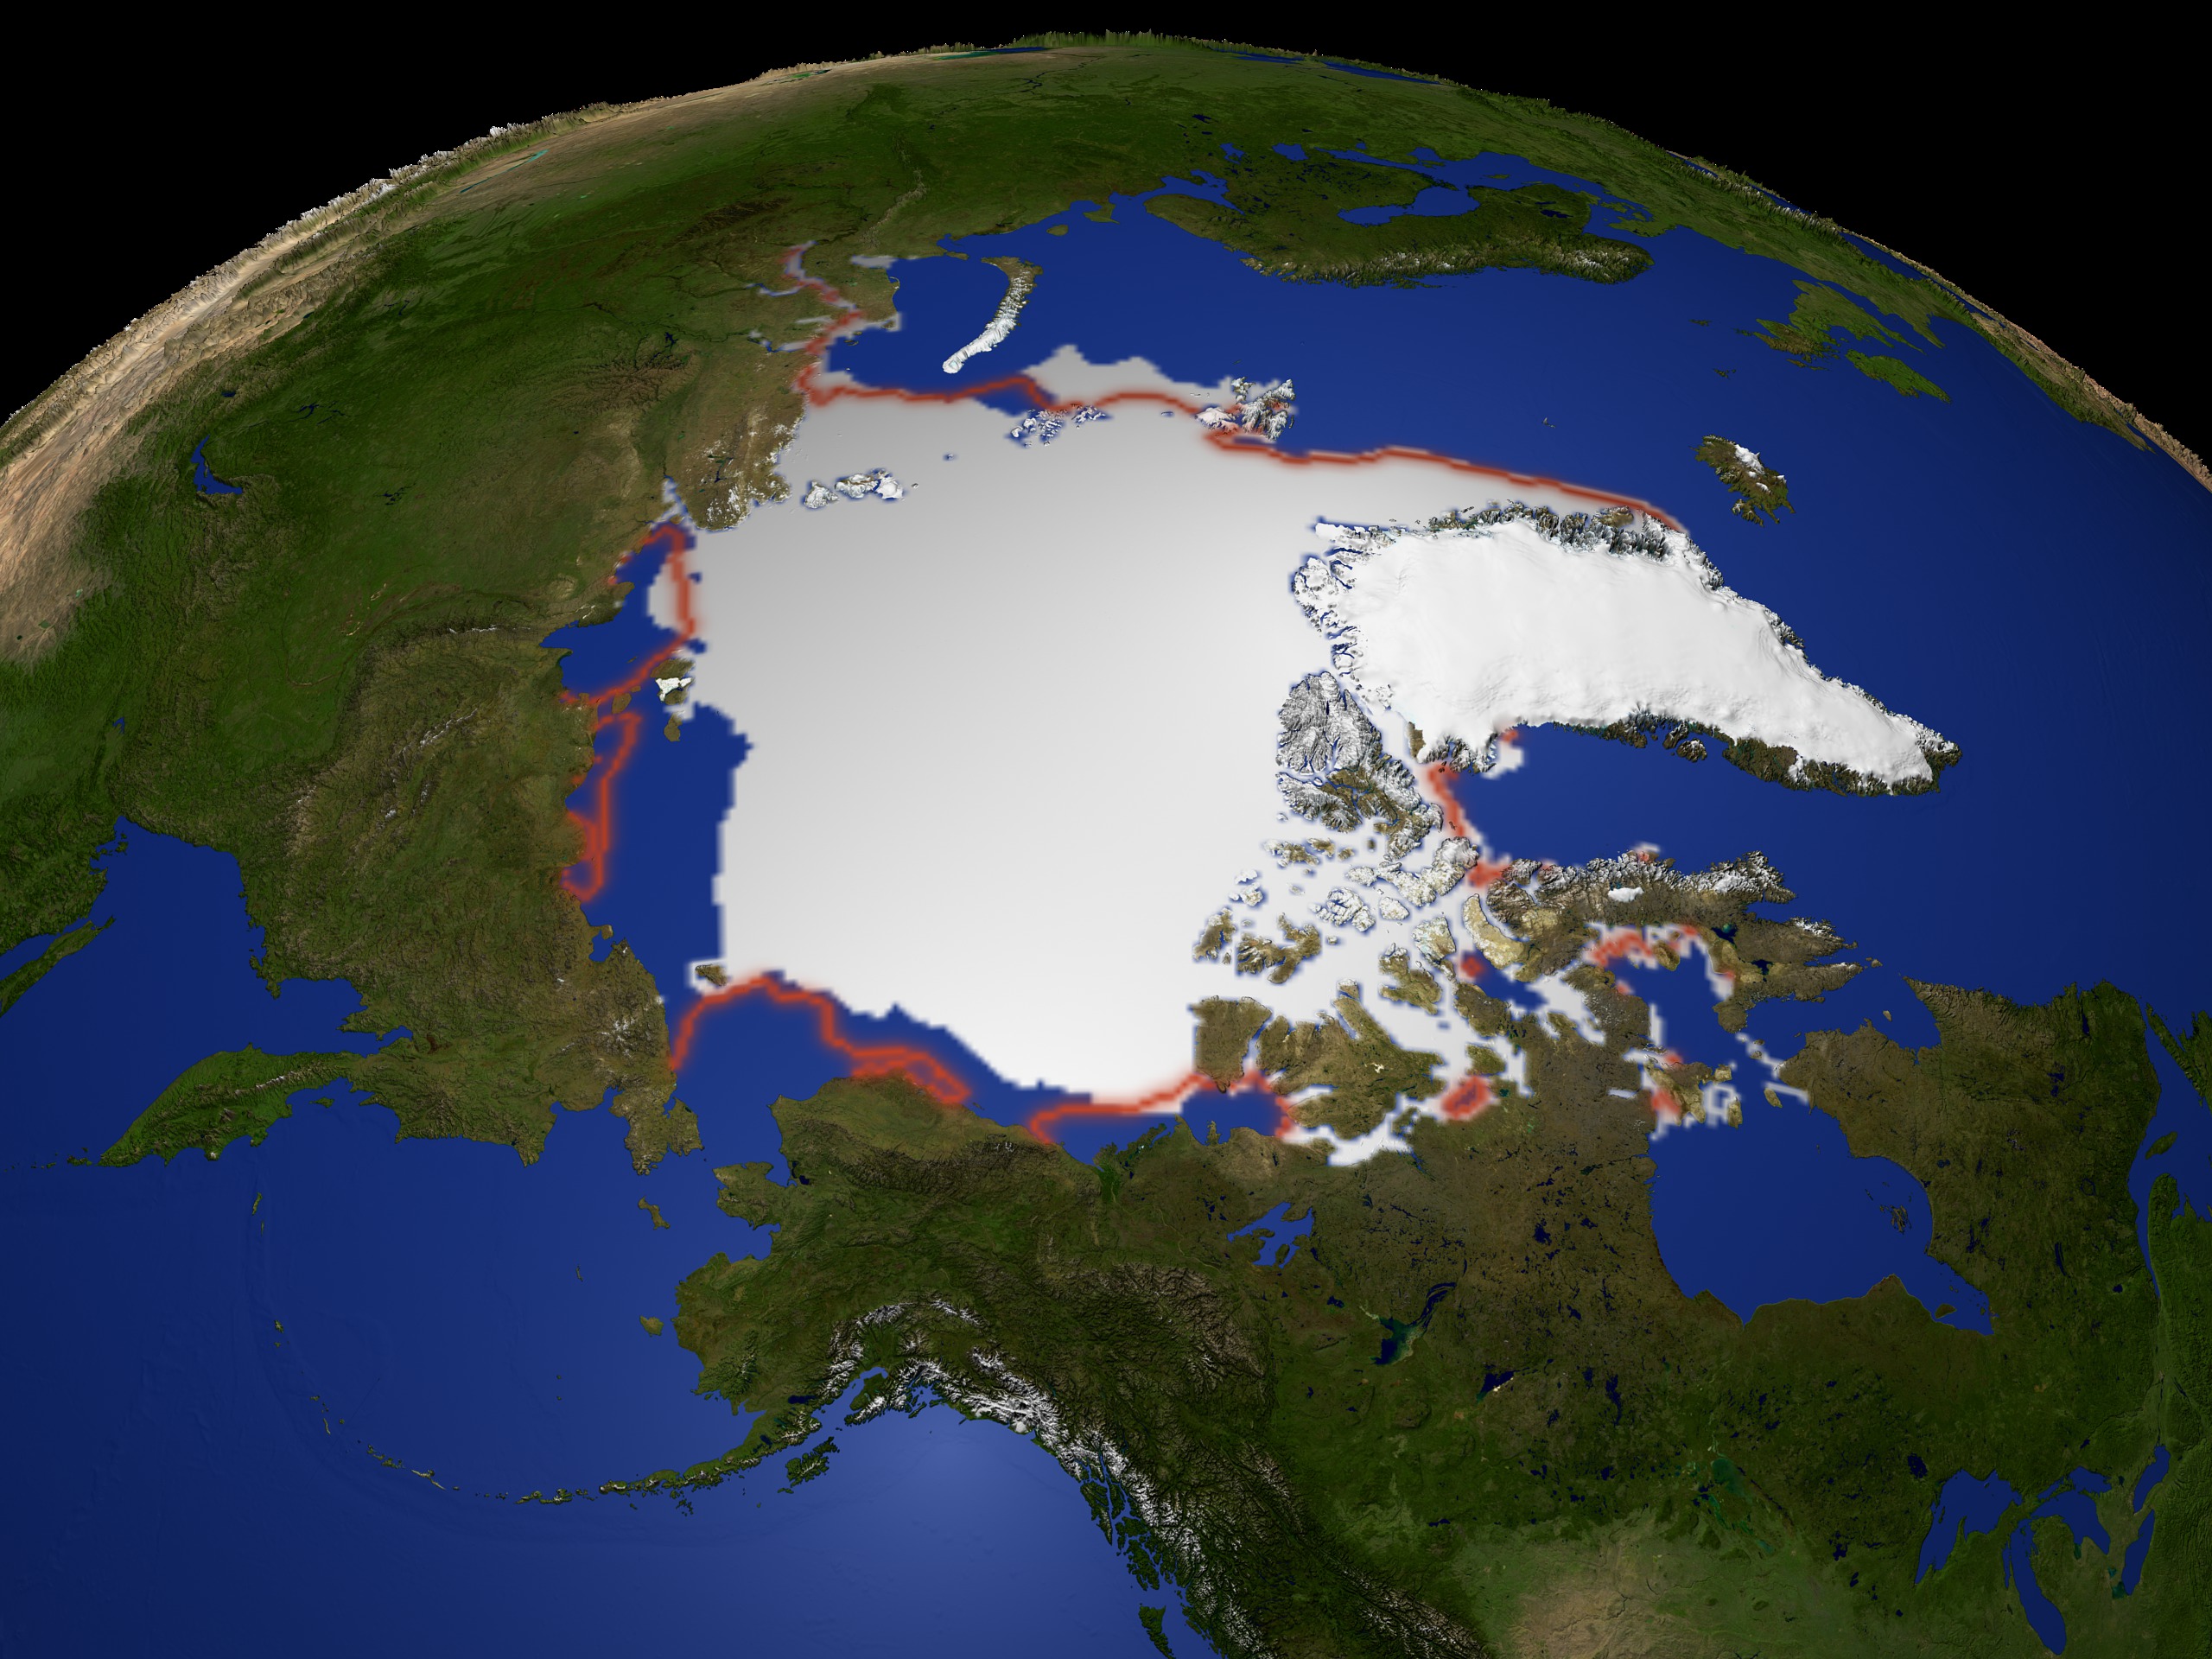
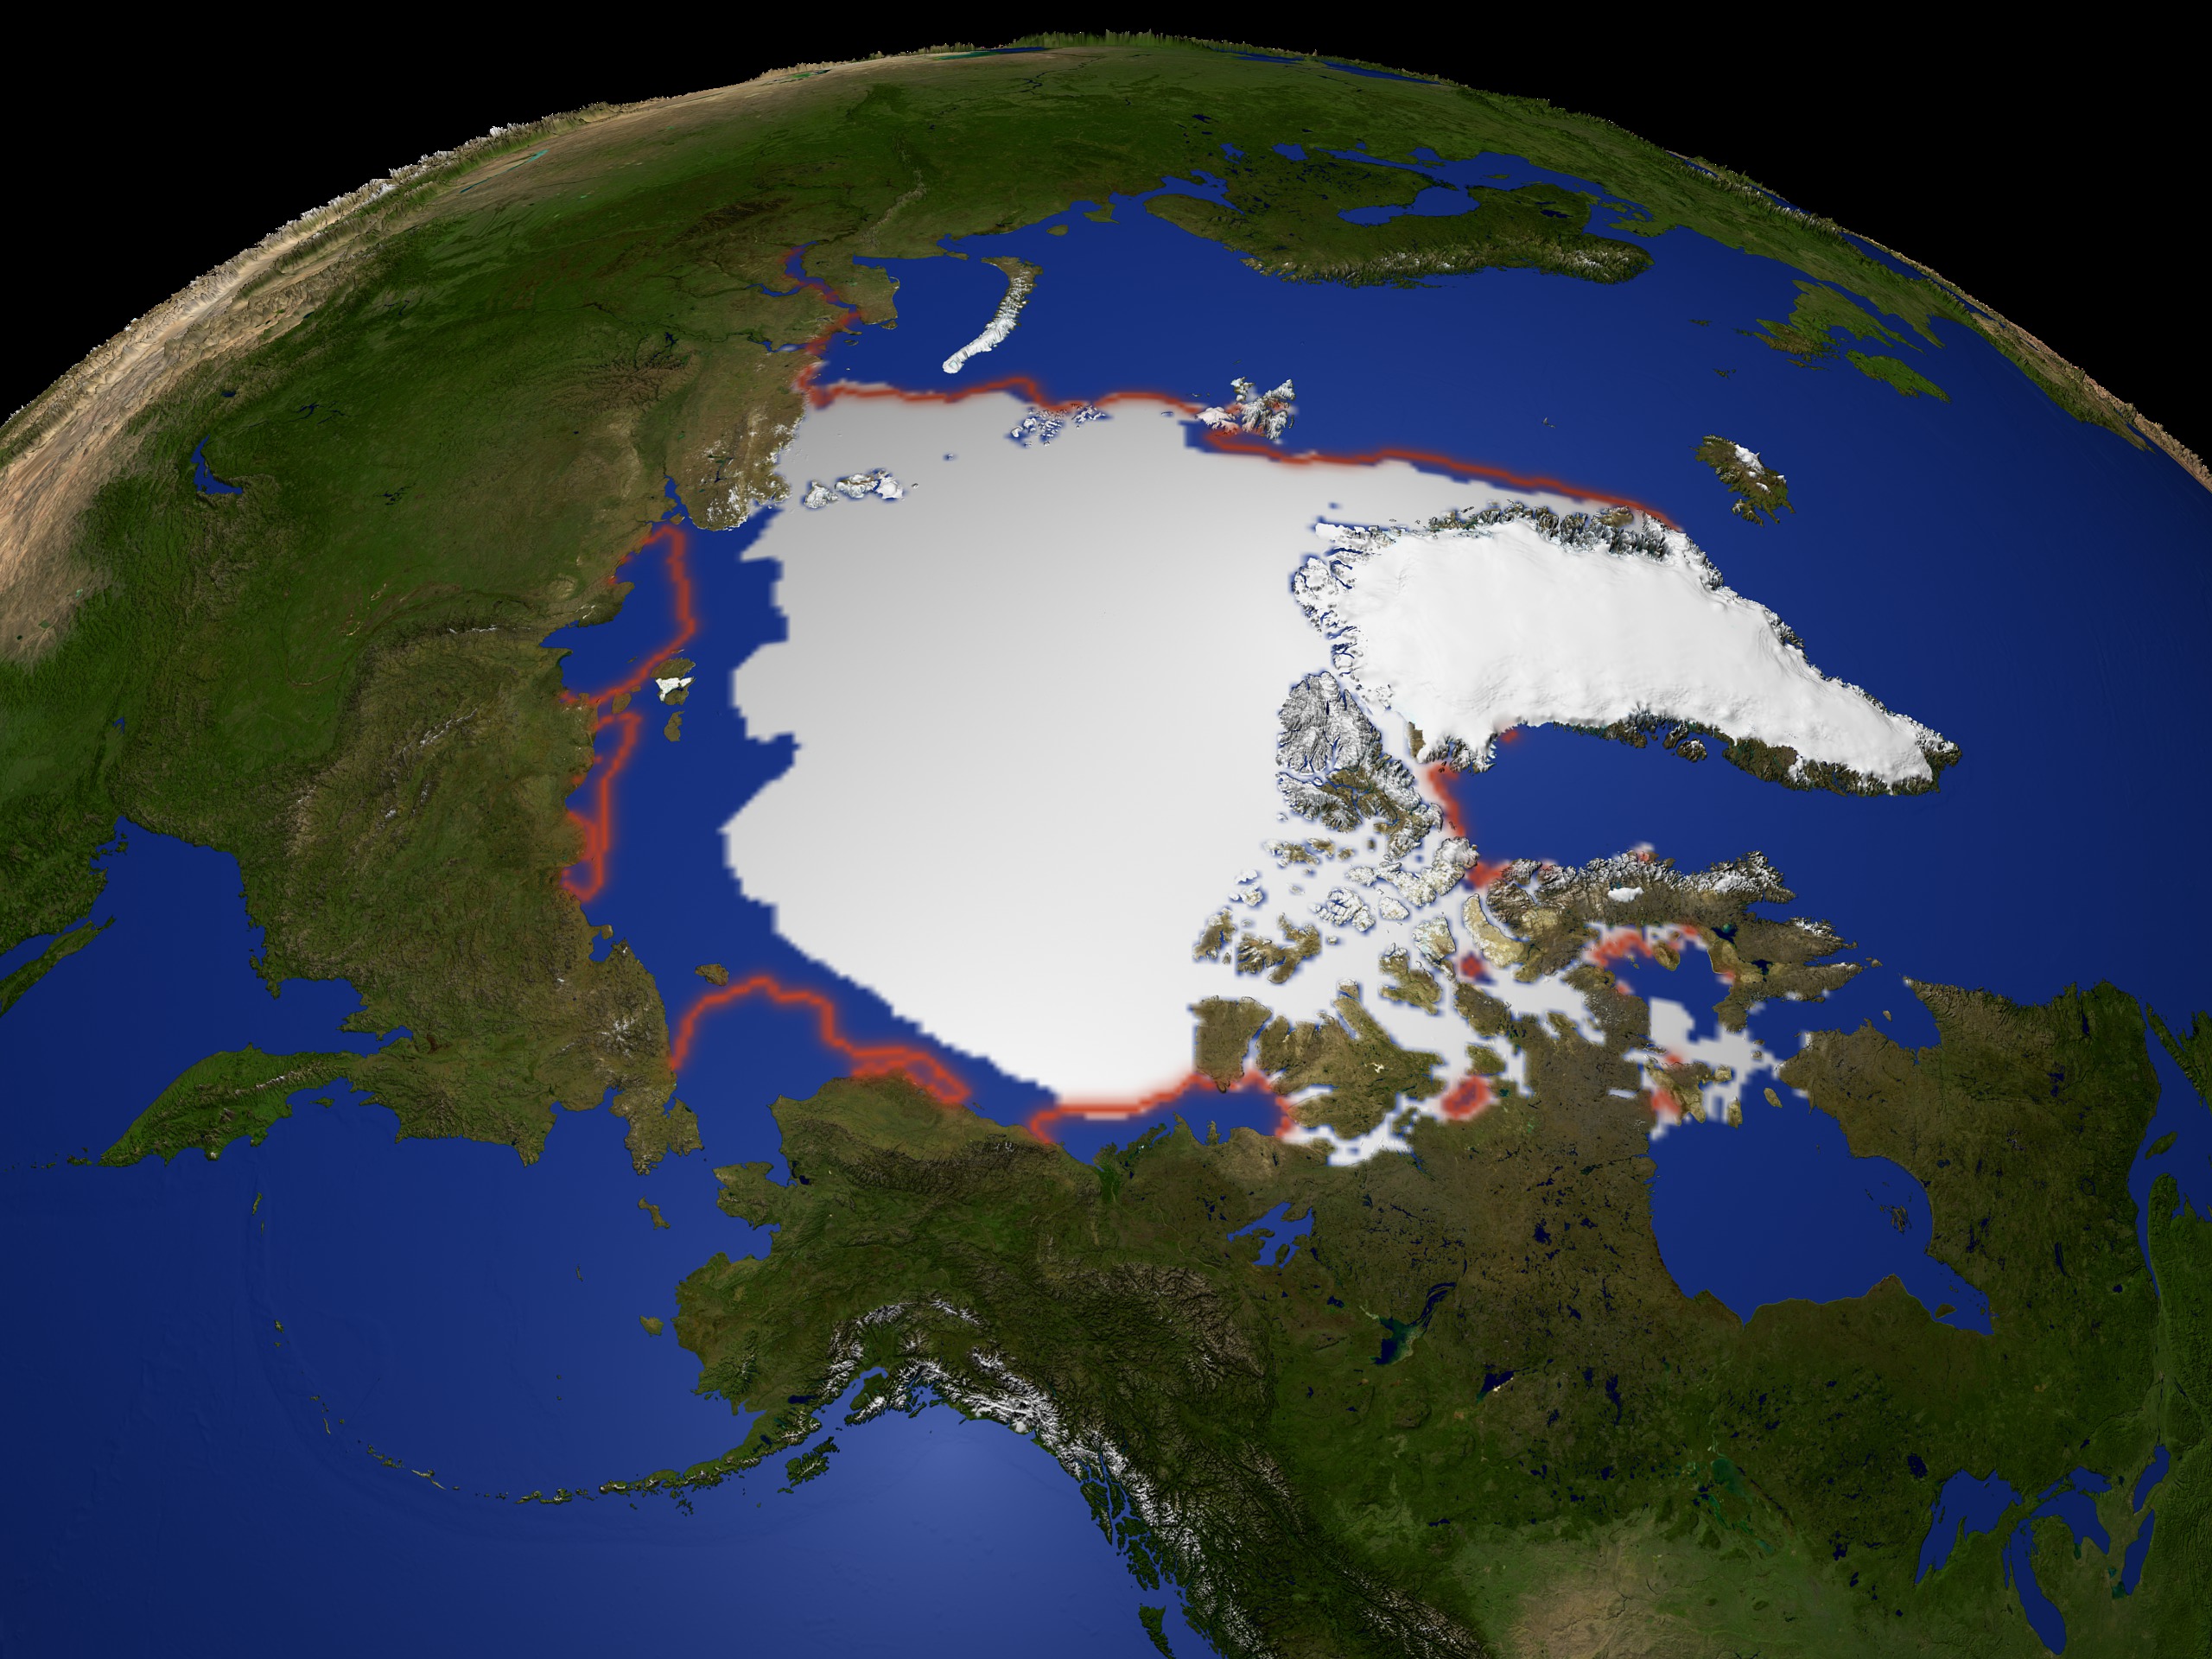
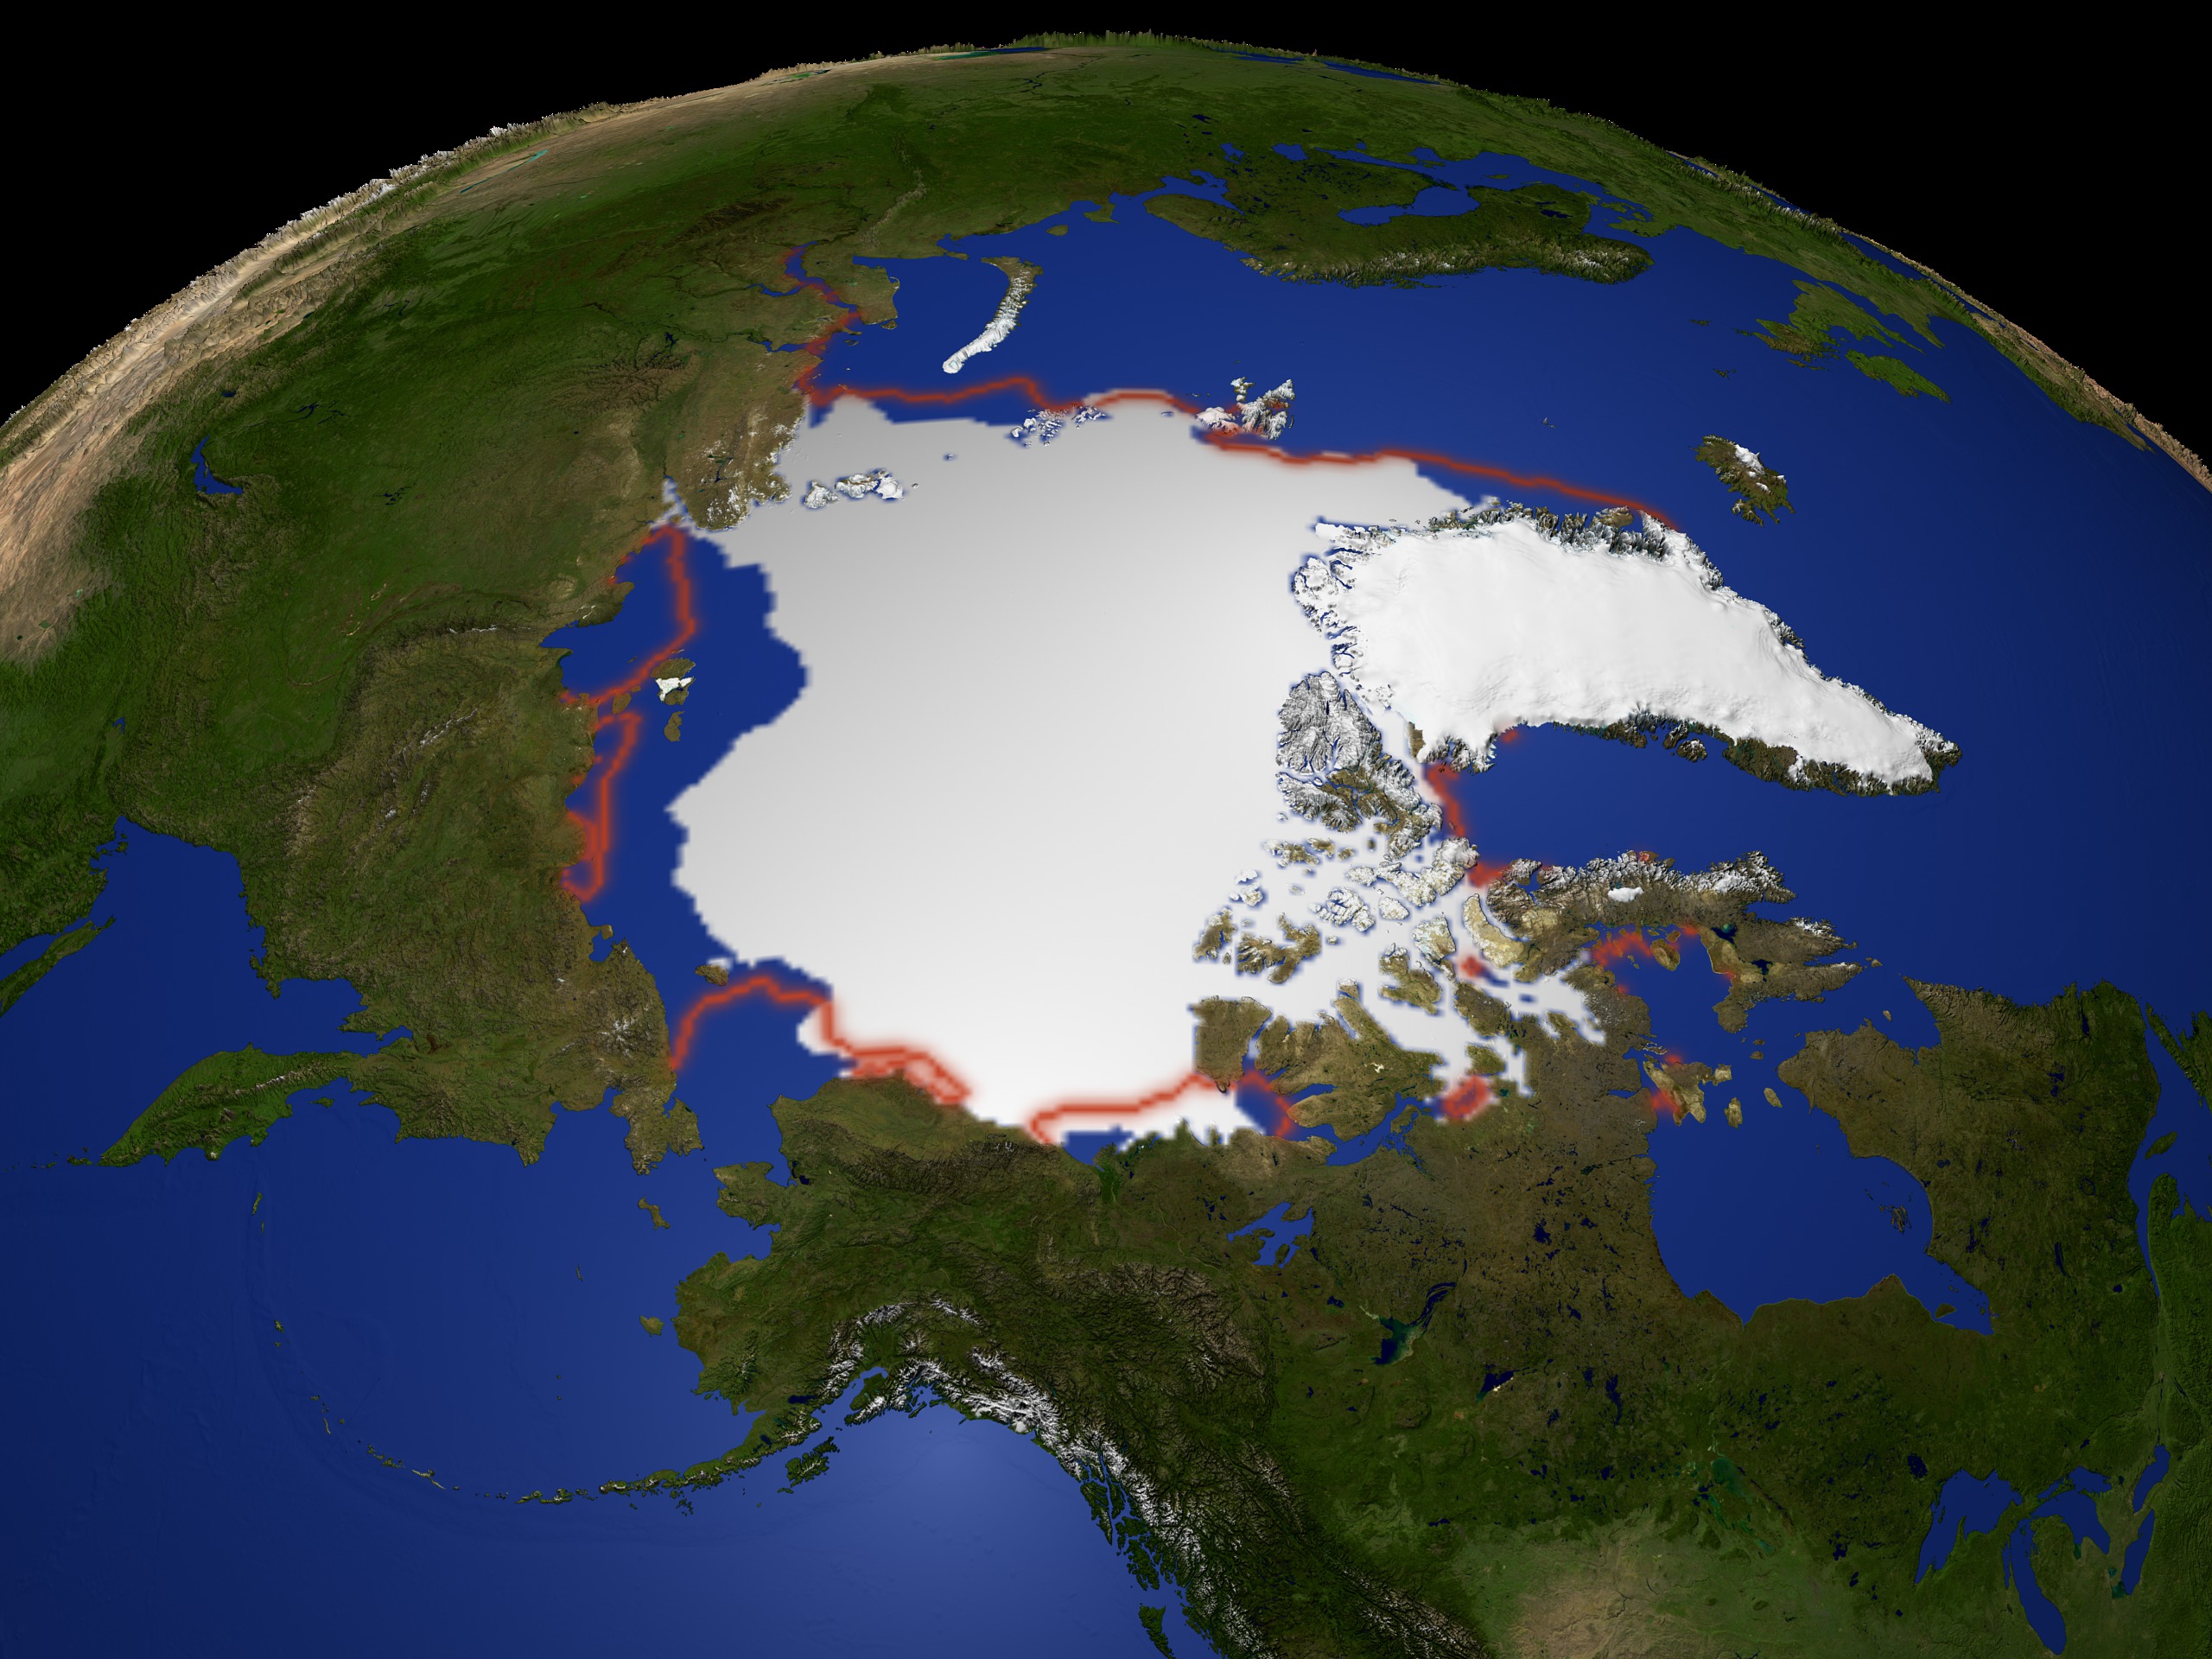
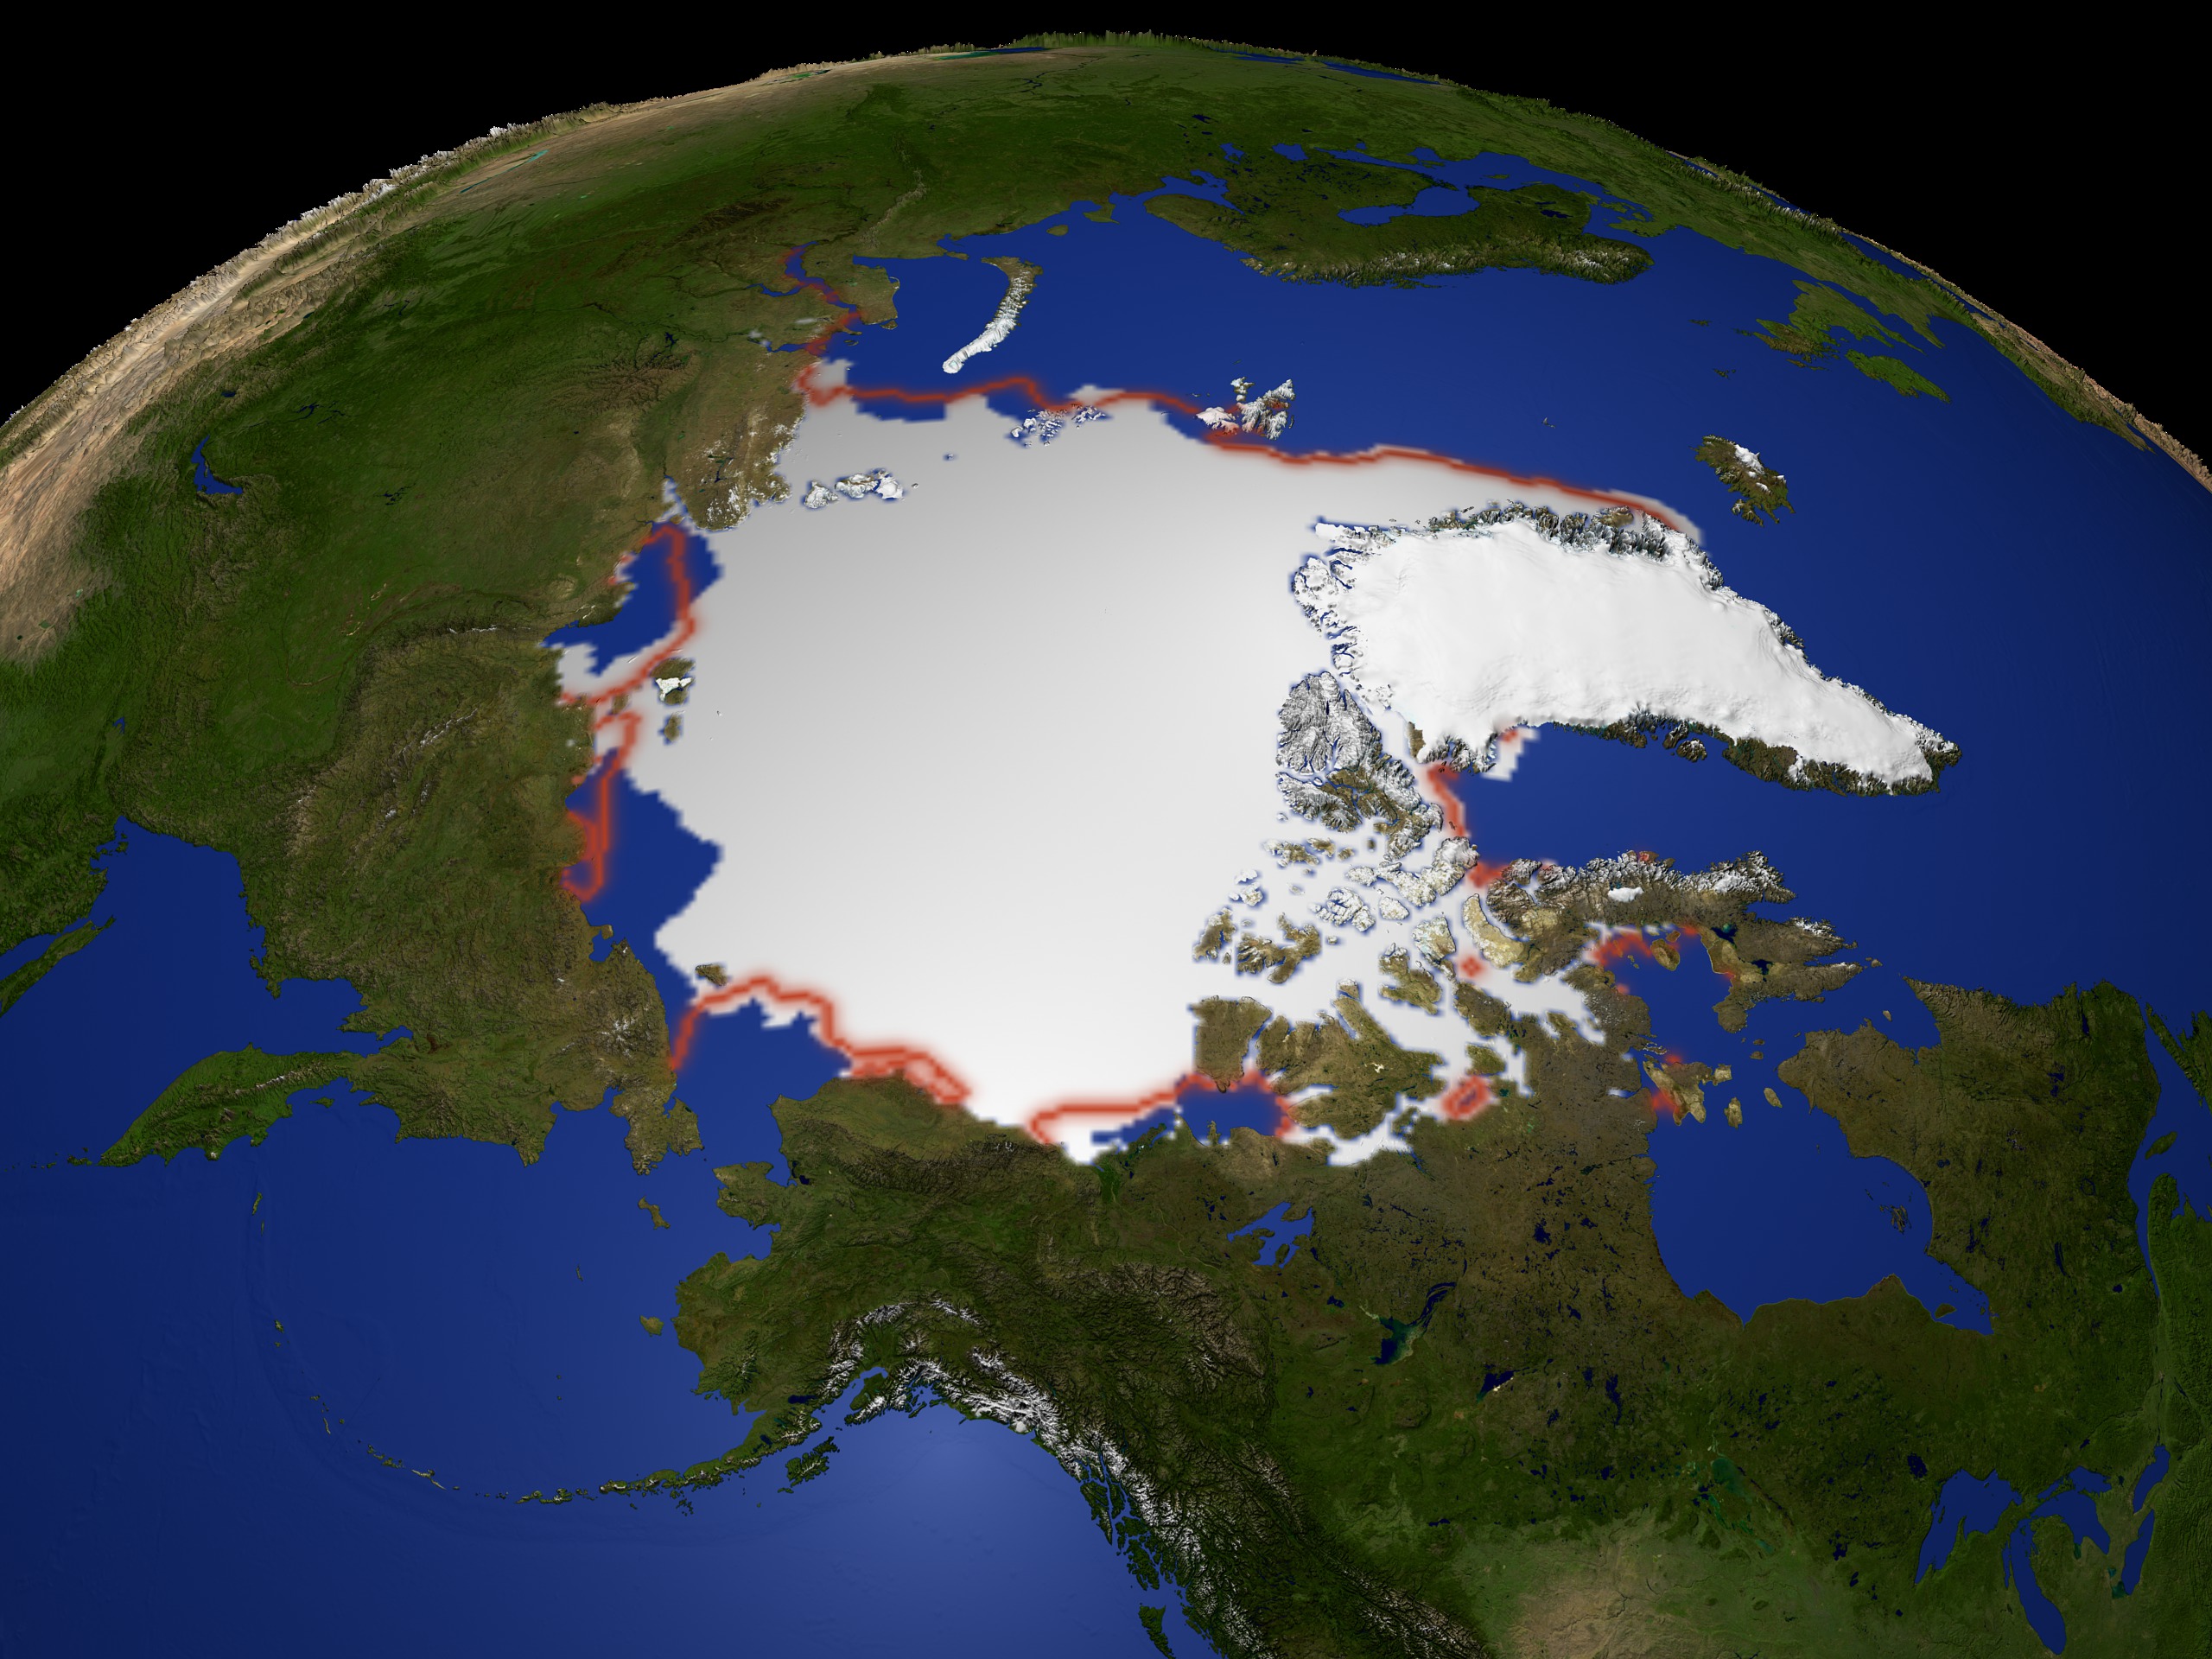
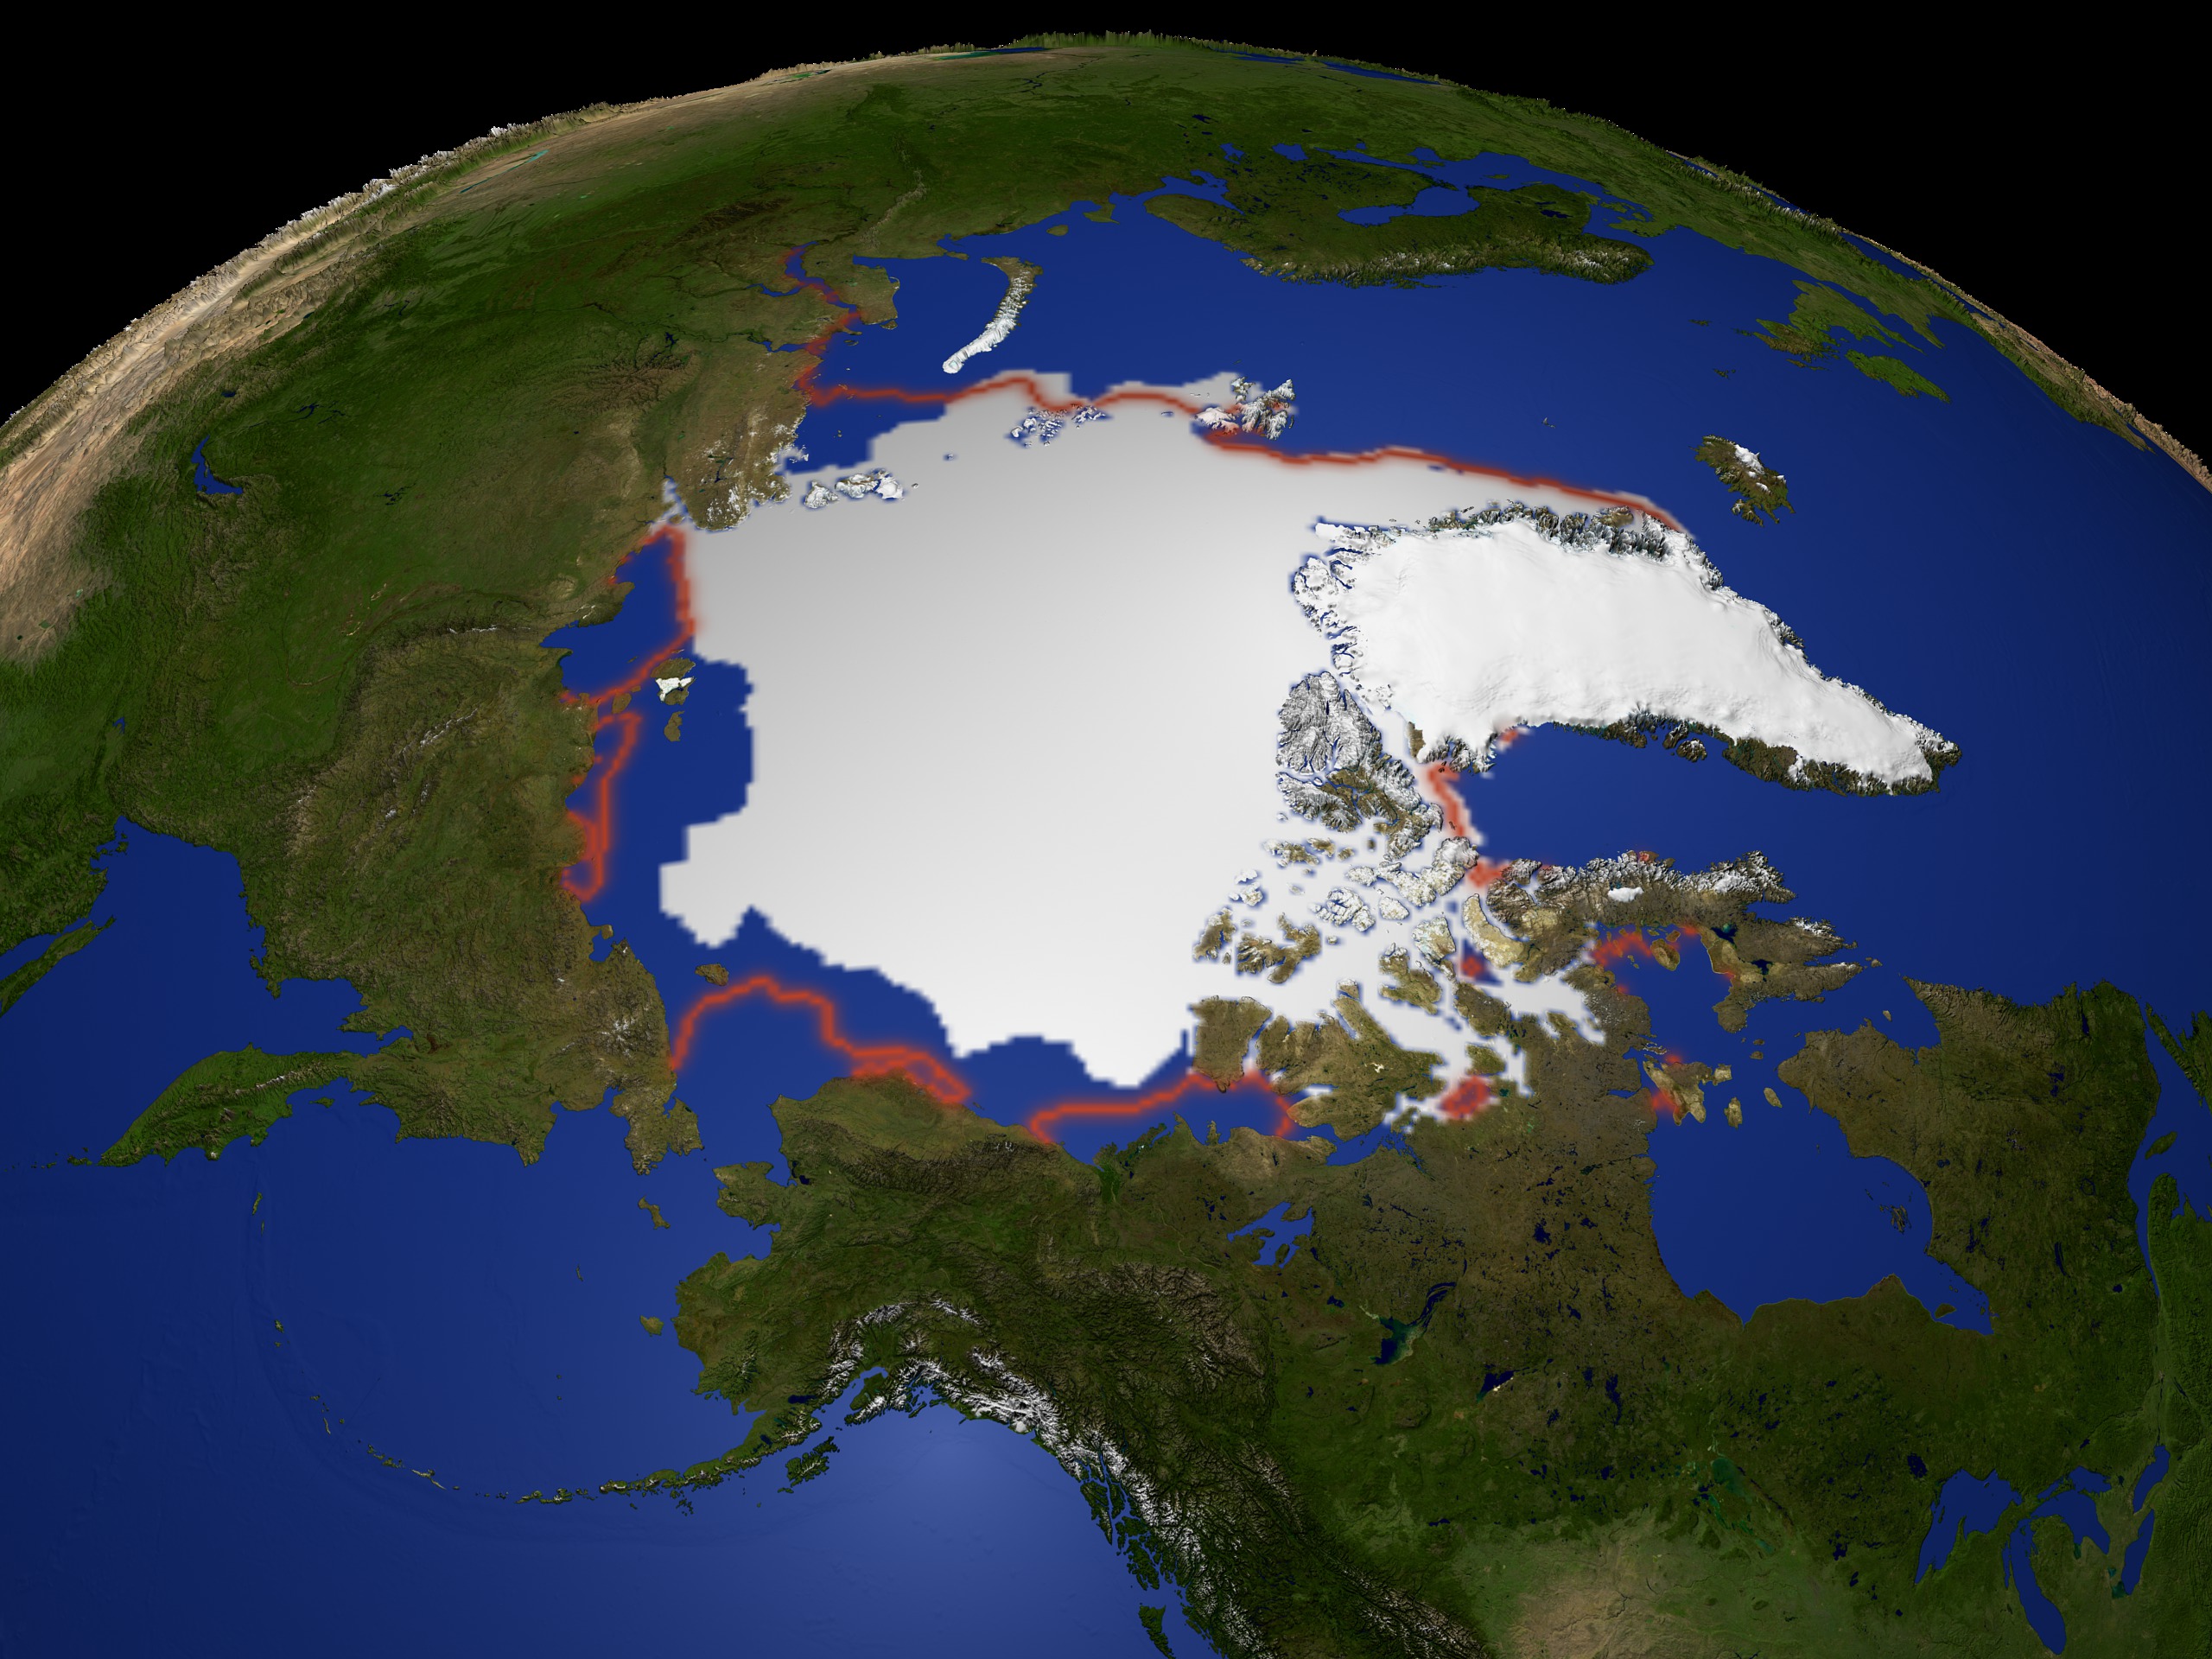
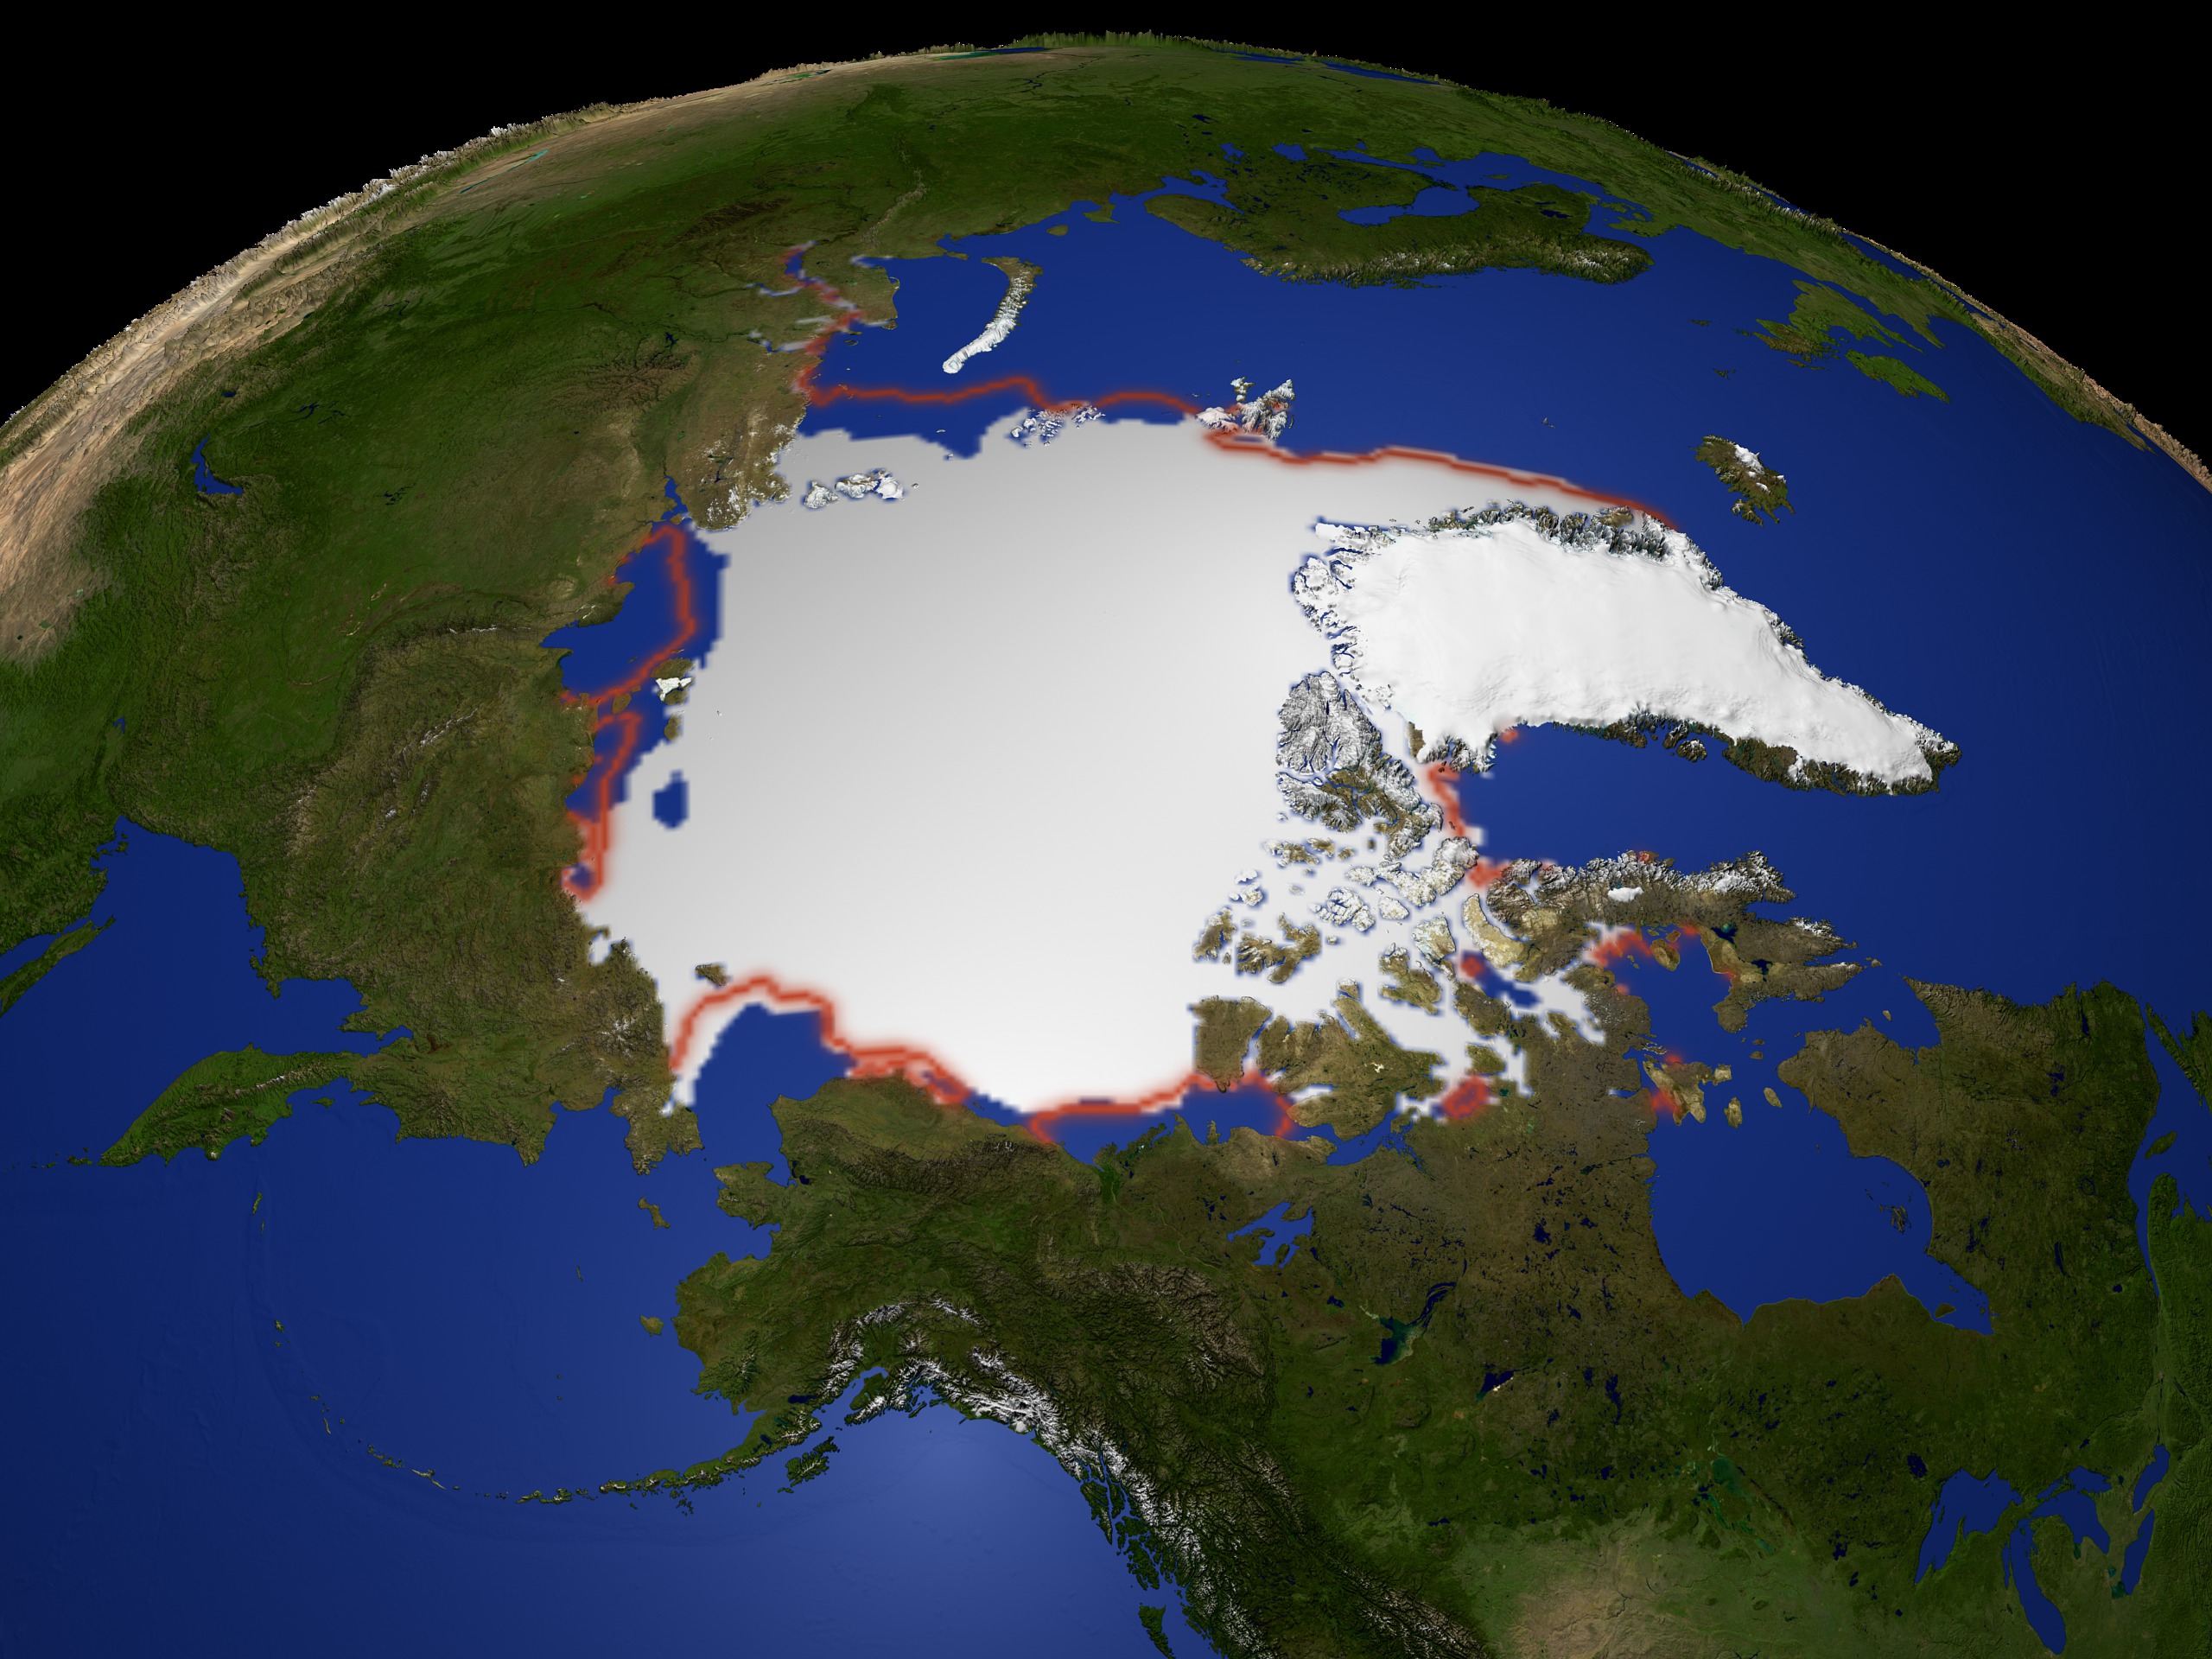
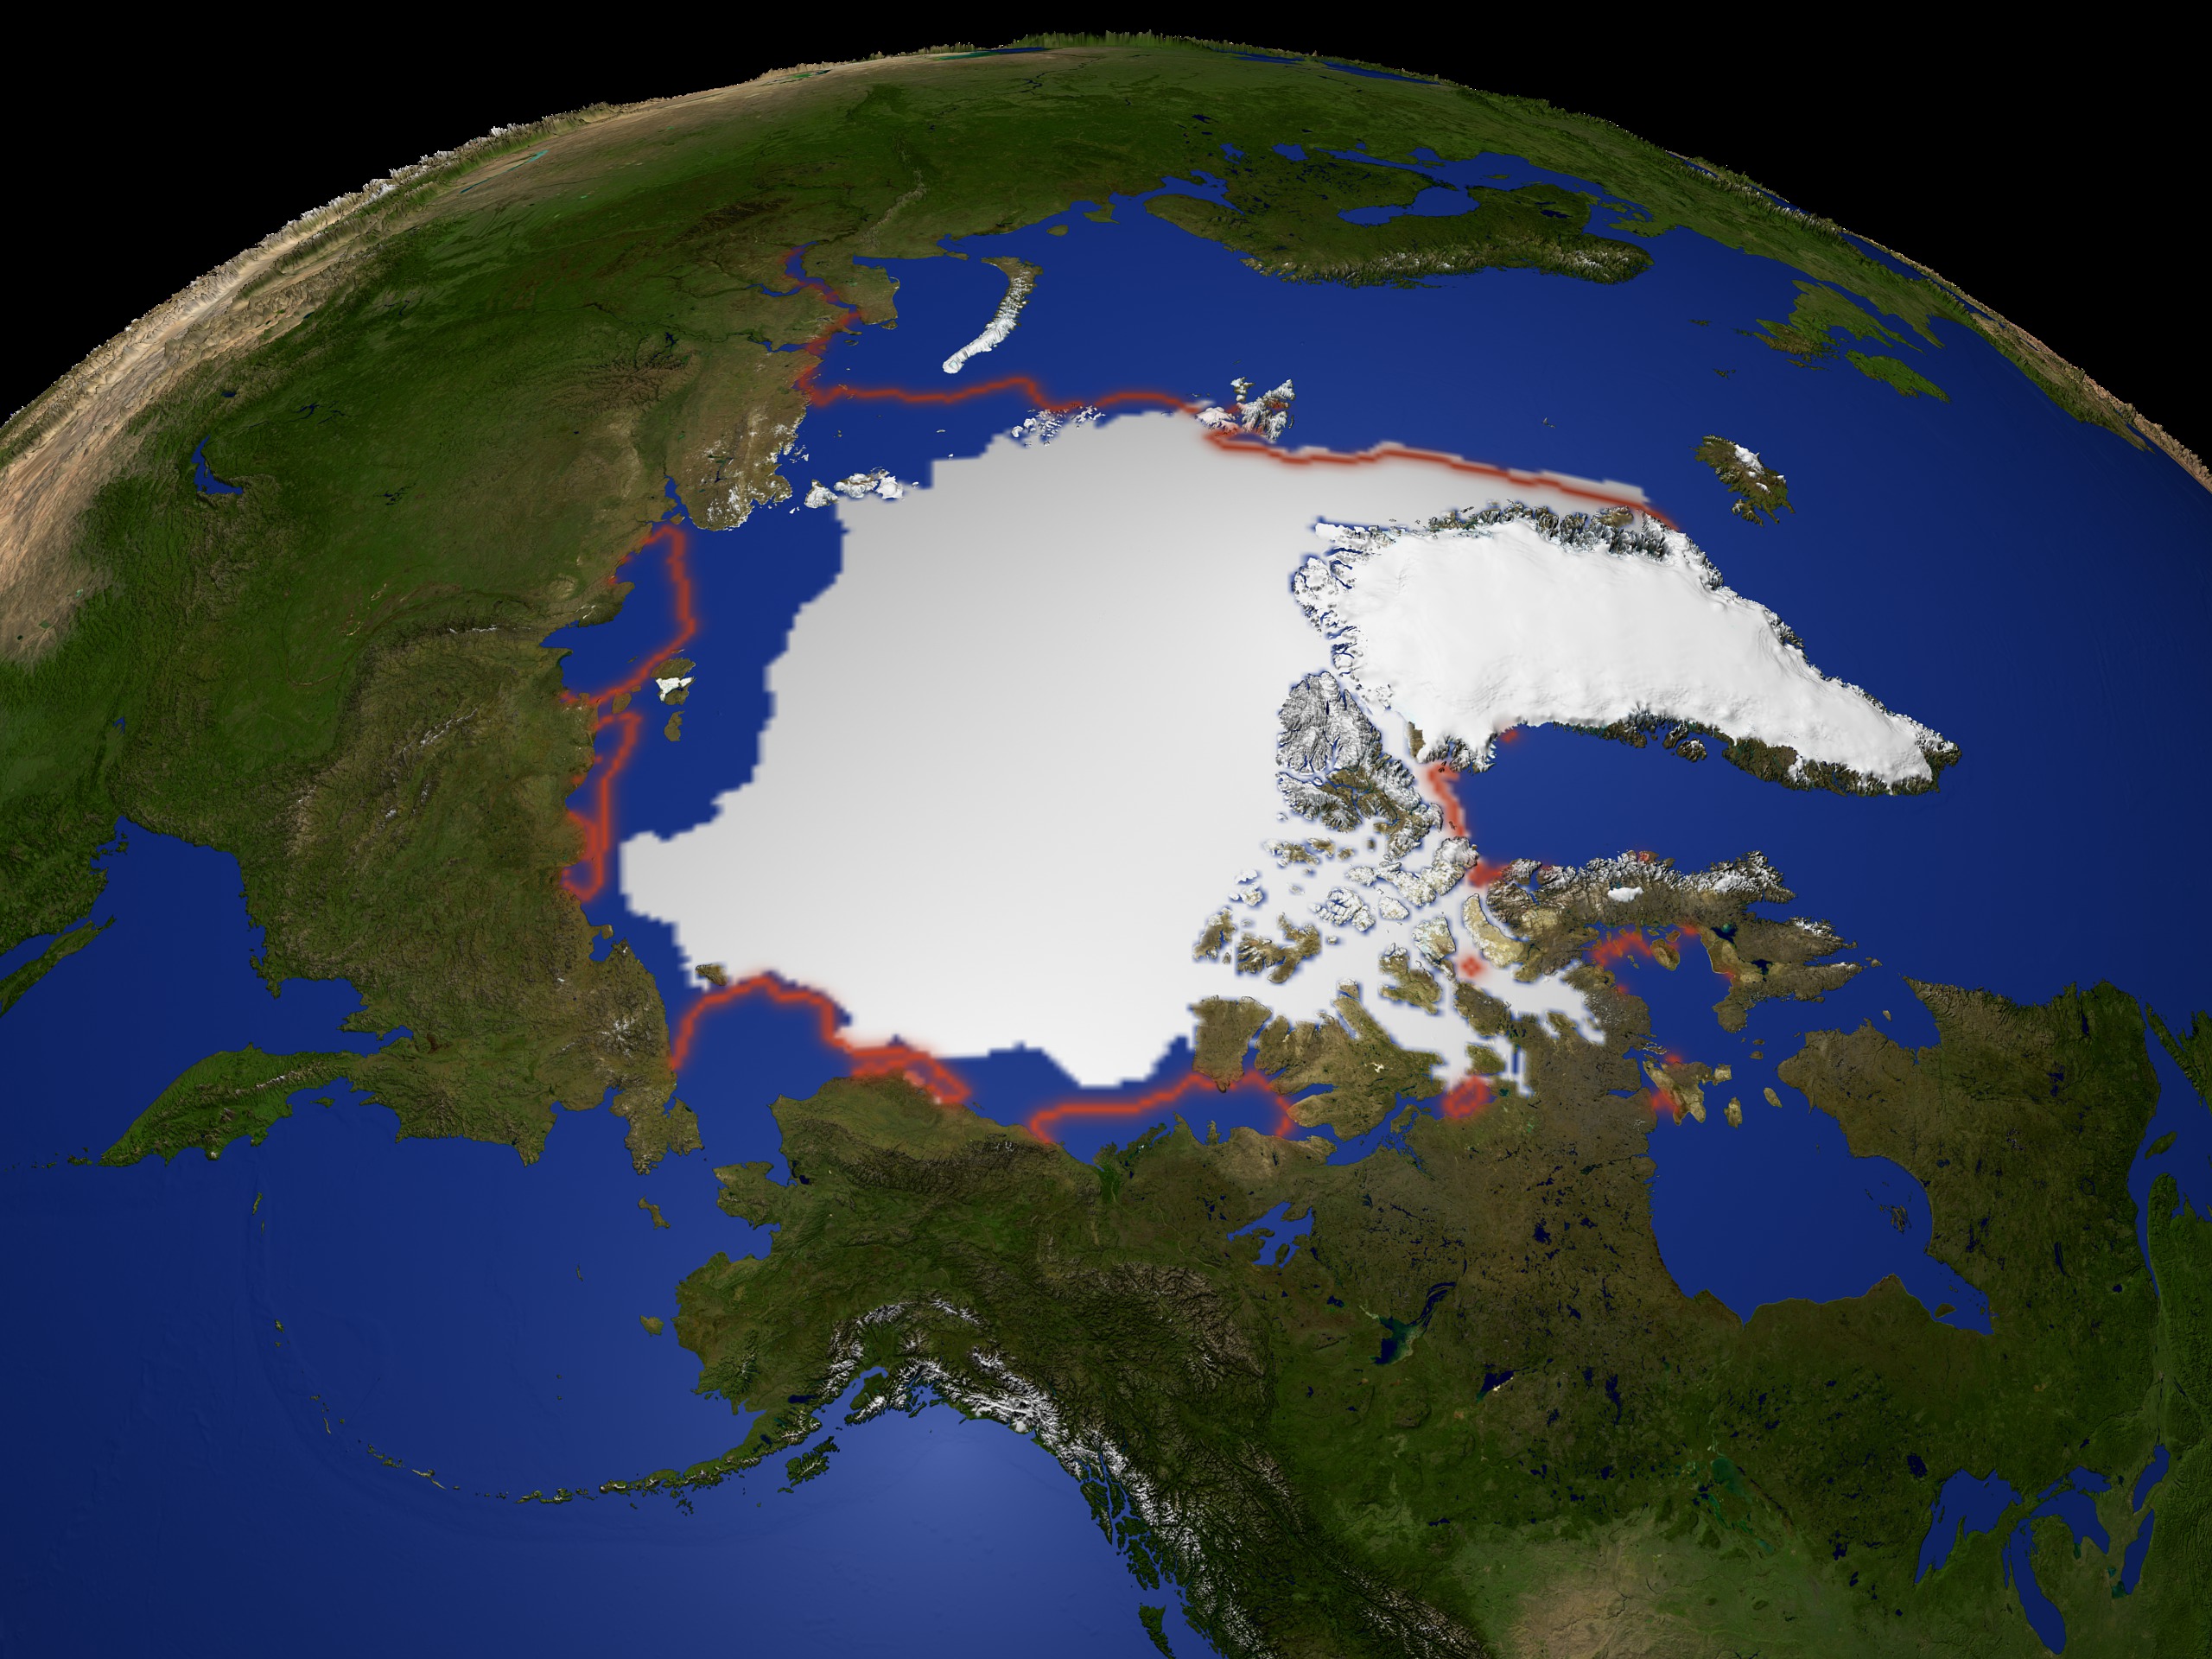
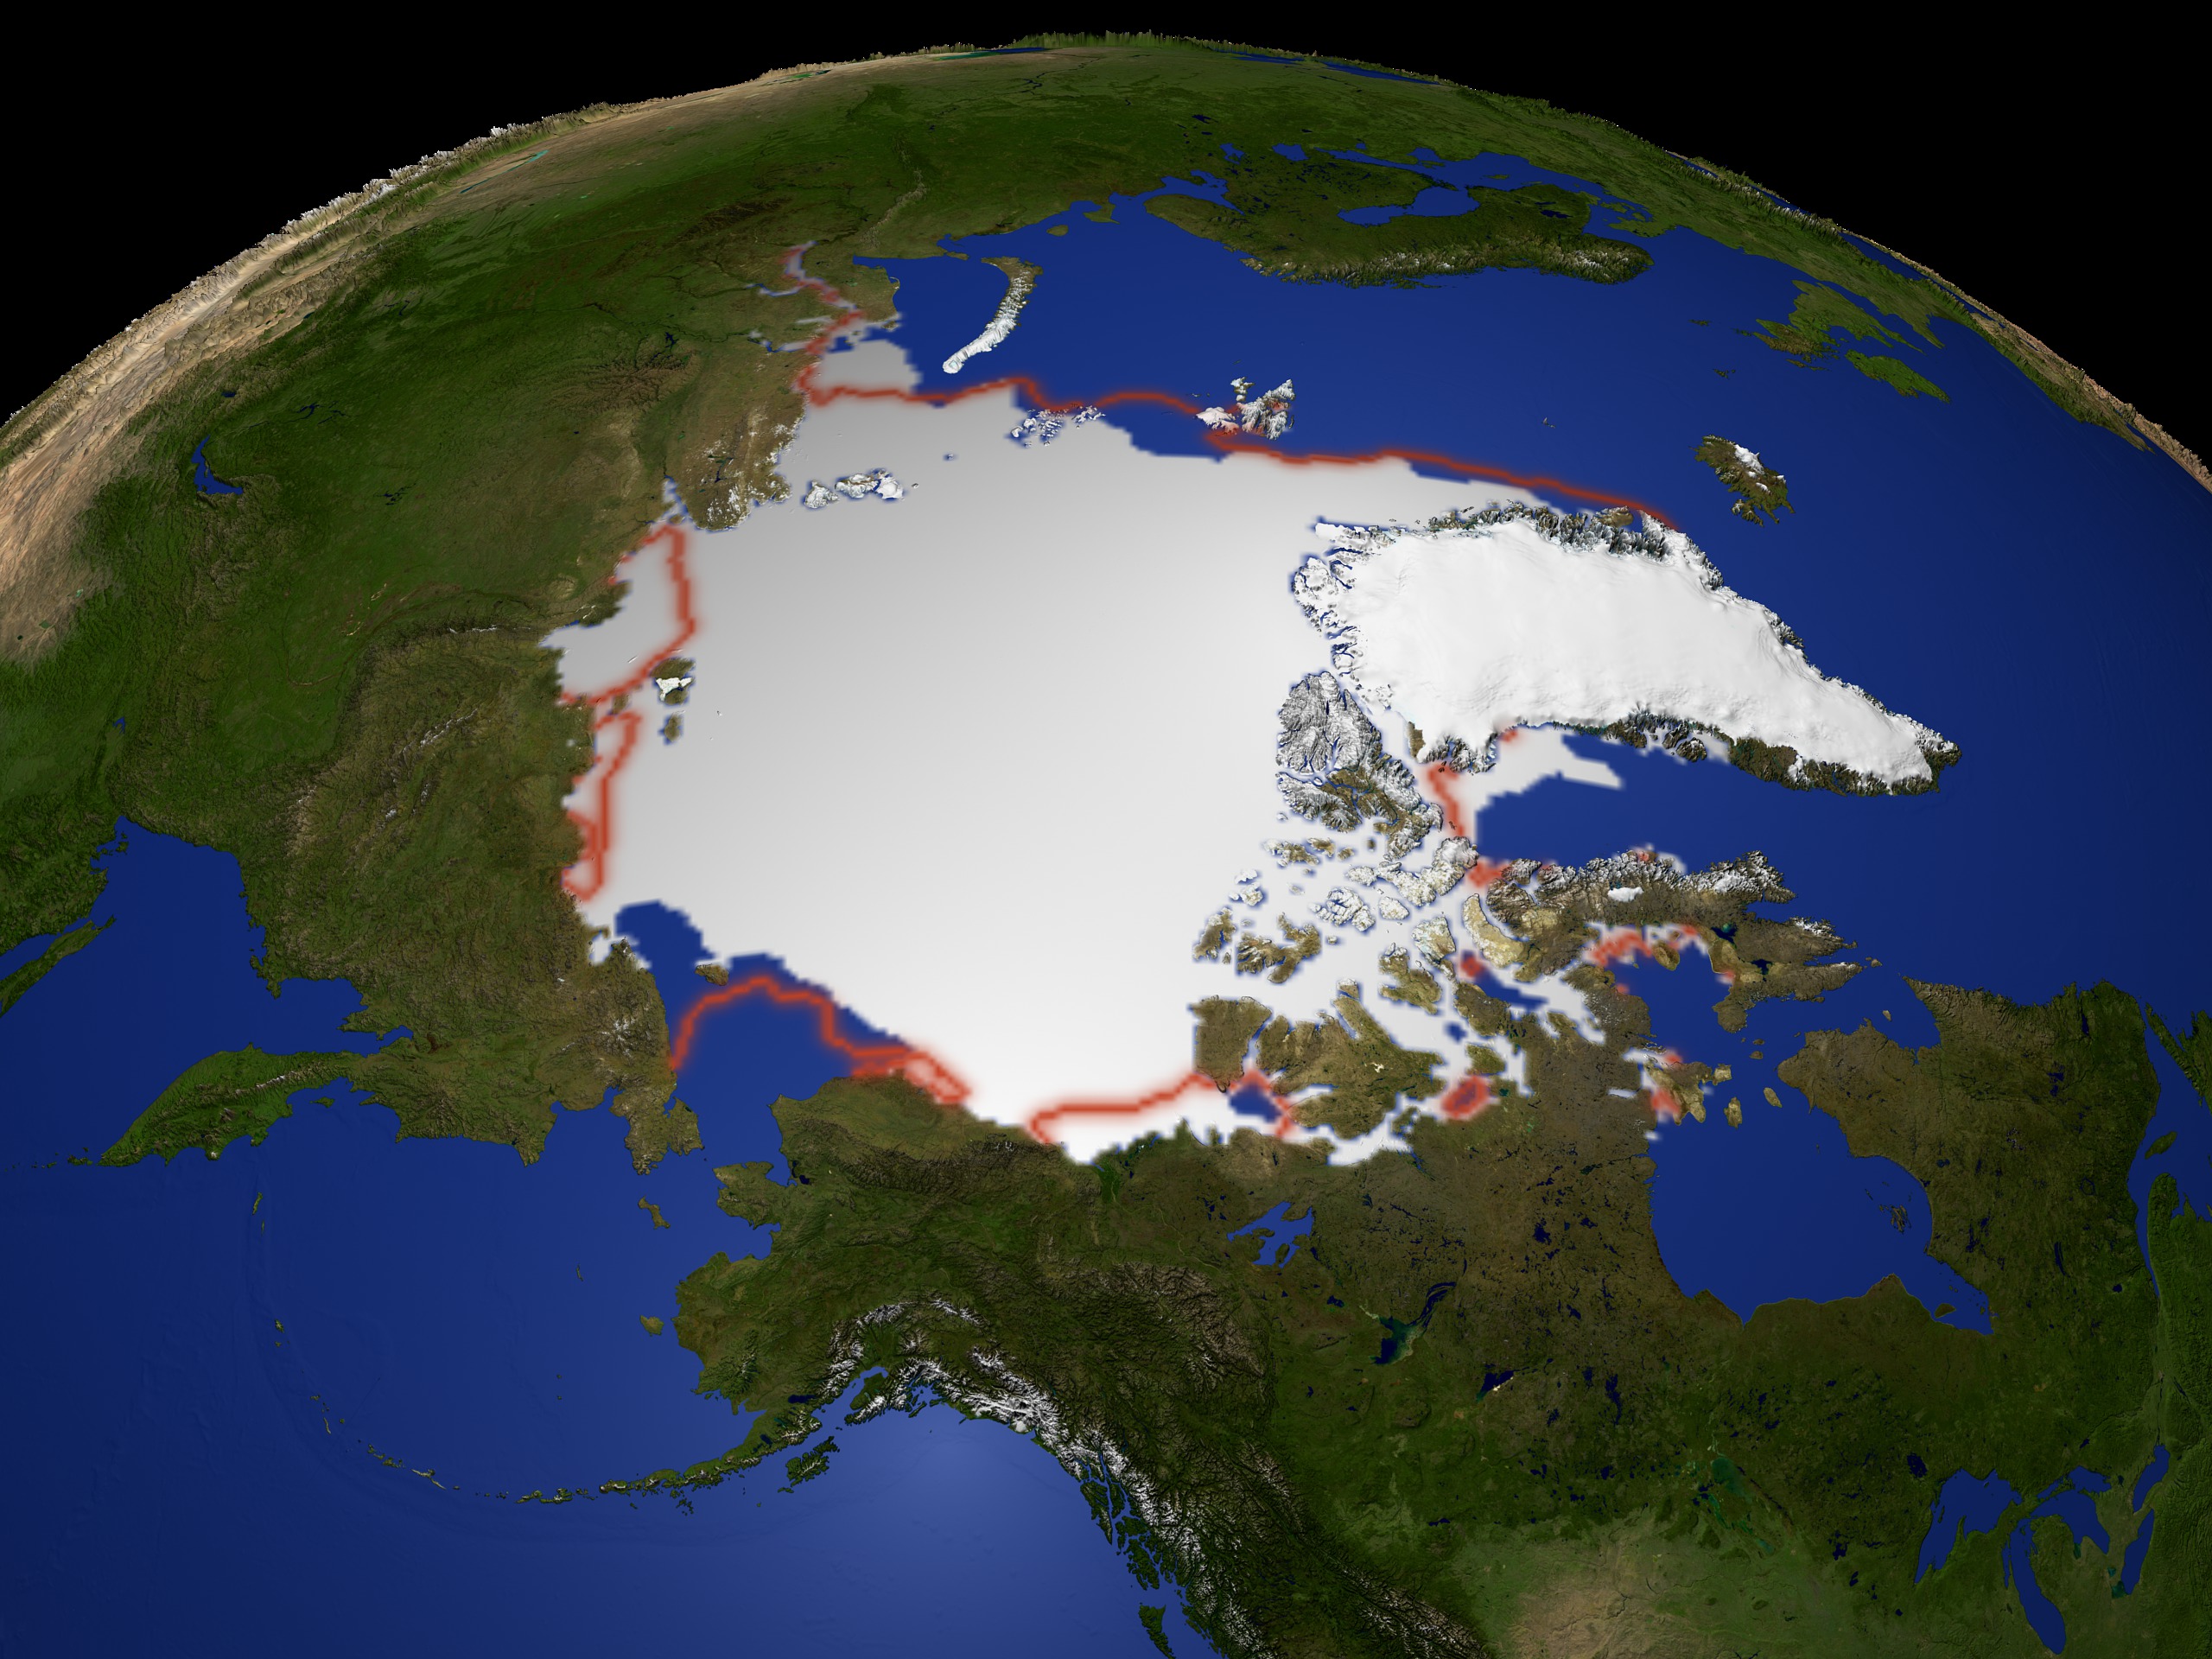
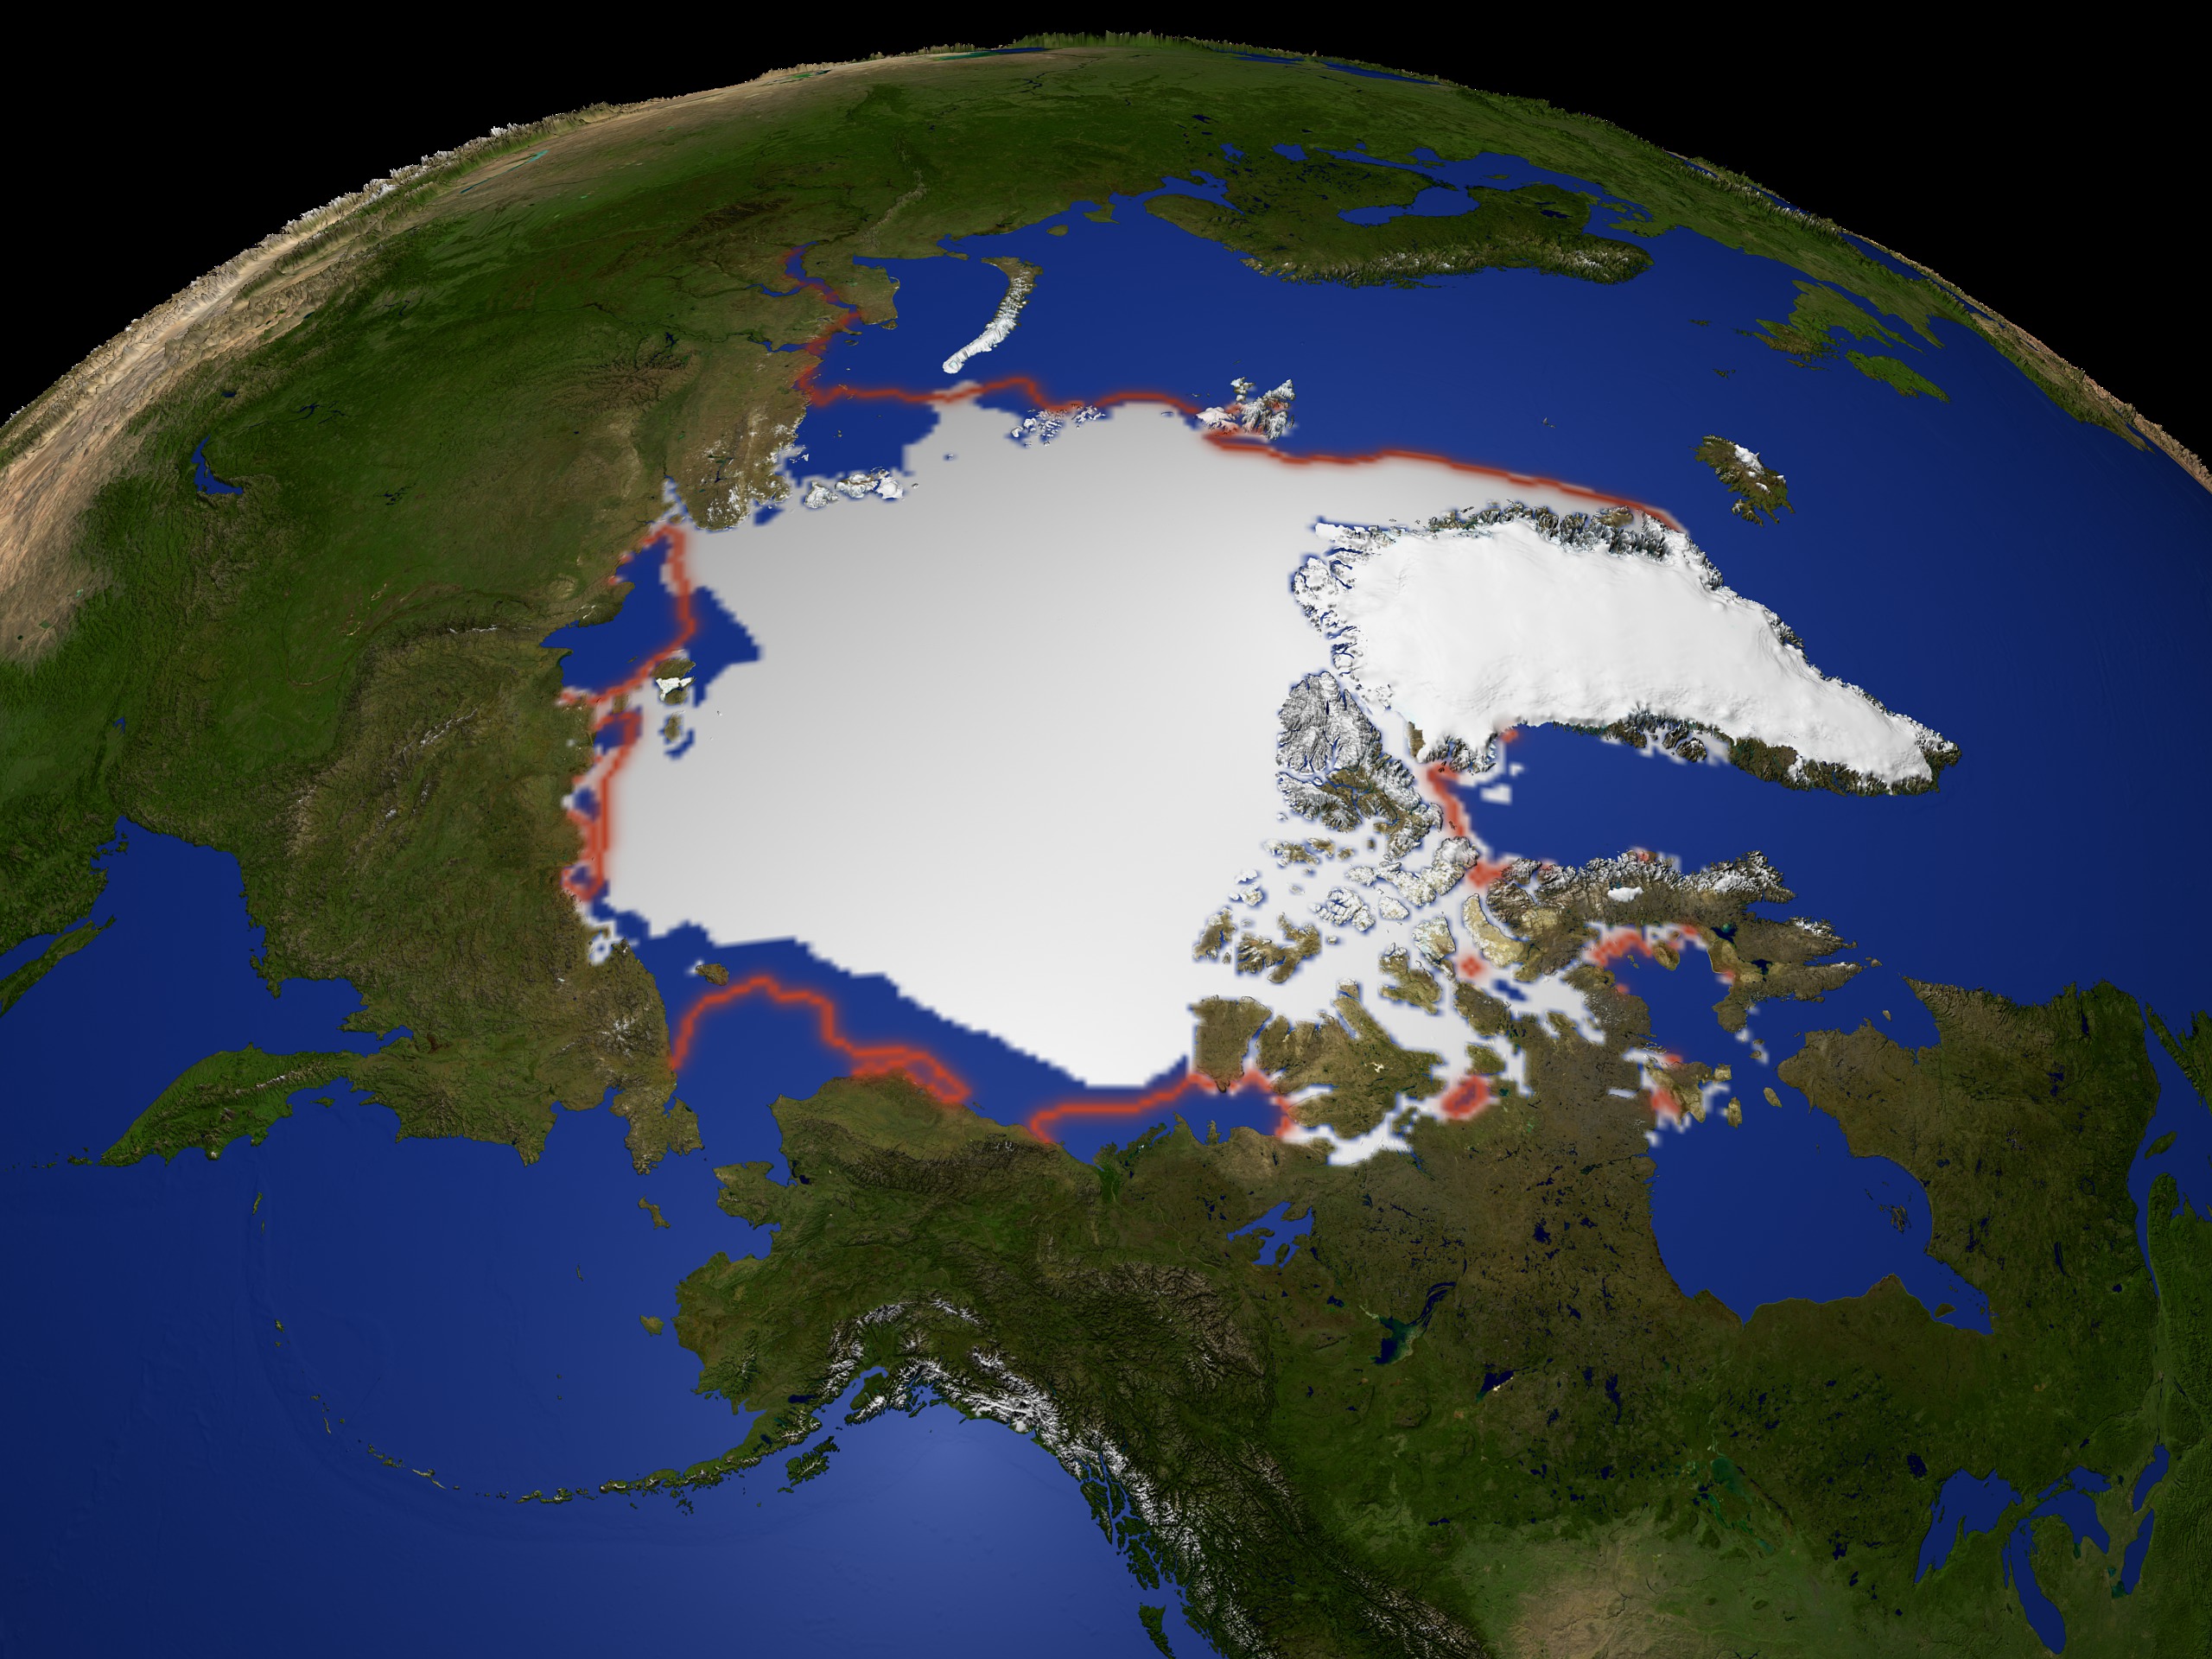


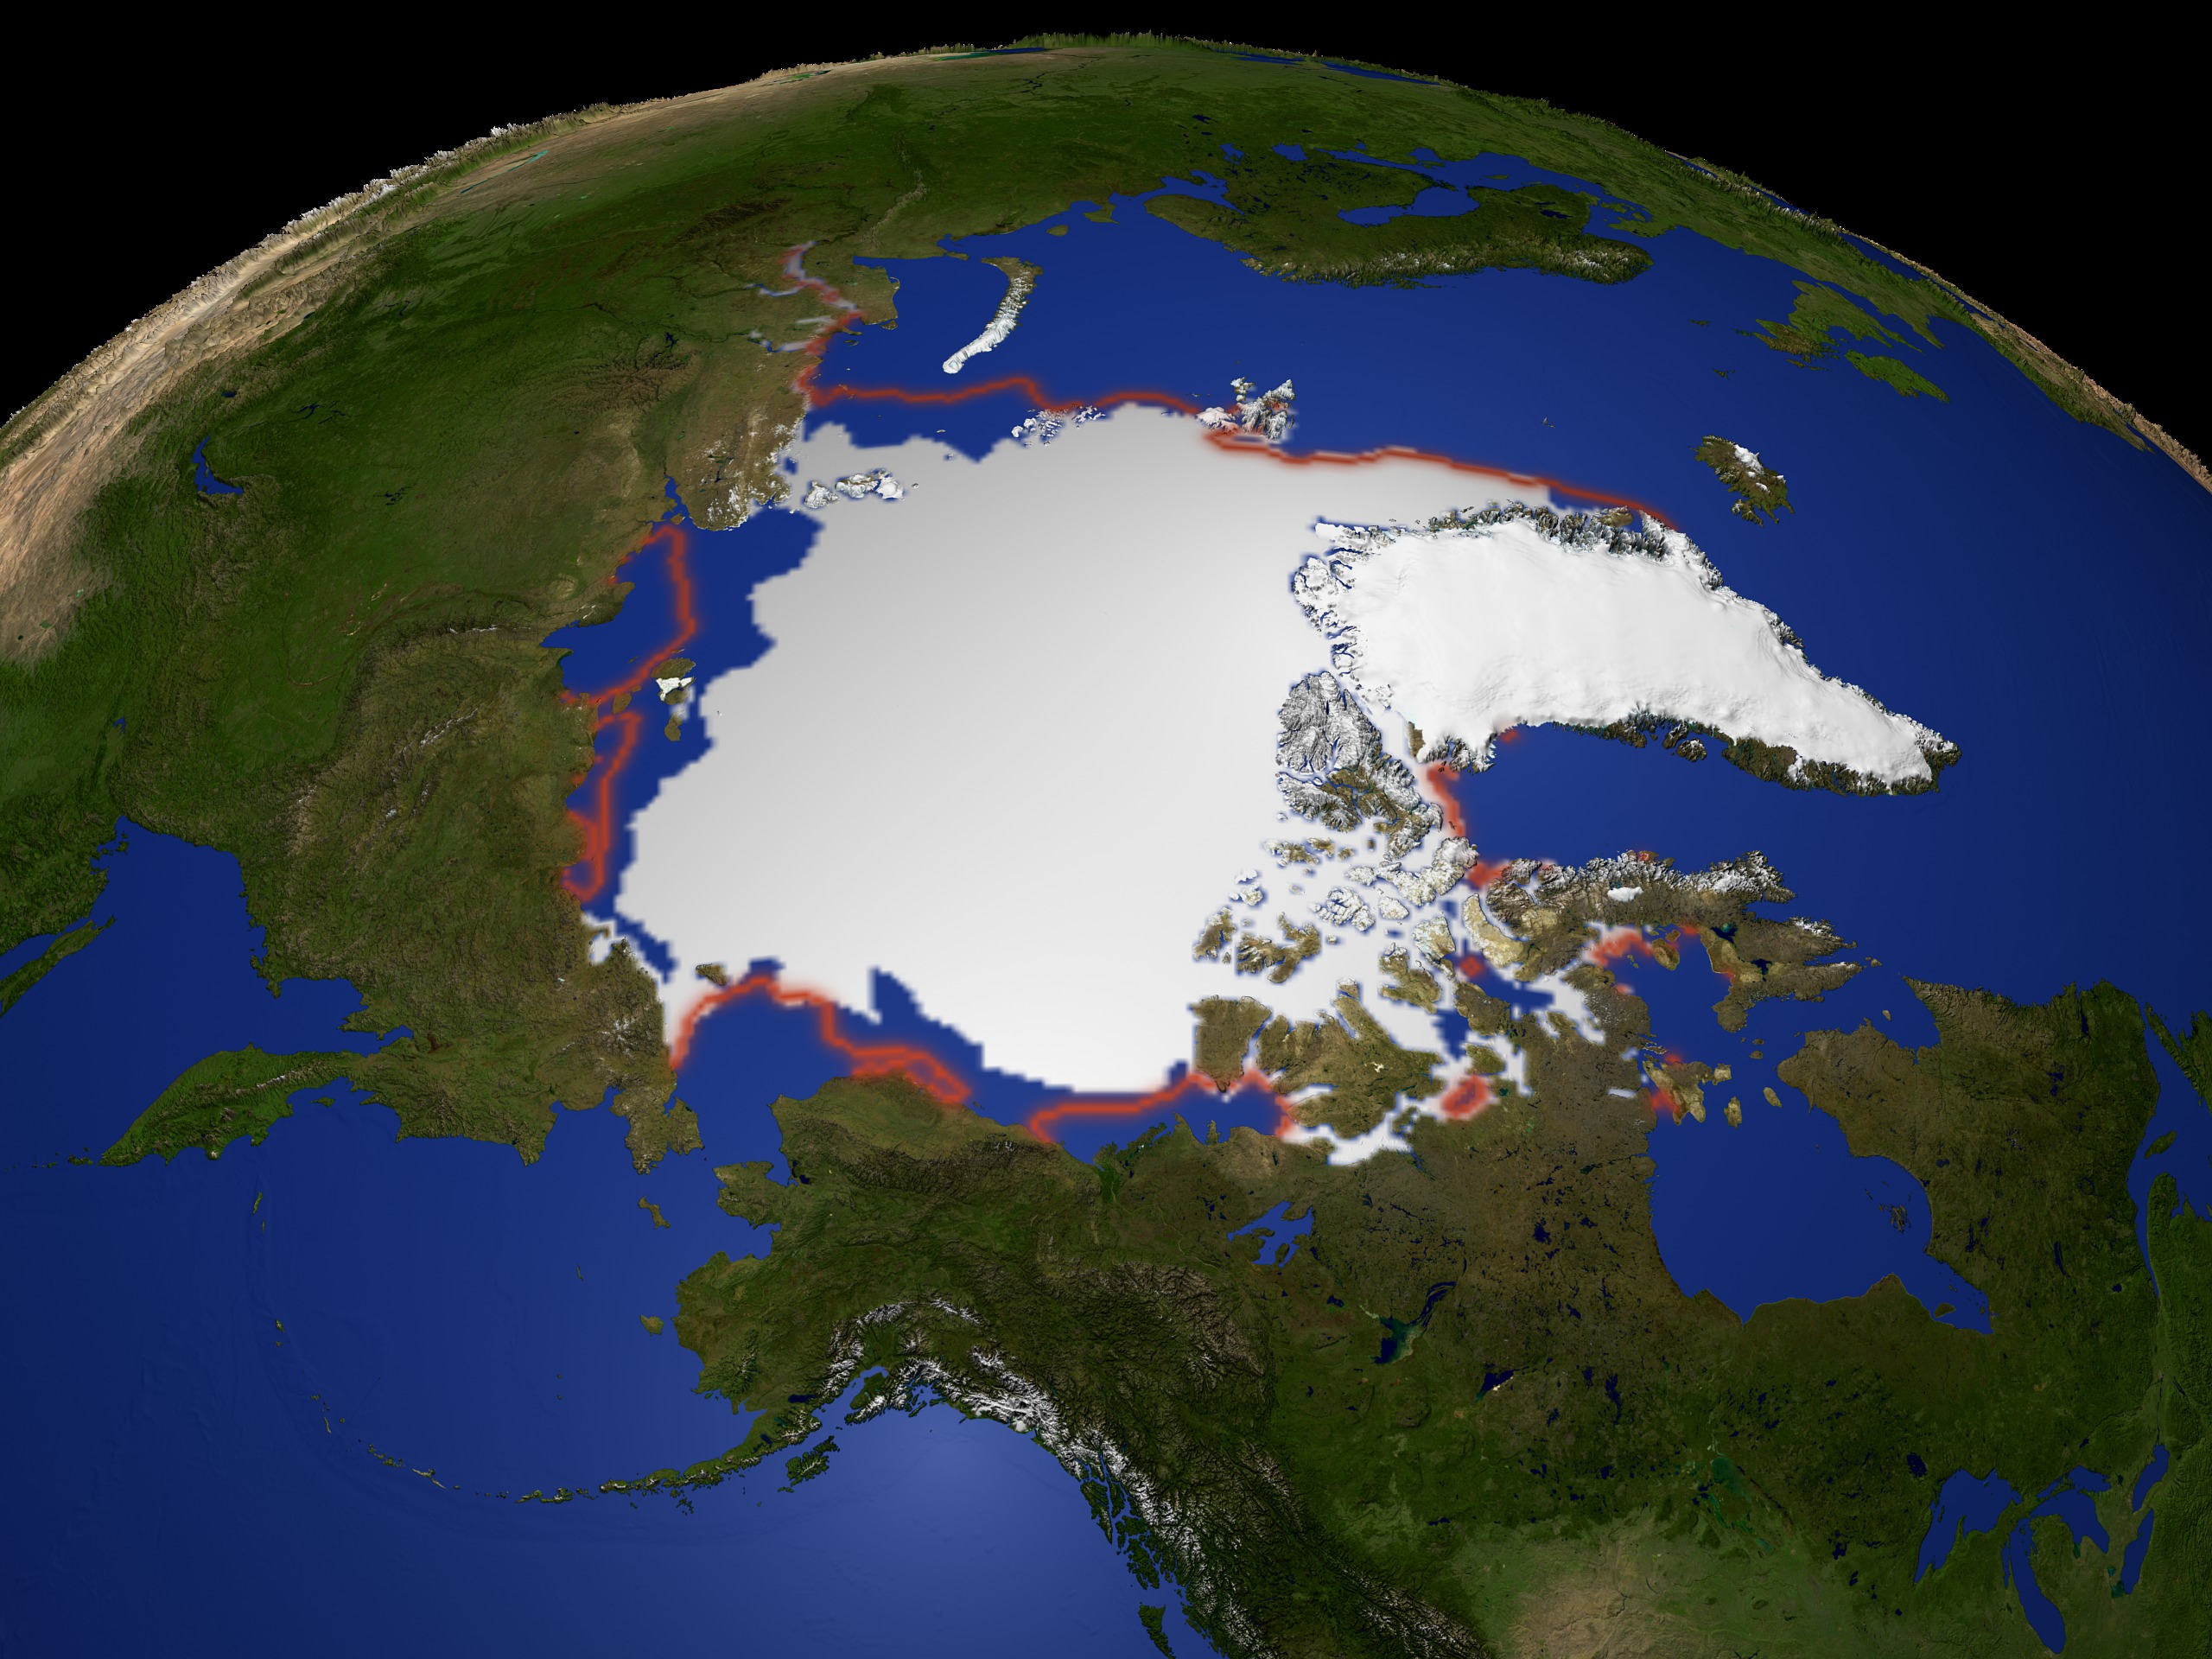
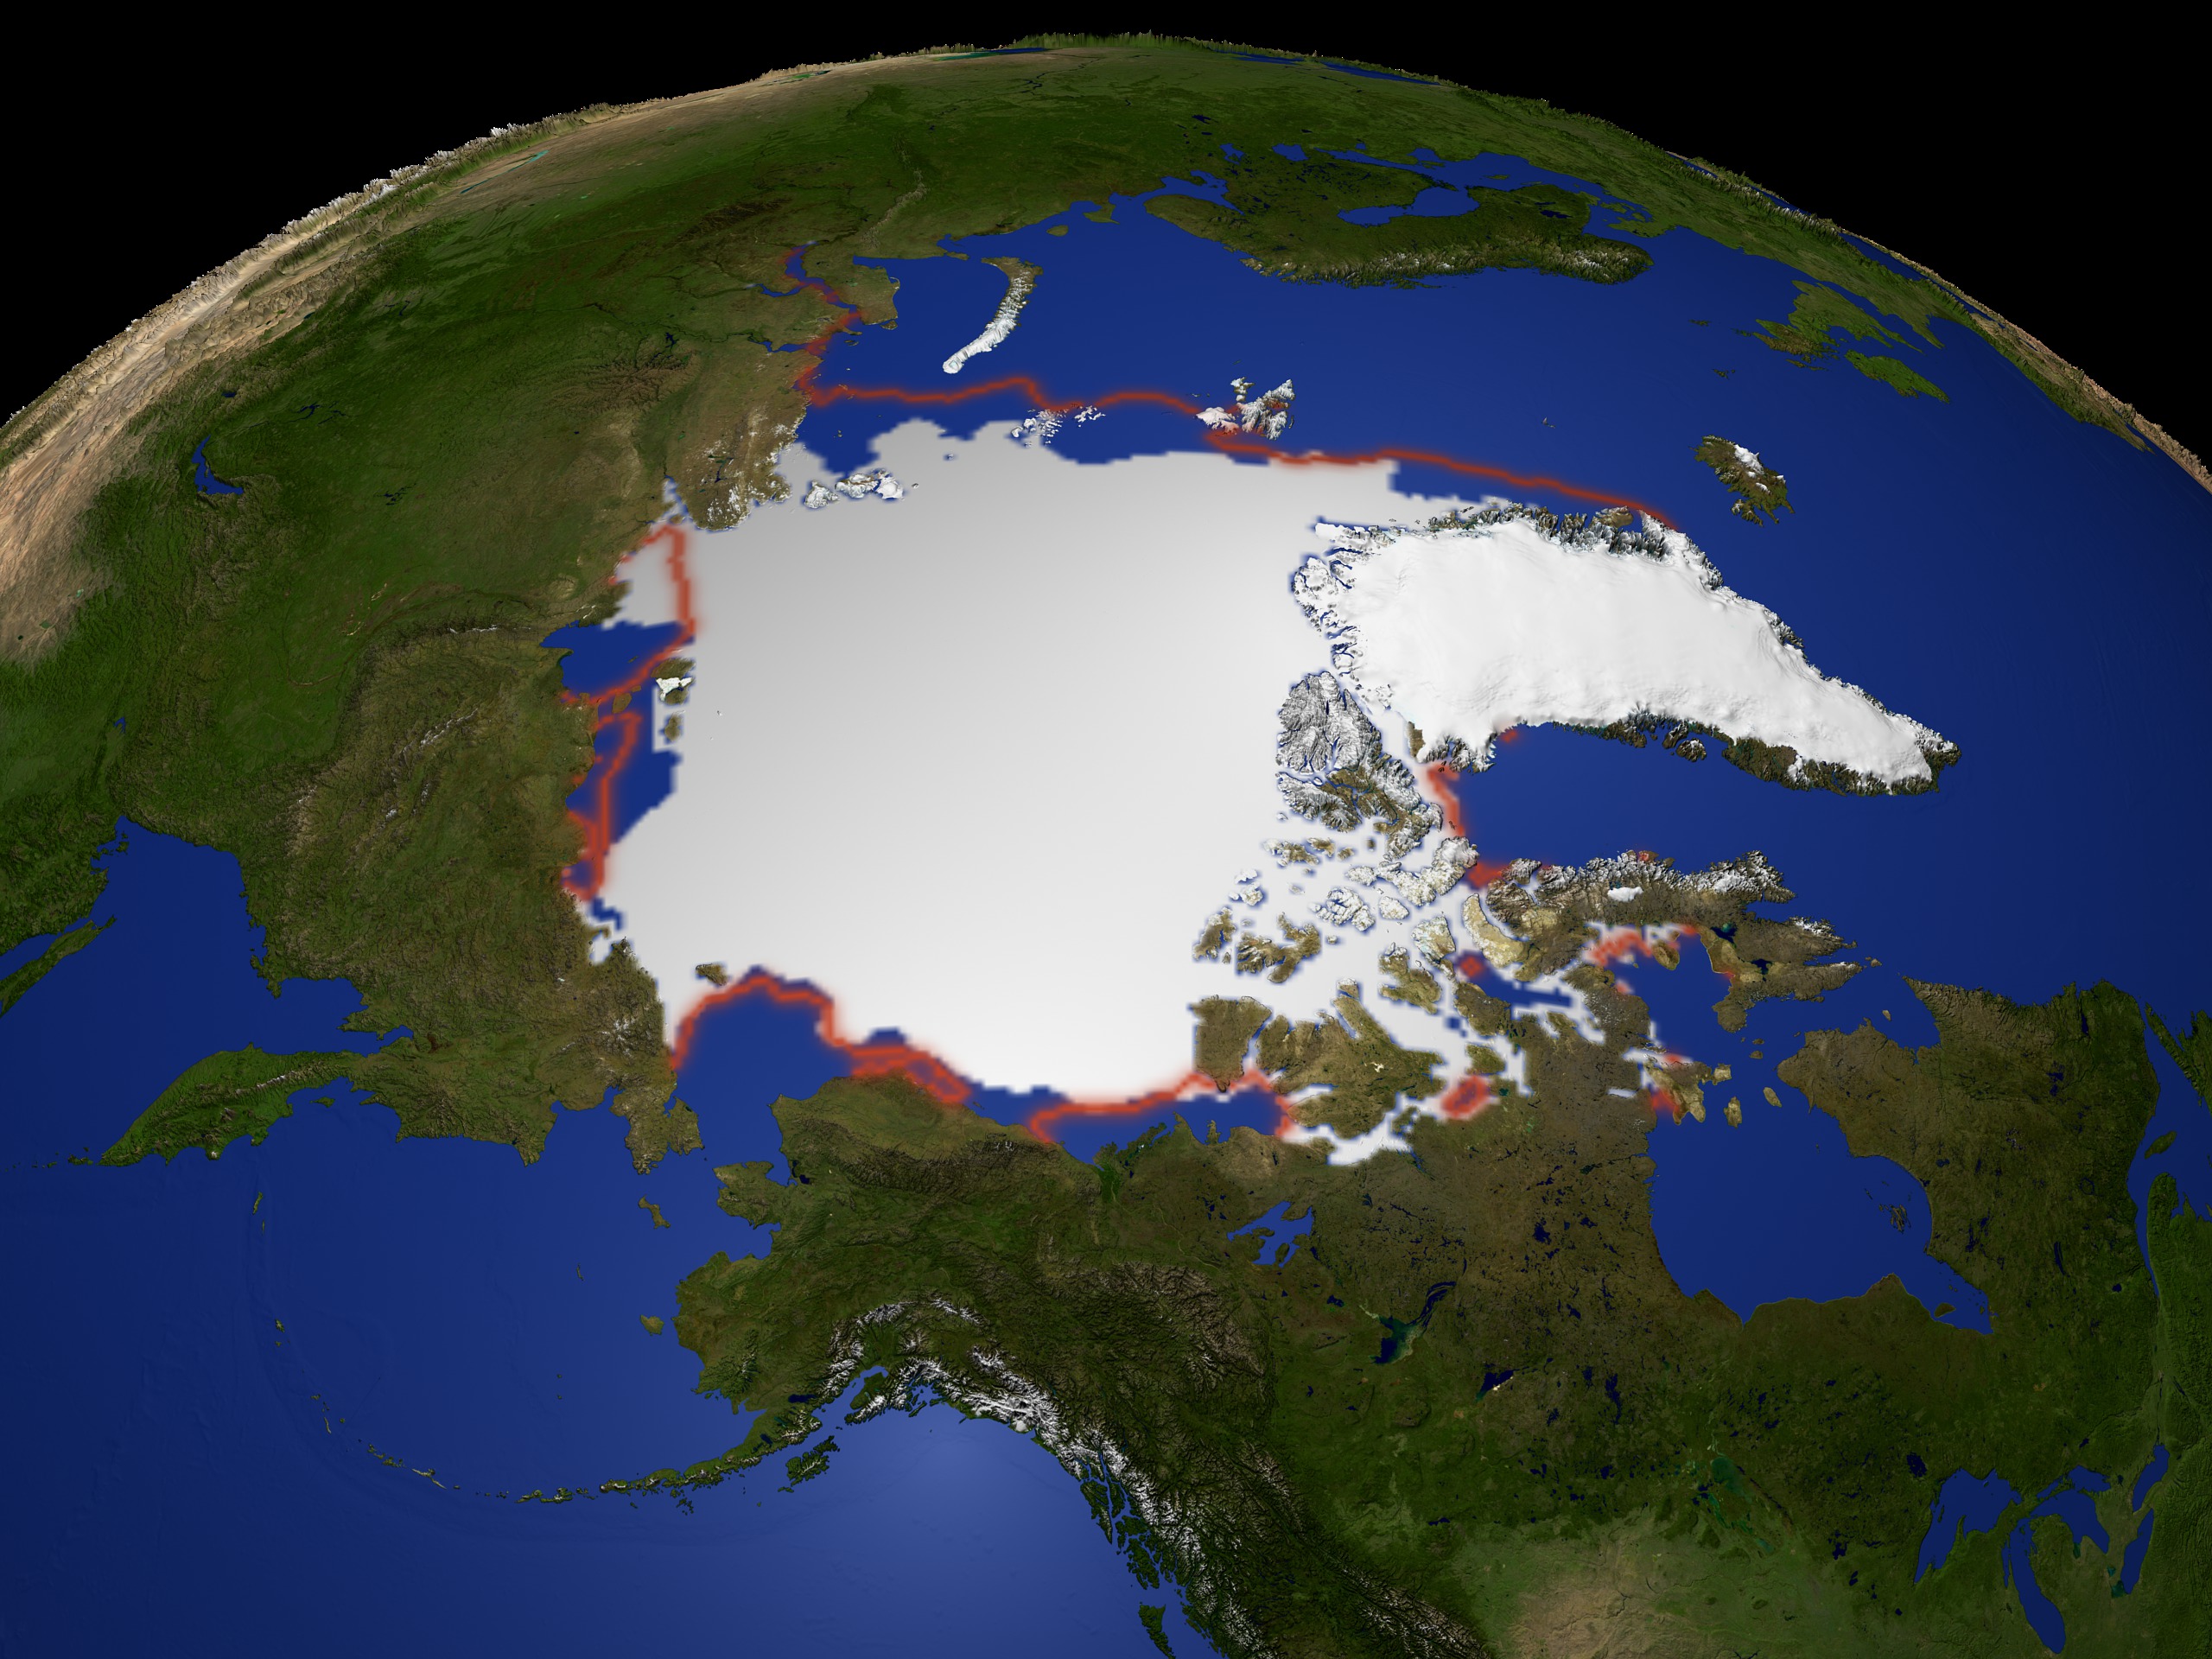

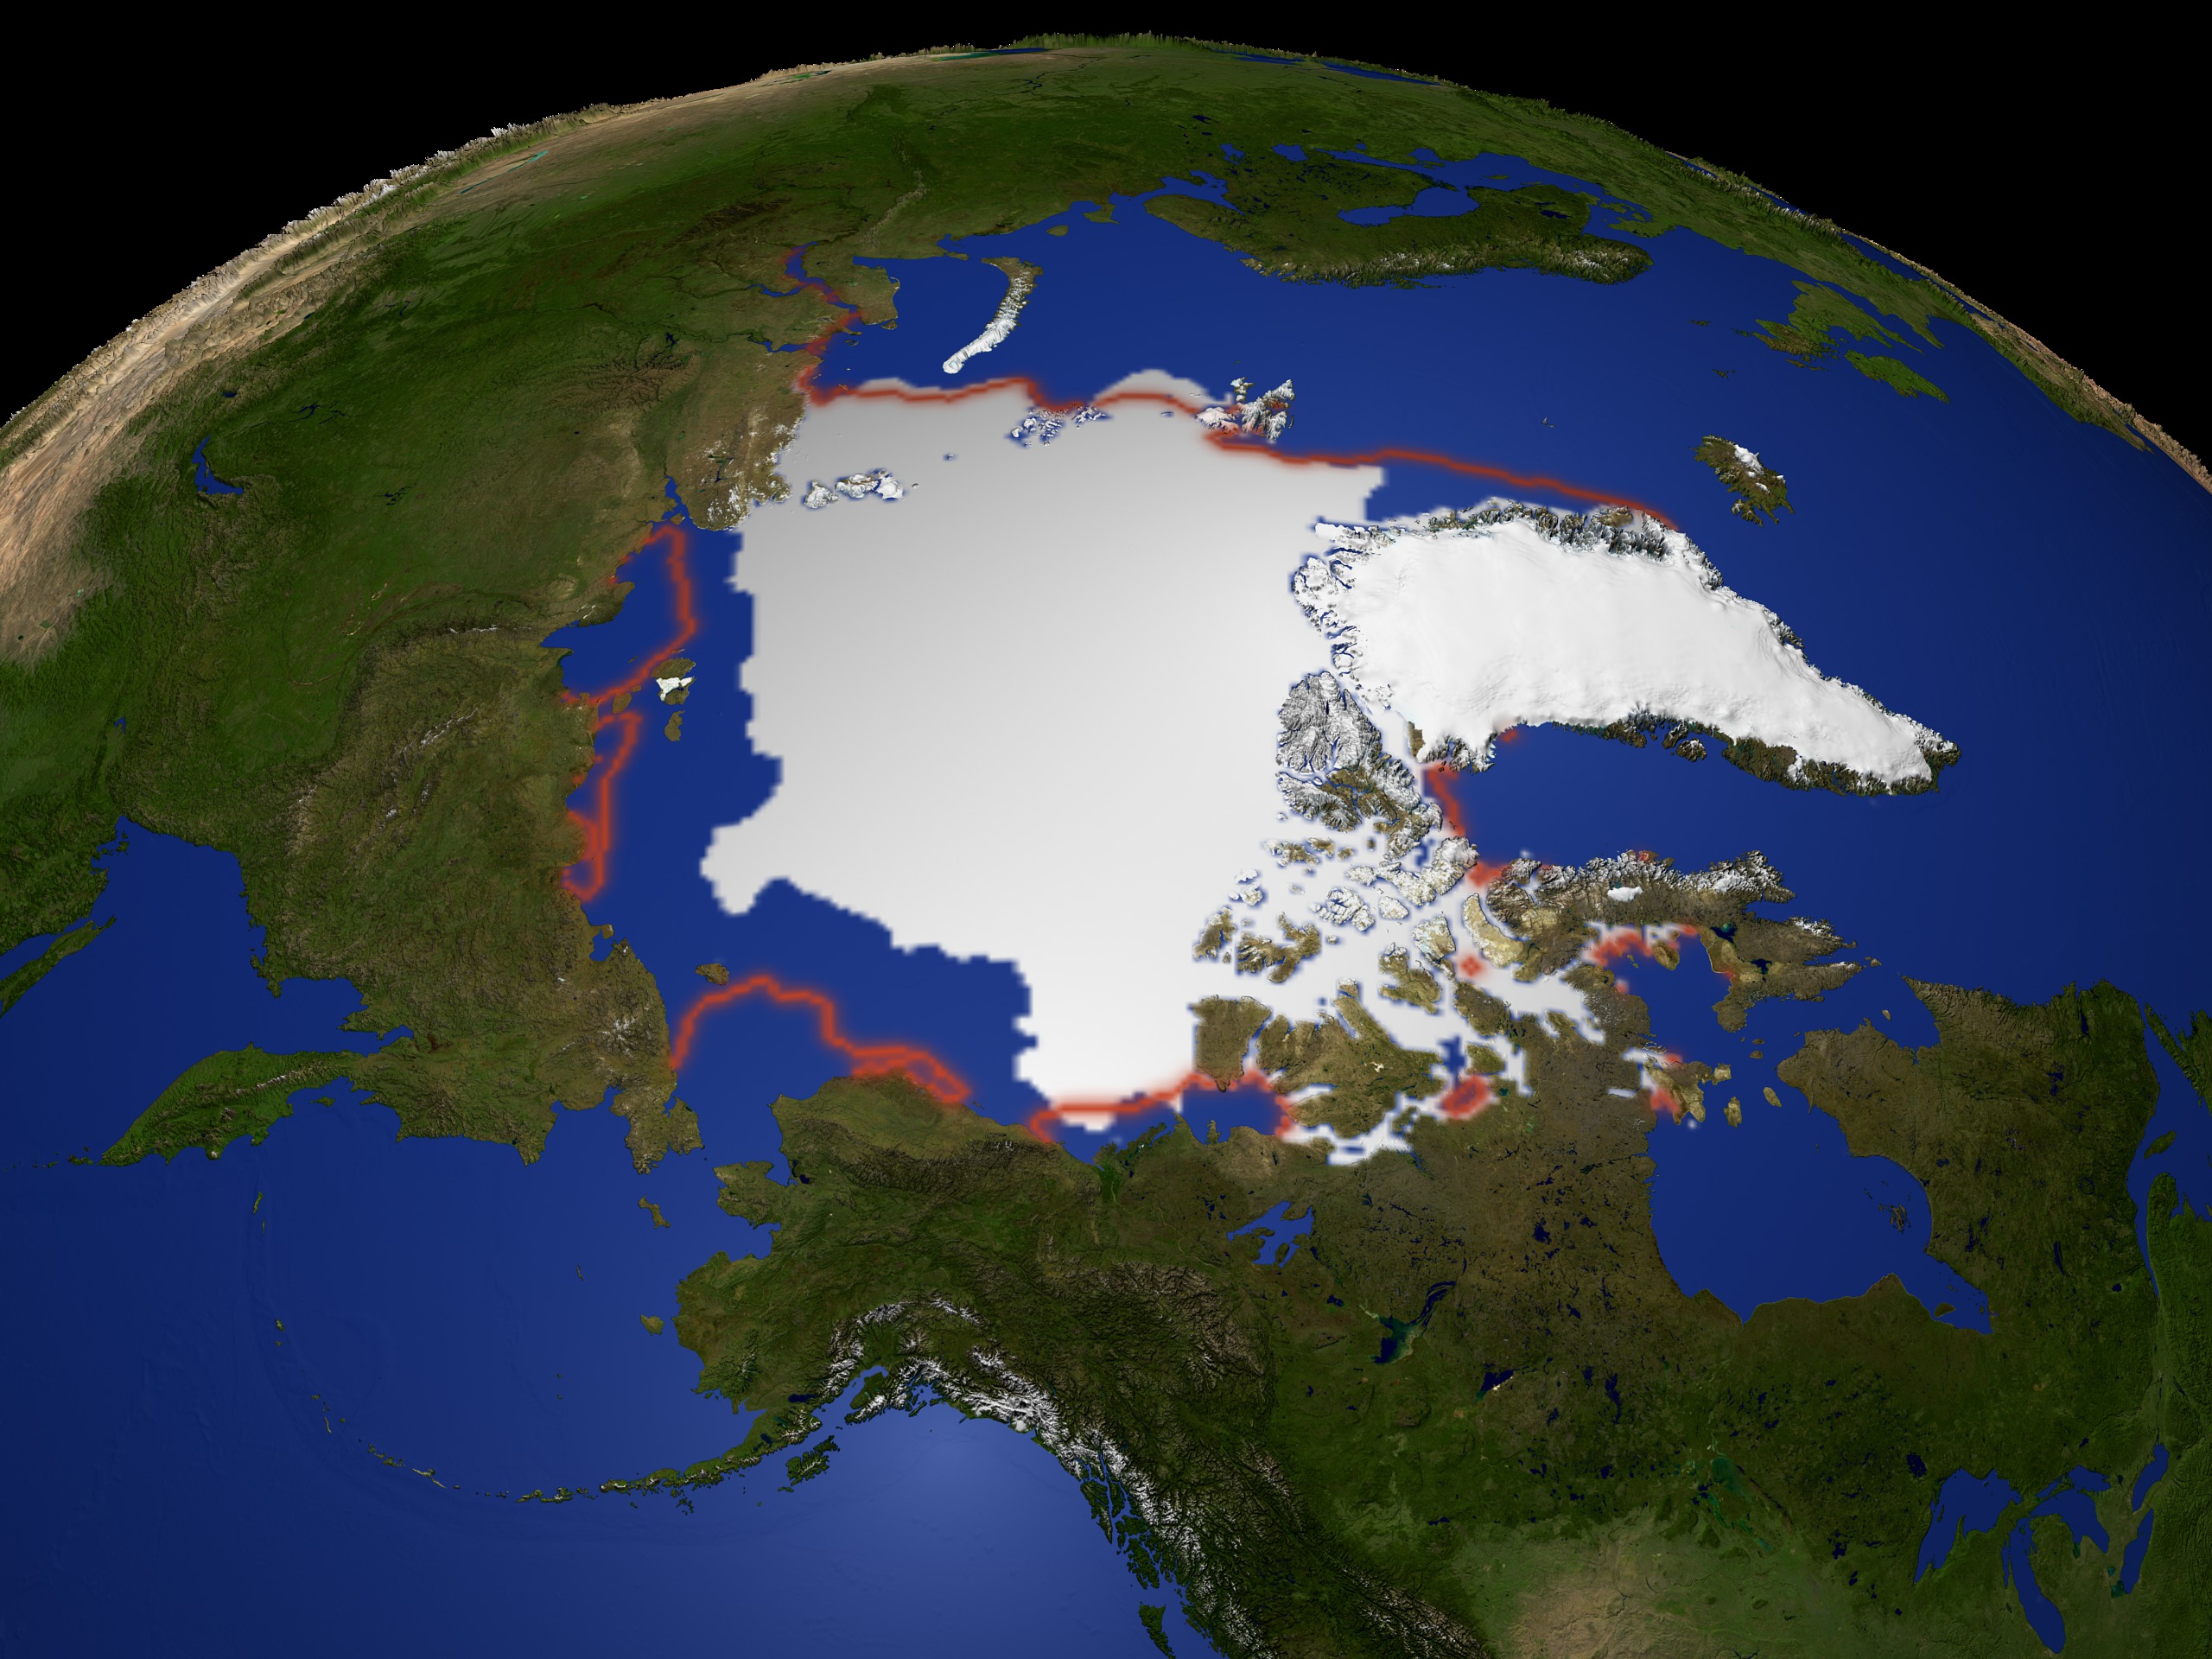
Arctic Yearly Minimum Sea Ice Extent 1979-2003
There is a newer version of this story located here: https://svs.gsfc.nasa.gov/4435
Newer Version
Visualization Credits
Please give credit for this item to:
NASA/Goddard Space Flight Center Scientific Visualization Studio
NASA/Goddard Space Flight Center Scientific Visualization Studio
Short URL to share this page:
https://svs.gsfc.nasa.gov/2927
Data Used:
Note: While we identify the data sets used in these visualizations, we do not store any further details nor the data sets themselves on our site.
This item is part of this series:
Cryosphere 2004
Keywords:
SVS >> Anomaly
DLESE >> Cryology
SVS >> Sea Ice
GCMD >> Earth Science >> Hydrosphere
GCMD >> Earth Science >> Cryosphere >> Sea Ice
SVS >> For Educators
SVS >> Oceans >> Freeze/thaw
SVS >> Cryosphere >> Snow/ice
SVS >> Hydrosphere >> Ice
NASA Science >> Earth
GCMD keywords can be found on the Internet with the following citation: Olsen, L.M., G. Major, K. Shein, J. Scialdone, S. Ritz, T. Stevens, M. Morahan, A. Aleman, R. Vogel, S. Leicester, H. Weir, M. Meaux, S. Grebas, C.Solomon, M. Holland, T. Northcutt, R. A. Restrepo, R. Bilodeau, 2013. NASA/Global Change Master Directory (GCMD) Earth Science Keywords. Version 8.0.0.0.0
https://svs.gsfc.nasa.gov/2927
Data Used:
DMSP/SSM/I/15% Mean Sea Ice Extent Contour for September also referred to as: Passive Microwave Data
1979-2002Nimbus-7/SSMR/15% Mean Sea Ice Extent Contour for September also referred to as: Passive Microwave Data
Septembers during 1979-2002DMSP/SSM/I/September Mean Sea Ice Extent
1979 - 2003This item is part of this series:
Cryosphere 2004
Keywords:
SVS >> Anomaly
DLESE >> Cryology
SVS >> Sea Ice
GCMD >> Earth Science >> Hydrosphere
GCMD >> Earth Science >> Cryosphere >> Sea Ice
SVS >> For Educators
SVS >> Oceans >> Freeze/thaw
SVS >> Cryosphere >> Snow/ice
SVS >> Hydrosphere >> Ice
NASA Science >> Earth
GCMD keywords can be found on the Internet with the following citation: Olsen, L.M., G. Major, K. Shein, J. Scialdone, S. Ritz, T. Stevens, M. Morahan, A. Aleman, R. Vogel, S. Leicester, H. Weir, M. Meaux, S. Grebas, C.Solomon, M. Holland, T. Northcutt, R. A. Restrepo, R. Bilodeau, 2013. NASA/Global Change Master Directory (GCMD) Earth Science Keywords. Version 8.0.0.0.0


