Earth
ID: 2906
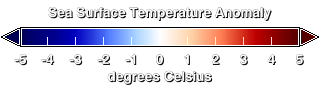
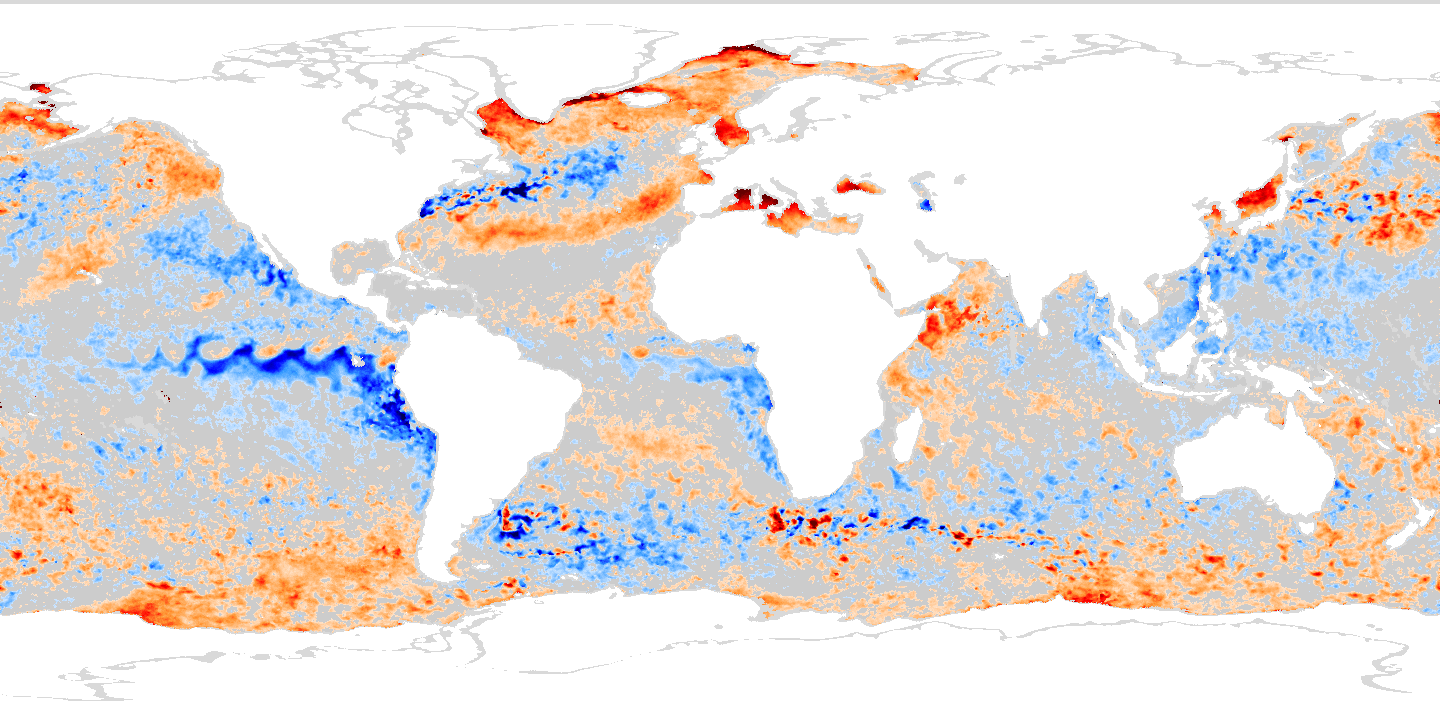
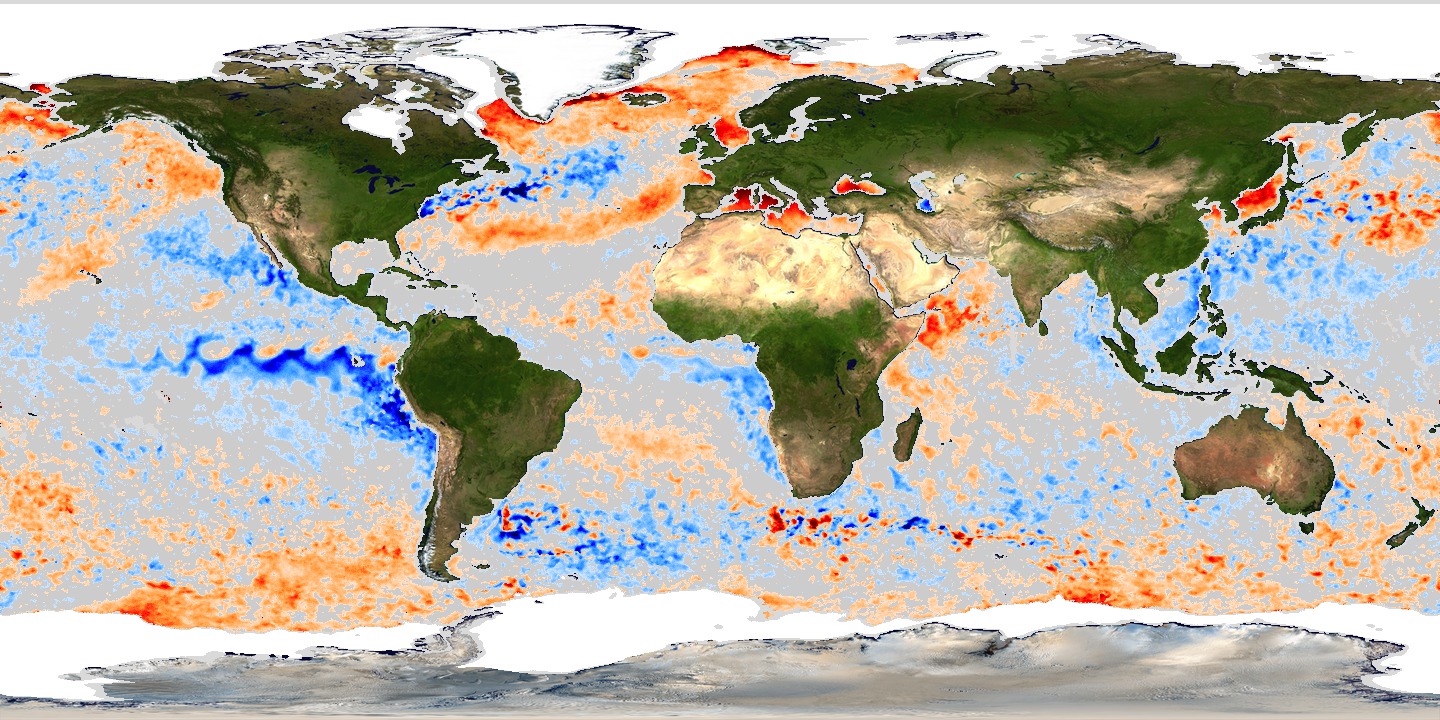
The temperature of the surface of the world's oceans provides a clear indication of the state of the Earth's climate and weather. The AMSR-E instrument on the Aqua satellite measures the temperature of the top 1 millimeter of the ocean every day, even through the clouds. If the average sea surface temperature for a particular date is subtracted from the measured temperature for that date, the resulting sea surface temperature anomaly can be used to accurately assess the current state of the oceans. The anomaly can serve as an early warning system for weather phenomena and can be used to indicate forthcoming problems with fish populations and coral reef health. In this visualization of the anomaly covering the period from June, 2002, to September, 2003, the most obvious effects are a successive warming and cooling along the equator to the west of Peru, the signature of an El Niño/La Niña cycle. Around January 1, 2003, a cooler than normal region of the ocean appears in this region as part of a La Niña and flows westward, driven by the trade winds. The waves that appear on the edges of this cooler area are called tropical instability waves.
Global Sea Surface Temperature Anomalies from June, 2002 to September, 2003 (WMS)
For More Information
Visualization Credits
Eric Sokolowsky (GST): Lead Animator
Greg Shirah (NASA/GSFC): Animator
Jesse Allen (Raytheon): Animator
Frank J. Wentz (Remote Sensing Systems): Scientist
Chelle Gentemann (Remote Sensing Systems): Scientist
Greg Shirah (NASA/GSFC): Animator
Jesse Allen (Raytheon): Animator
Frank J. Wentz (Remote Sensing Systems): Scientist
Chelle Gentemann (Remote Sensing Systems): Scientist
Please give credit for this item to:
NASA/Goddard Space Flight Center Scientific Visualization Studio
NASA/Goddard Space Flight Center Scientific Visualization Studio
Short URL to share this page:
https://svs.gsfc.nasa.gov/2906
Data Used:
Note: While we identify the data sets used in these visualizations, we do not store any further details nor the data sets themselves on our site.
This item is part of this series:
WMS
Keywords:
SVS >> HDTV
DLESE >> Physical oceanography
SVS >> Sea Surface Temperature Anomaly
GCMD >> Earth Science >> Hydrosphere
GCMD >> Earth Science >> Oceans >> Ocean Temperature >> Sea Surface Temperature
SVS >> For Educators
SVS >> Hydrosphere >> Ice
NASA Science >> Earth
GCMD keywords can be found on the Internet with the following citation: Olsen, L.M., G. Major, K. Shein, J. Scialdone, S. Ritz, T. Stevens, M. Morahan, A. Aleman, R. Vogel, S. Leicester, H. Weir, M. Meaux, S. Grebas, C.Solomon, M. Holland, T. Northcutt, R. A. Restrepo, R. Bilodeau, 2013. NASA/Global Change Master Directory (GCMD) Earth Science Keywords. Version 8.0.0.0.0
https://svs.gsfc.nasa.gov/2906
Data Used:
Aqua/AMSR-E
2002/06/02 - 2003/09/07
For more information, please click http://wwwghcc.msfc.nasa.gov/AMSR/
This item is part of this series:
WMS
Keywords:
SVS >> HDTV
DLESE >> Physical oceanography
SVS >> Sea Surface Temperature Anomaly
GCMD >> Earth Science >> Hydrosphere
GCMD >> Earth Science >> Oceans >> Ocean Temperature >> Sea Surface Temperature
SVS >> For Educators
SVS >> Hydrosphere >> Ice
NASA Science >> Earth
GCMD keywords can be found on the Internet with the following citation: Olsen, L.M., G. Major, K. Shein, J. Scialdone, S. Ritz, T. Stevens, M. Morahan, A. Aleman, R. Vogel, S. Leicester, H. Weir, M. Meaux, S. Grebas, C.Solomon, M. Holland, T. Northcutt, R. A. Restrepo, R. Bilodeau, 2013. NASA/Global Change Master Directory (GCMD) Earth Science Keywords. Version 8.0.0.0.0


