Earth
ID: 2897
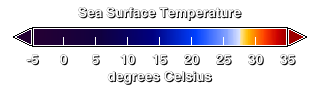
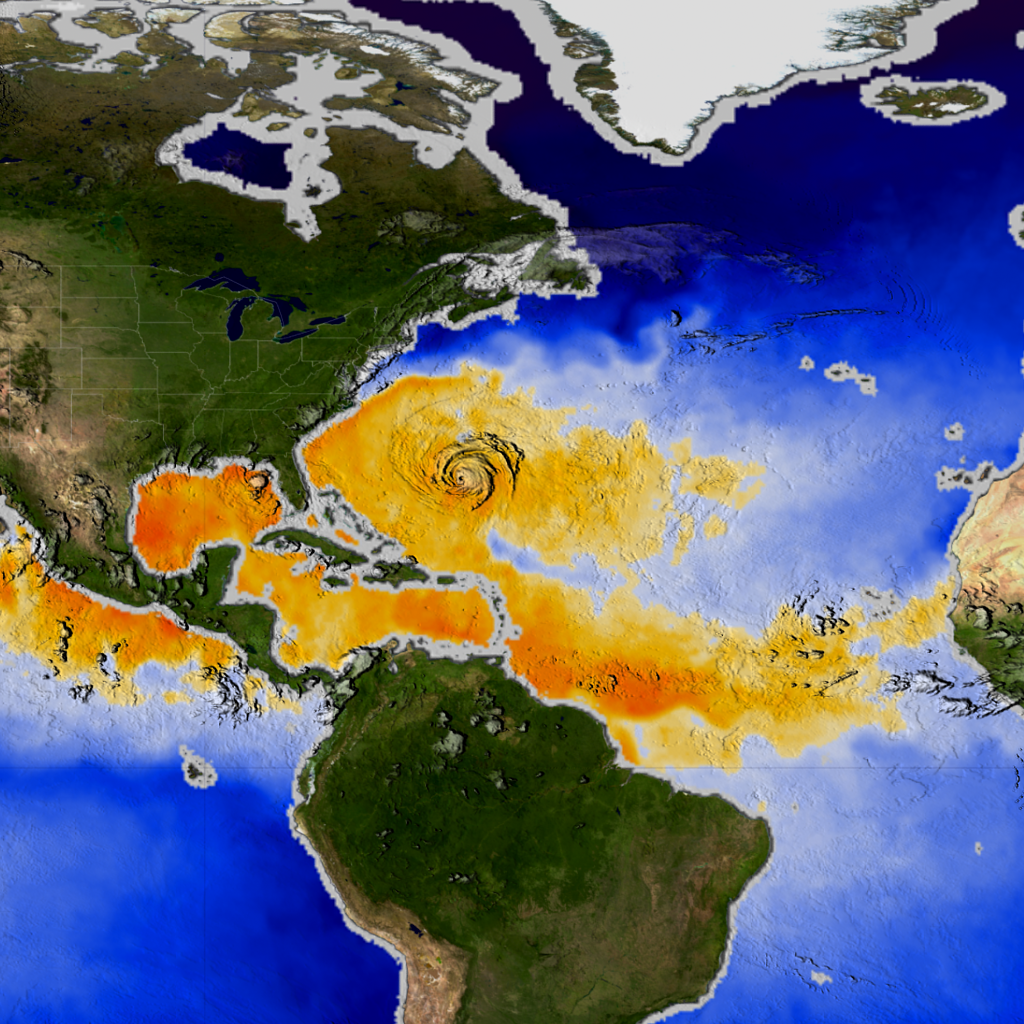
This visualization shows the cold water trails left first by Hurricanes Fabian and then by Hurricane Isabel in the Atlantic Ocean from August 27, 2003 through September 23, 2003. The colors on the ocean represent the sea surface temperatures, and satellite images of the hurricane clouds are laid over the temperatures to clearly show the hurricane positions. Orange and red depict regions that are 82 degrees F and higher, where the ocean is warm enough for hurricanes to form. Hurricane winds are sustained by the heat energy of the ocean, so the ocean is cooled as the hurricane passes and the energy is extracted to power the winds. A hurricane can experience a dramatic reduction in wind speed when it crosses the cold track of a previous hurricane. However, in this case, the cold water track from Fabian warmed up before Isabel crossed it, so Isabel's winds did not decrease. The sea surface temperatures were measured by the AMSR-E instrument on the Aqua satellite, while the cloud images were taken by the Imager on the GOES-12 satellite.
Cold Water Trails from Hurricanes Fabian and Isabel (WMS)
For More Information
Visualization Credits
Eric Sokolowsky (GST): Lead Animator
Greg Shirah (NASA/GSFC): Animator
Alex Kekesi (Global Science and Technology, Inc.): Animator
Jesse Allen (Raytheon): Animator
Marte Newcombe (GST): Animator
Stuart A. Snodgrass (GST): Animator
Kevin Mahoney (CSC): Animator
J. Marshall Shepherd (NASA/GSFC): Scientist
Greg Shirah (NASA/GSFC): Animator
Alex Kekesi (Global Science and Technology, Inc.): Animator
Jesse Allen (Raytheon): Animator
Marte Newcombe (GST): Animator
Stuart A. Snodgrass (GST): Animator
Kevin Mahoney (CSC): Animator
J. Marshall Shepherd (NASA/GSFC): Scientist
Please give credit for this item to:
NASA/Goddard Space Flight Center Scientific Visualization Studio The Blue Marble Next Generation data is courtesy of Reto Stockli (NASA/GSFC) and NASA's Earth Observatory.
NASA/Goddard Space Flight Center Scientific Visualization Studio The Blue Marble Next Generation data is courtesy of Reto Stockli (NASA/GSFC) and NASA's Earth Observatory.
Short URL to share this page:
https://svs.gsfc.nasa.gov/2897
Mission:
Terra
Data Used:
Note: While we identify the data sets used in these visualizations, we do not store any further details nor the data sets themselves on our site.
This item is part of this series:
WMS
Keywords:
DLESE >> Atmospheric science
SVS >> HDTV
DLESE >> Natural hazards
GCMD >> Earth Science >> Hydrosphere
GCMD >> Earth Science >> Atmosphere >> Atmospheric Phenomena >> Hurricanes
GCMD >> Earth Science >> Human Dimensions >> Natural Hazards >> Meteorological Hazards
GCMD >> Earth Science >> Oceans >> Ocean Circulation >> Ocean Currents
GCMD >> Earth Science >> Oceans >> Ocean Temperature >> Sea Surface Temperature
SVS >> GOES
SVS >> For Educators
SVS >> Ocean-Atmosphere-Land Interactions
SVS >> Hydrosphere >> Ice
NASA Science >> Earth
GCMD keywords can be found on the Internet with the following citation: Olsen, L.M., G. Major, K. Shein, J. Scialdone, S. Ritz, T. Stevens, M. Morahan, A. Aleman, R. Vogel, S. Leicester, H. Weir, M. Meaux, S. Grebas, C.Solomon, M. Holland, T. Northcutt, R. A. Restrepo, R. Bilodeau, 2013. NASA/Global Change Master Directory (GCMD) Earth Science Keywords. Version 8.0.0.0.0
https://svs.gsfc.nasa.gov/2897
Mission:
Terra
Data Used:
Aqua/AMSR-E
2003/08/27 - 2003/09/21
For more information, please click http://wwwghcc.msfc.nasa.gov/AMSR/
GOES/IR4
2003/08/27 - 2003/09/21Terra/MODIS
2003/08/27 - 2003/09/21Terra and Aqua/MODIS/Blue Marble: Next Generation also referred to as: BMNG
1/1/2004 - 12/31/2004
Credit:
The Blue Marble data is courtesy of Reto Stockli (NASA/GSFC).
The Blue Marble data is courtesy of Reto Stockli (NASA/GSFC).
This item is part of this series:
WMS
Keywords:
DLESE >> Atmospheric science
SVS >> HDTV
DLESE >> Natural hazards
GCMD >> Earth Science >> Hydrosphere
GCMD >> Earth Science >> Atmosphere >> Atmospheric Phenomena >> Hurricanes
GCMD >> Earth Science >> Human Dimensions >> Natural Hazards >> Meteorological Hazards
GCMD >> Earth Science >> Oceans >> Ocean Circulation >> Ocean Currents
GCMD >> Earth Science >> Oceans >> Ocean Temperature >> Sea Surface Temperature
SVS >> GOES
SVS >> For Educators
SVS >> Ocean-Atmosphere-Land Interactions
SVS >> Hydrosphere >> Ice
NASA Science >> Earth
GCMD keywords can be found on the Internet with the following citation: Olsen, L.M., G. Major, K. Shein, J. Scialdone, S. Ritz, T. Stevens, M. Morahan, A. Aleman, R. Vogel, S. Leicester, H. Weir, M. Meaux, S. Grebas, C.Solomon, M. Holland, T. Northcutt, R. A. Restrepo, R. Bilodeau, 2013. NASA/Global Change Master Directory (GCMD) Earth Science Keywords. Version 8.0.0.0.0


