Earth
ID: 2852
This visualization shows the progression of the southern California fires of October 2003. Visible MODIS imagery from Aqua and Terra are used as well as thermal data to show fire locations. Active fires for particular days are shown in red, fires that are no longer active are shown in black (highlighting the 'burn scar').
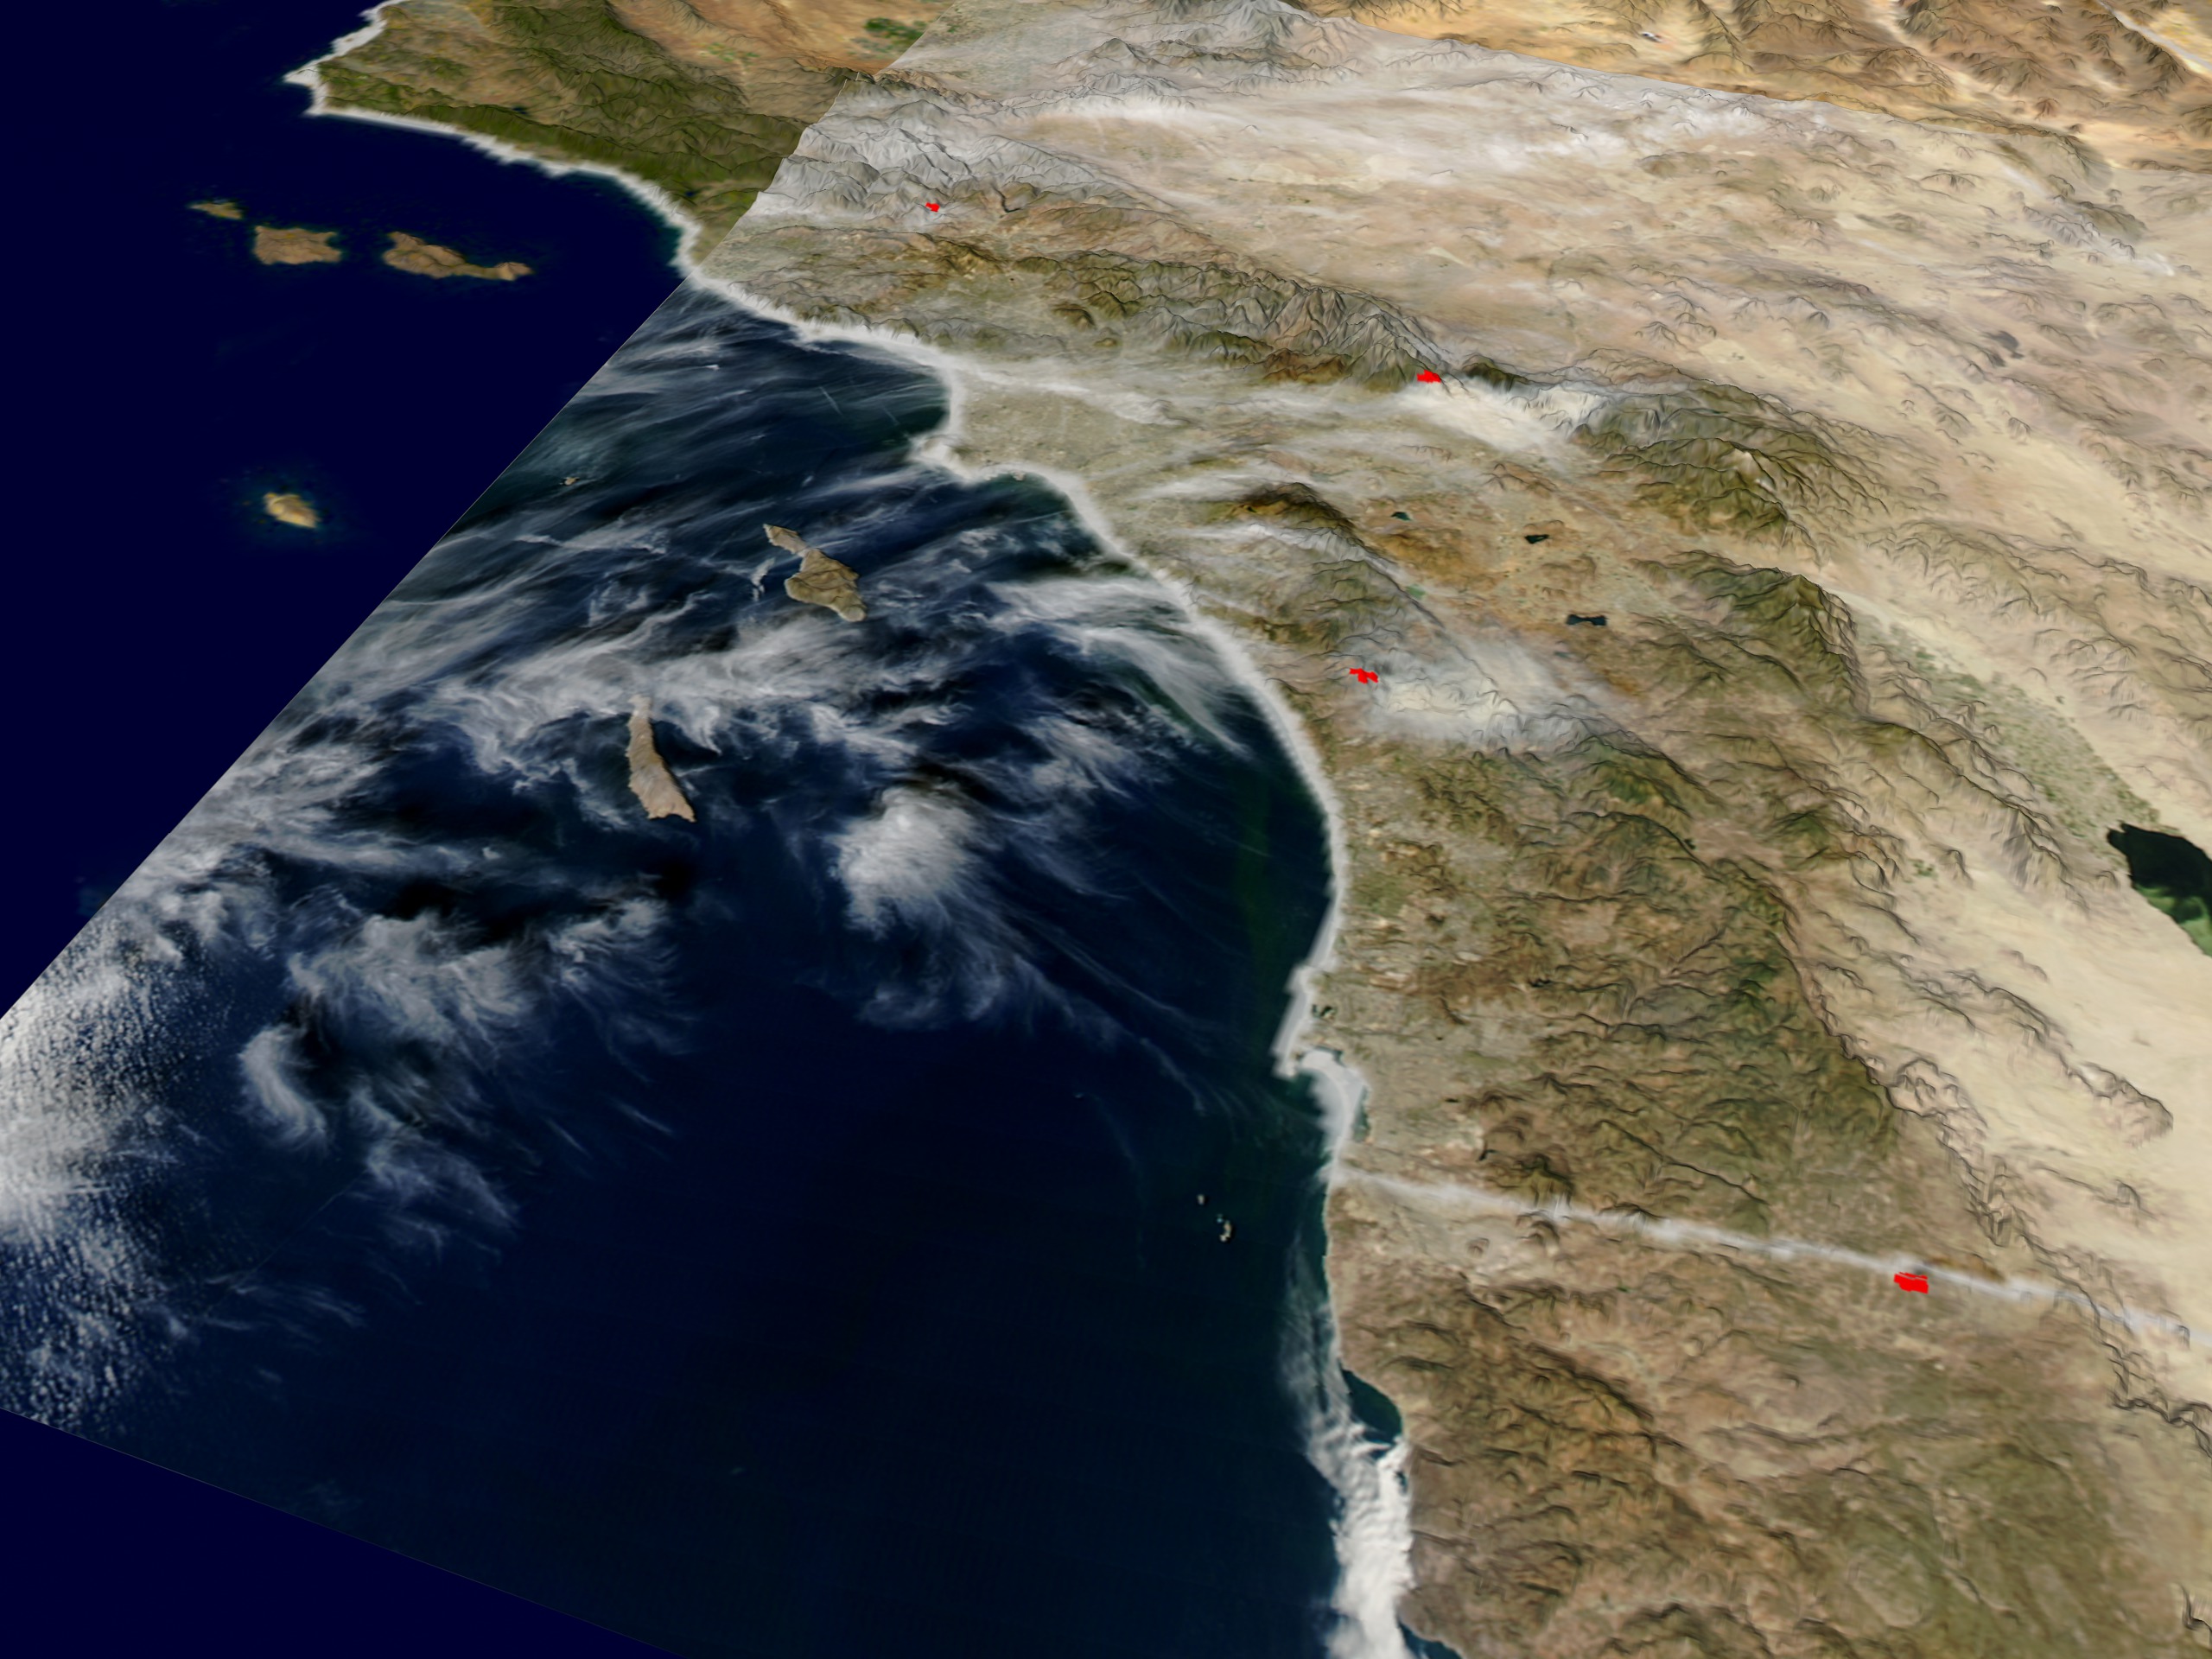
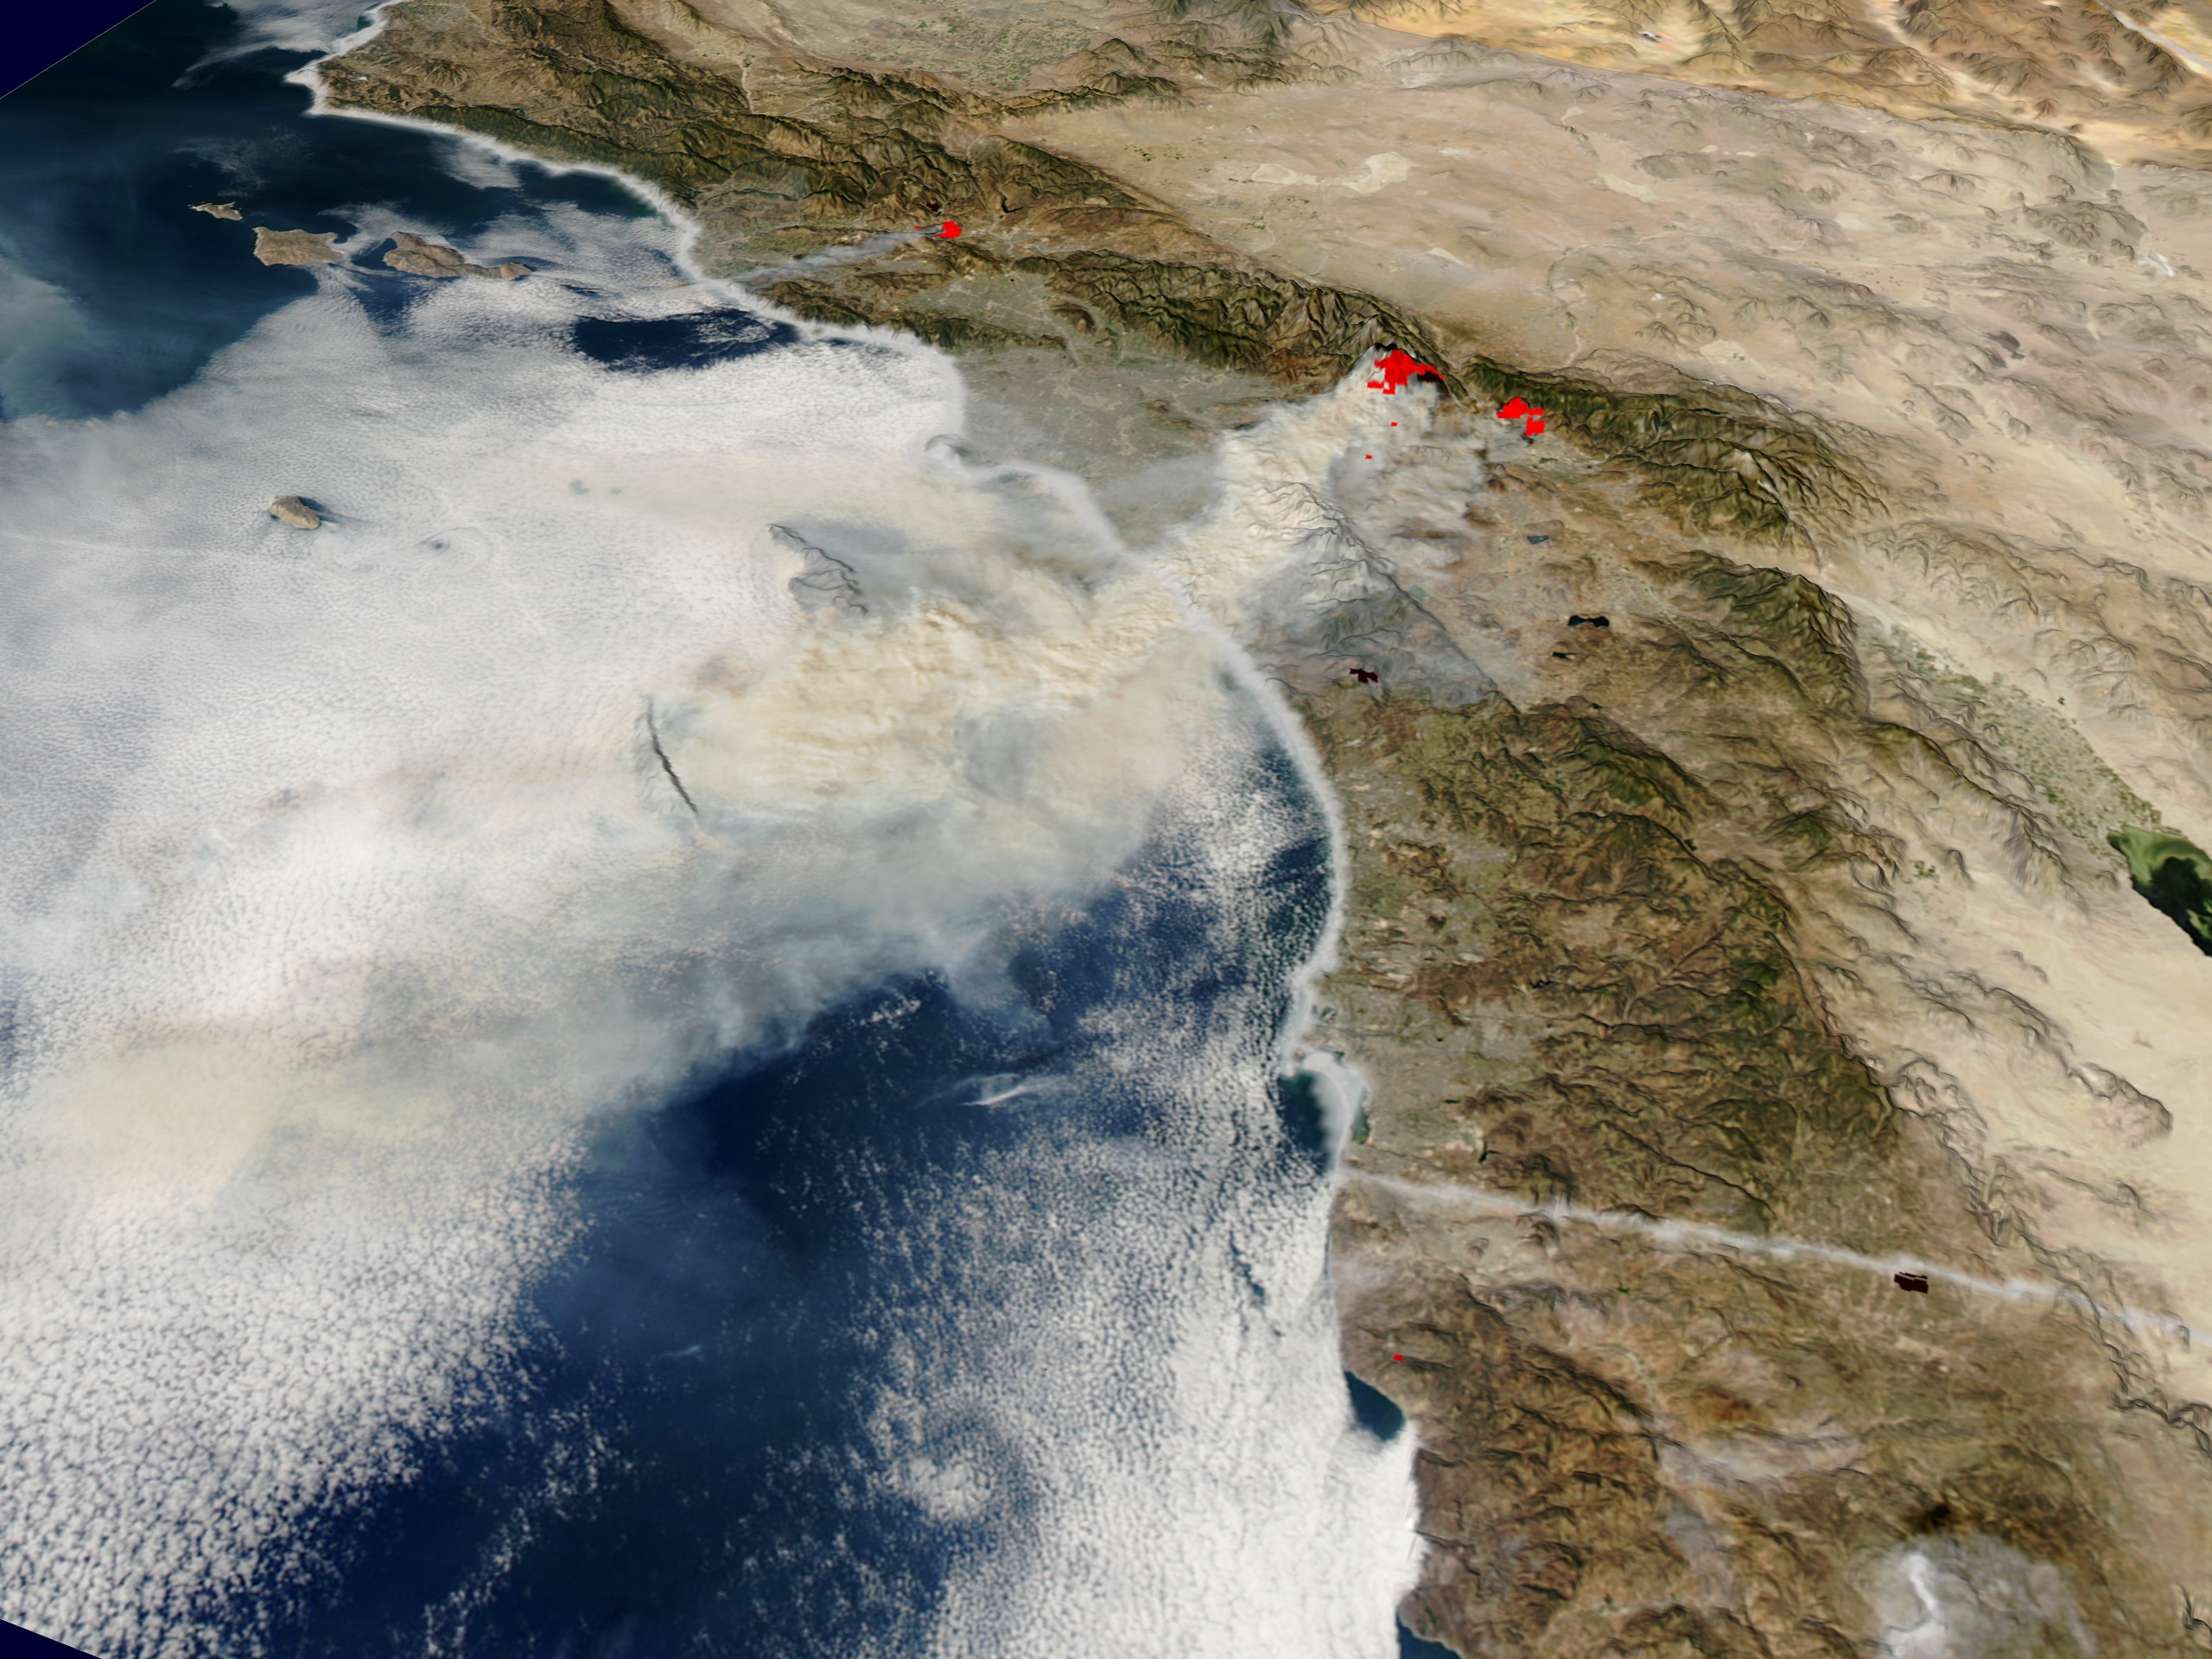

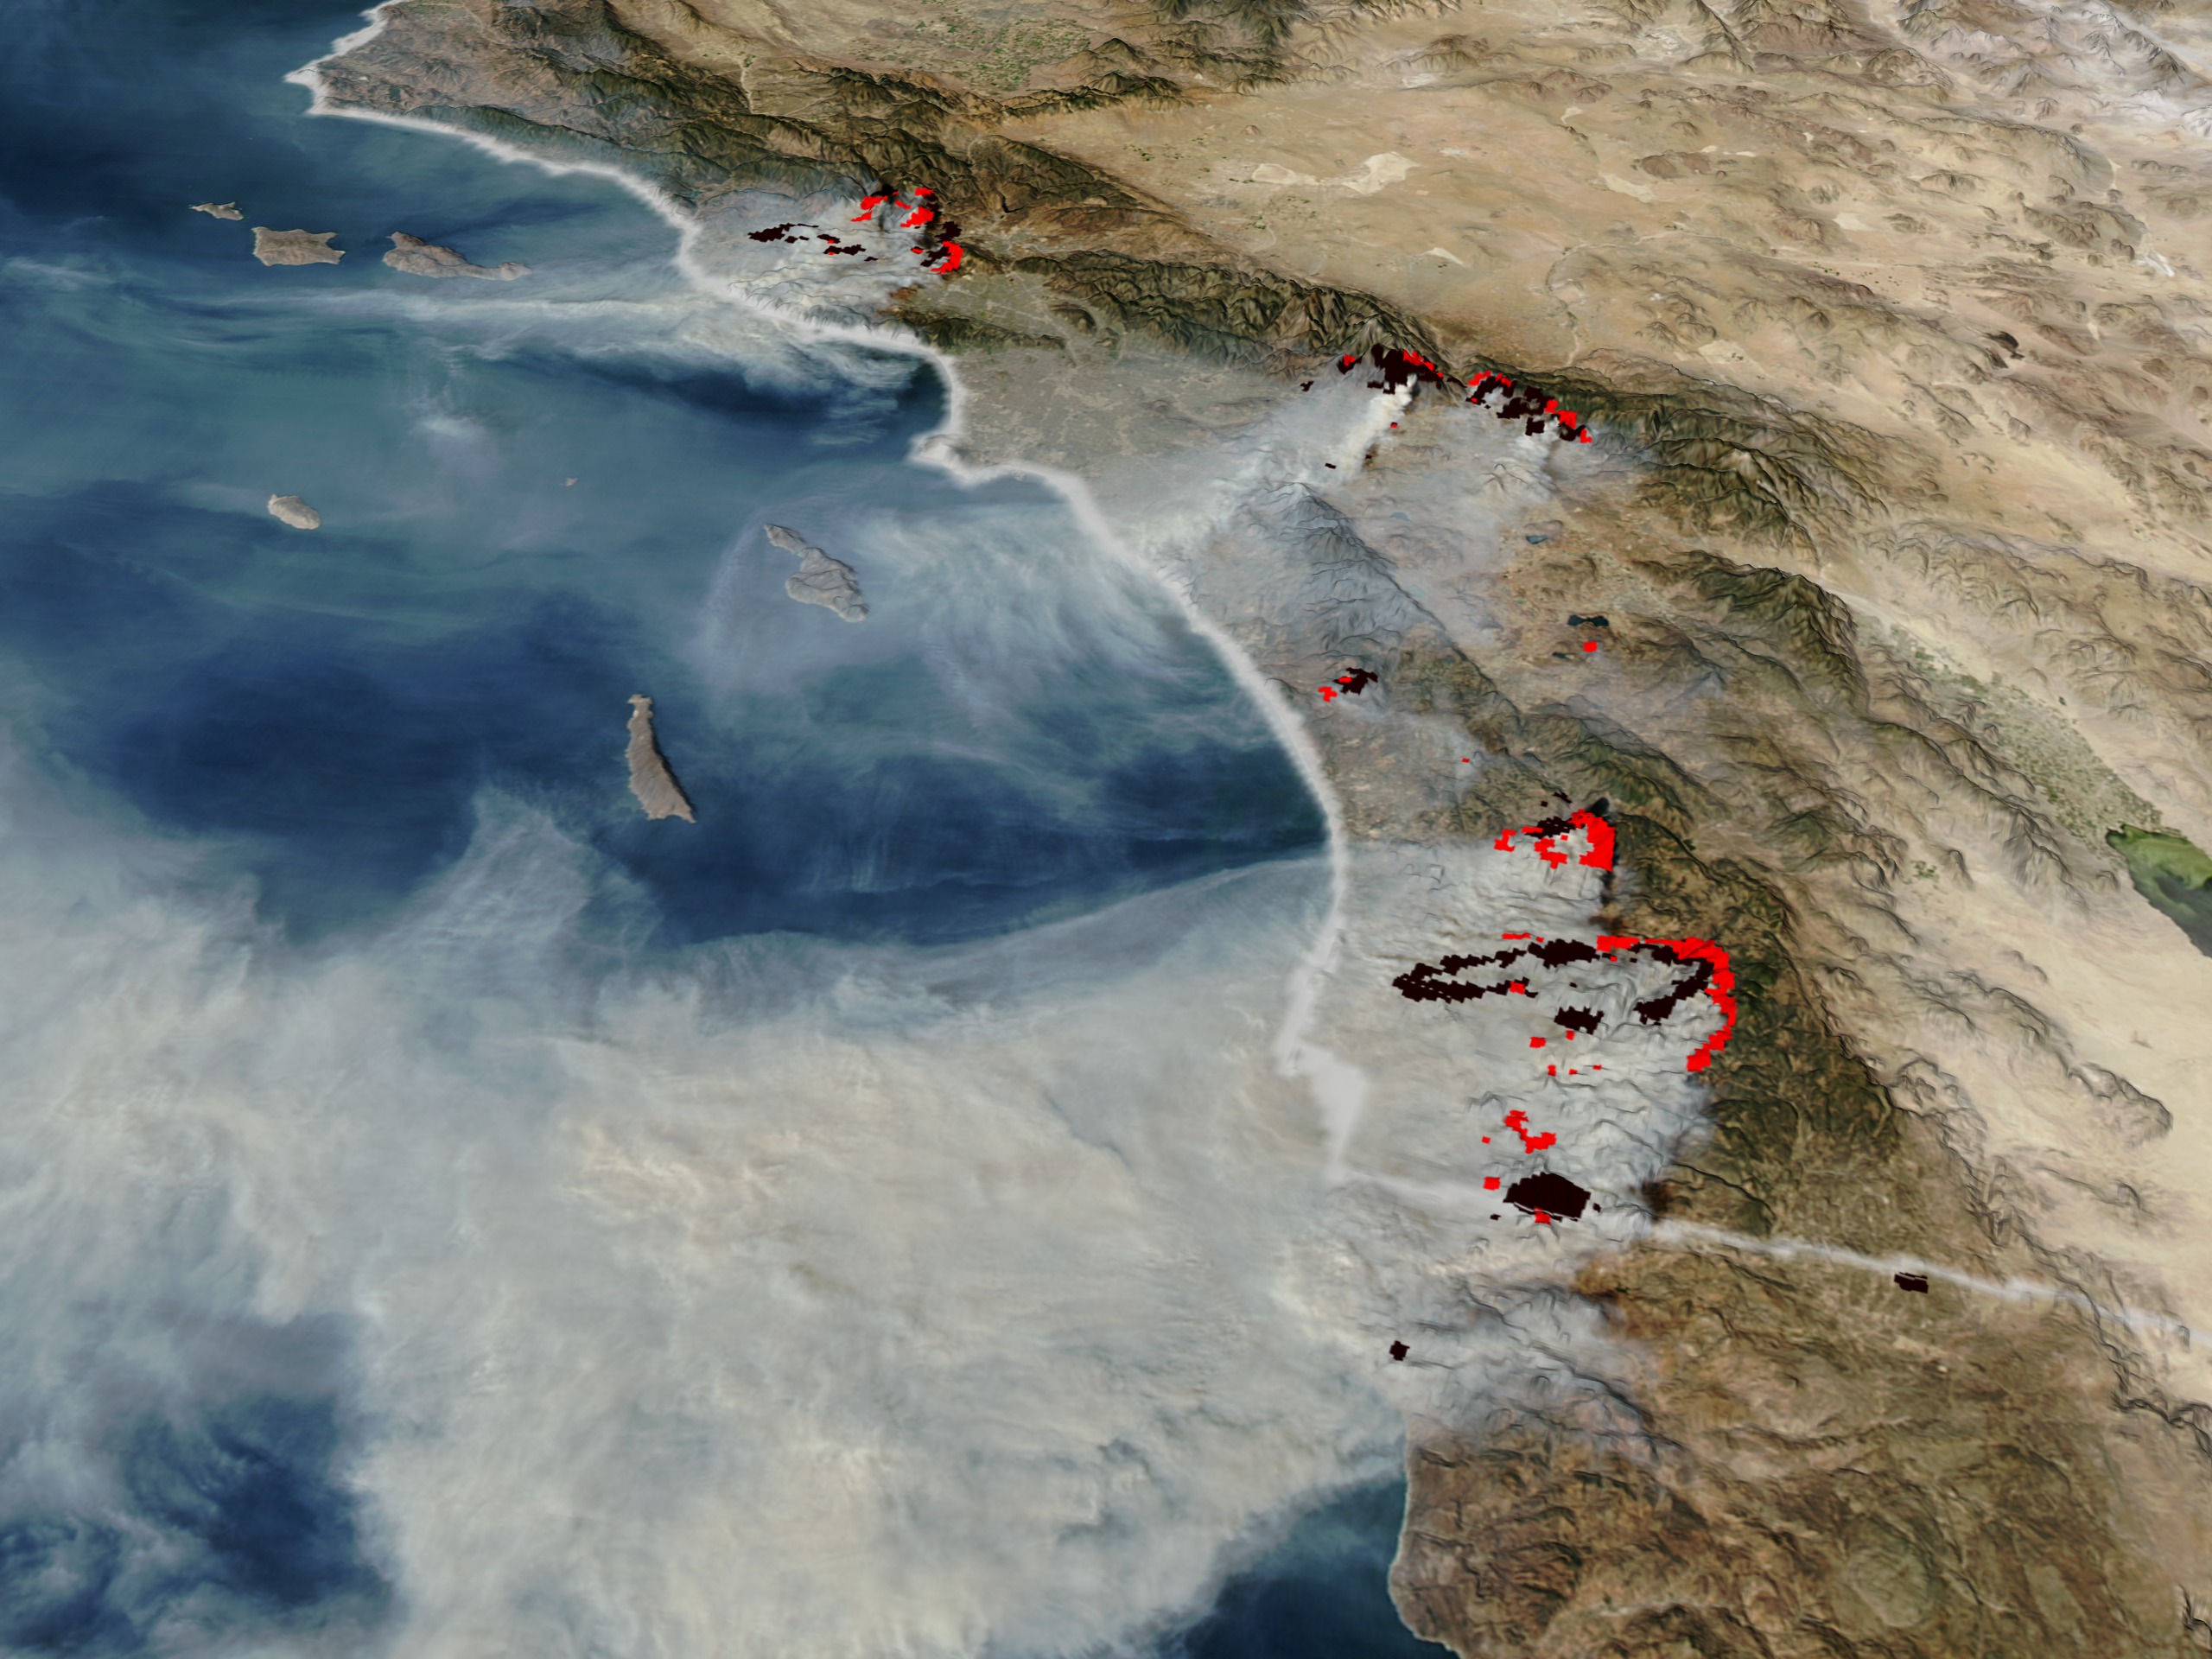
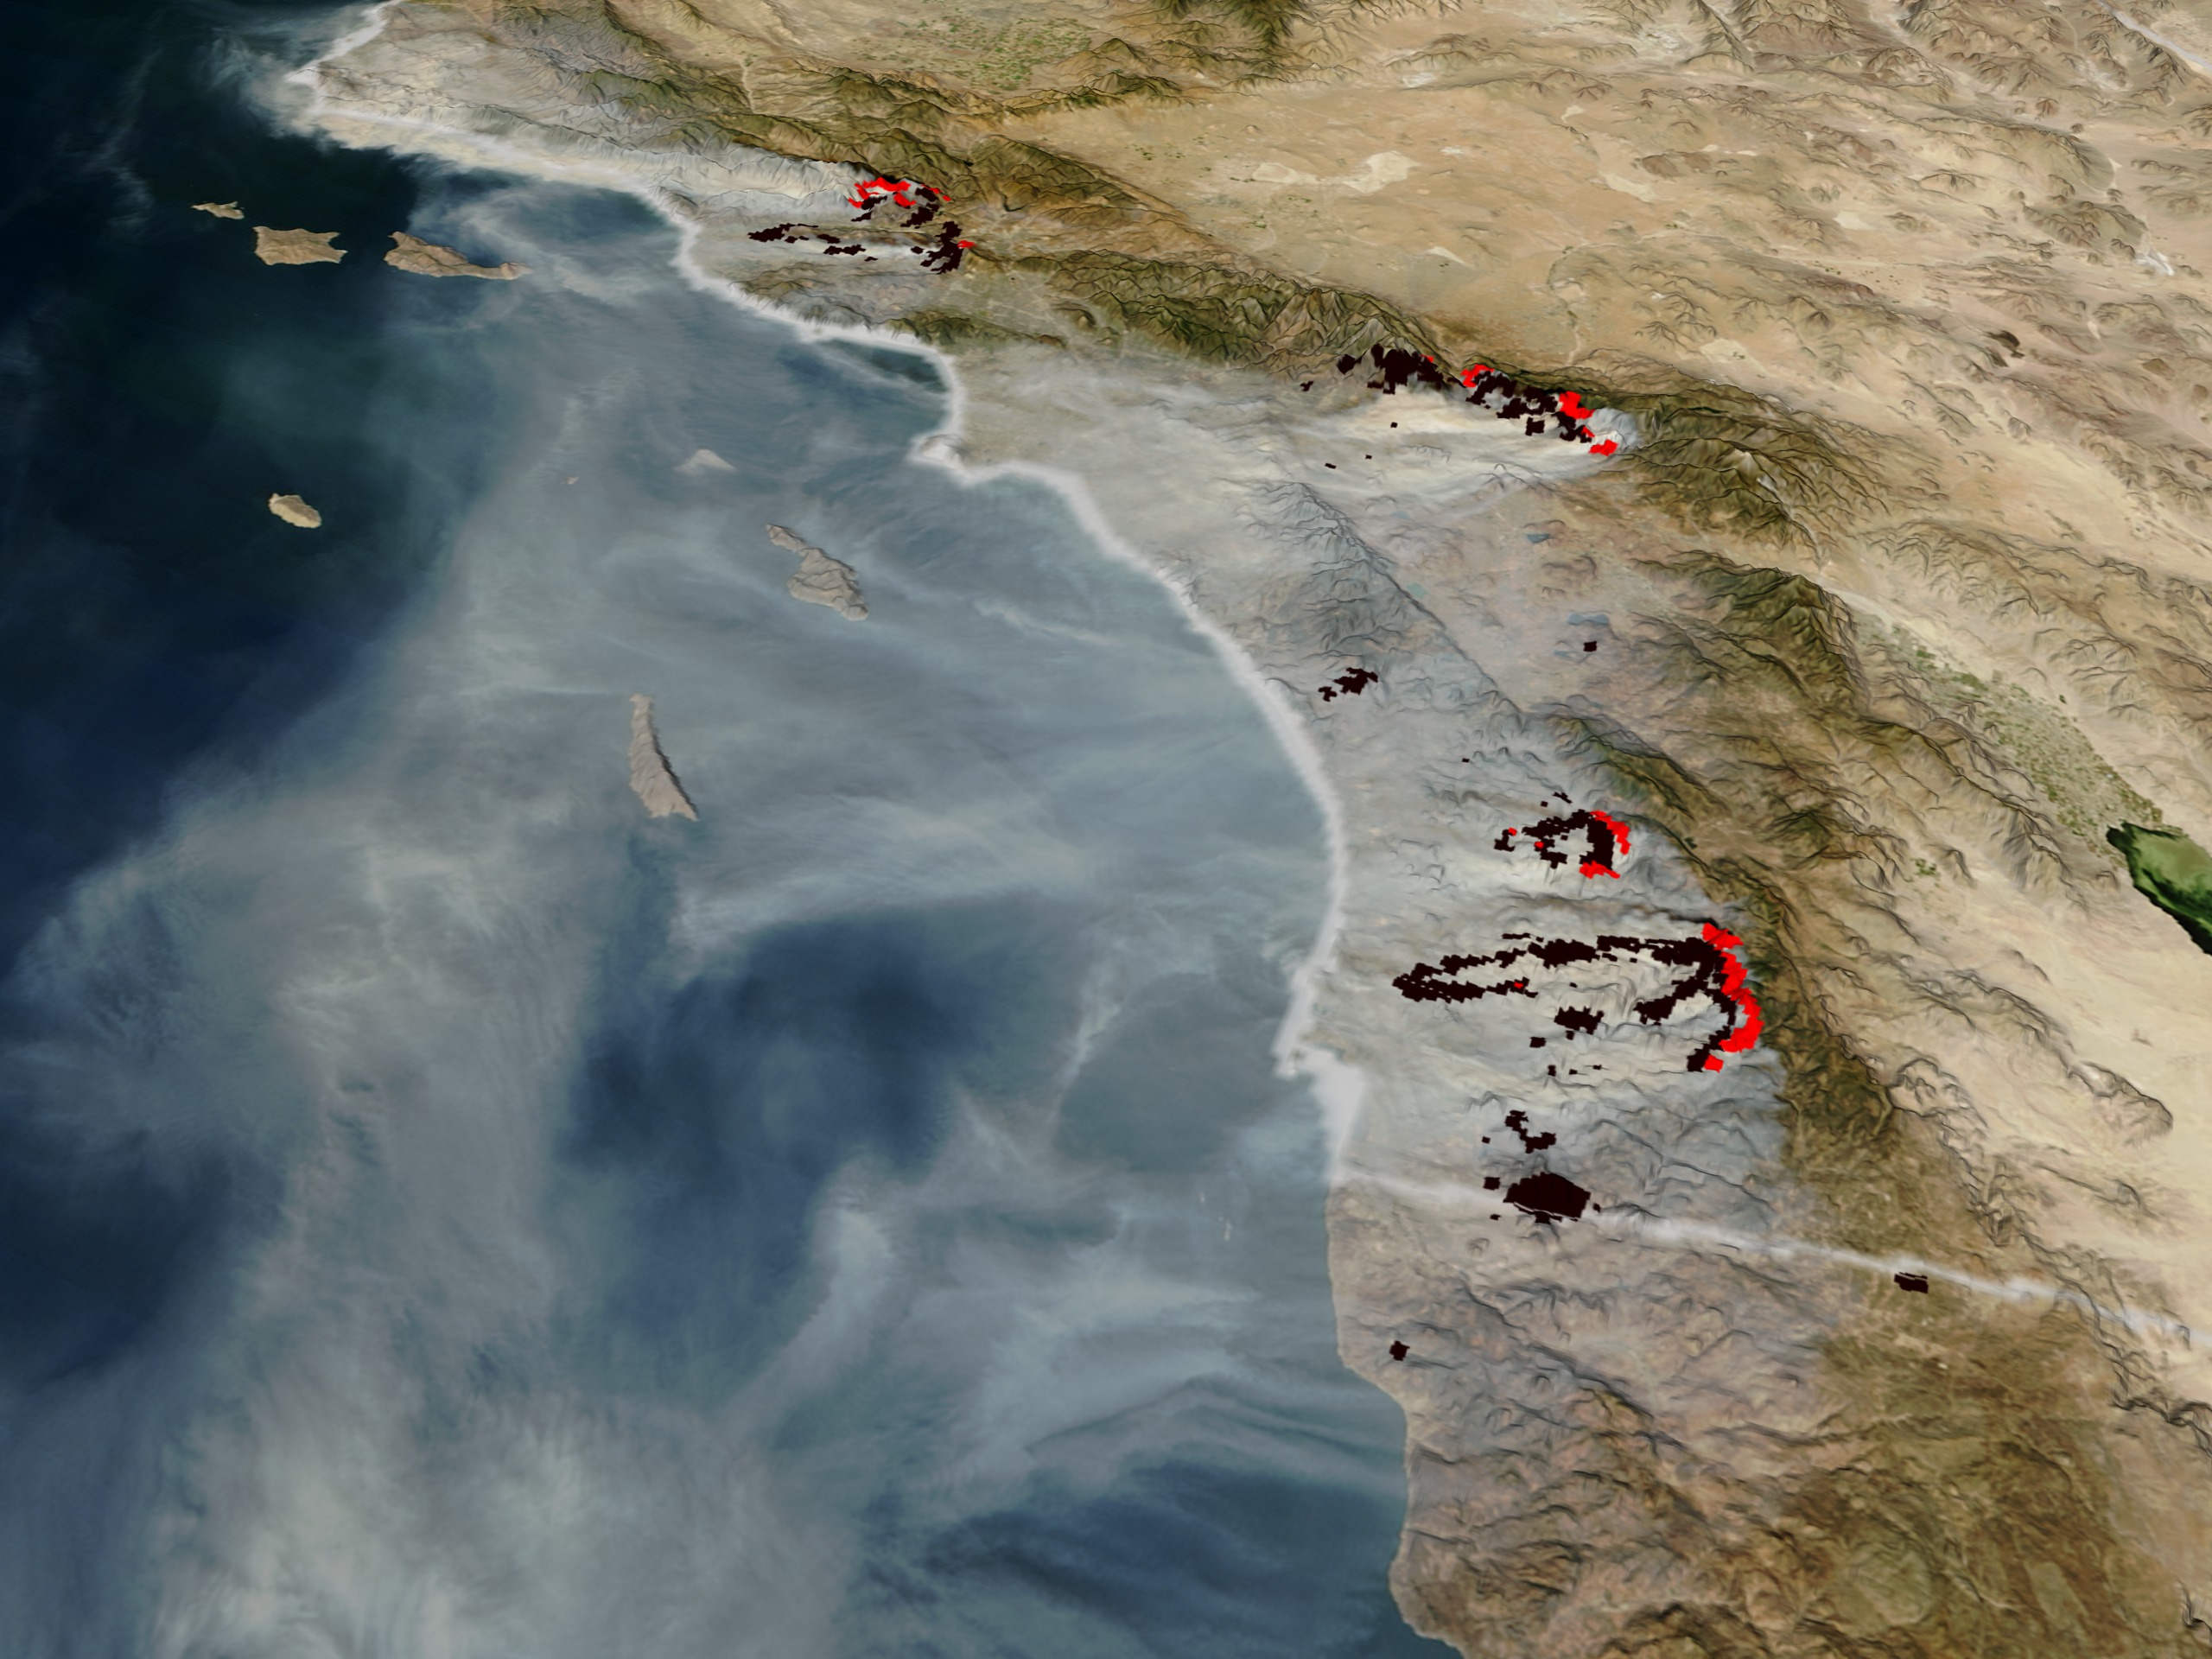

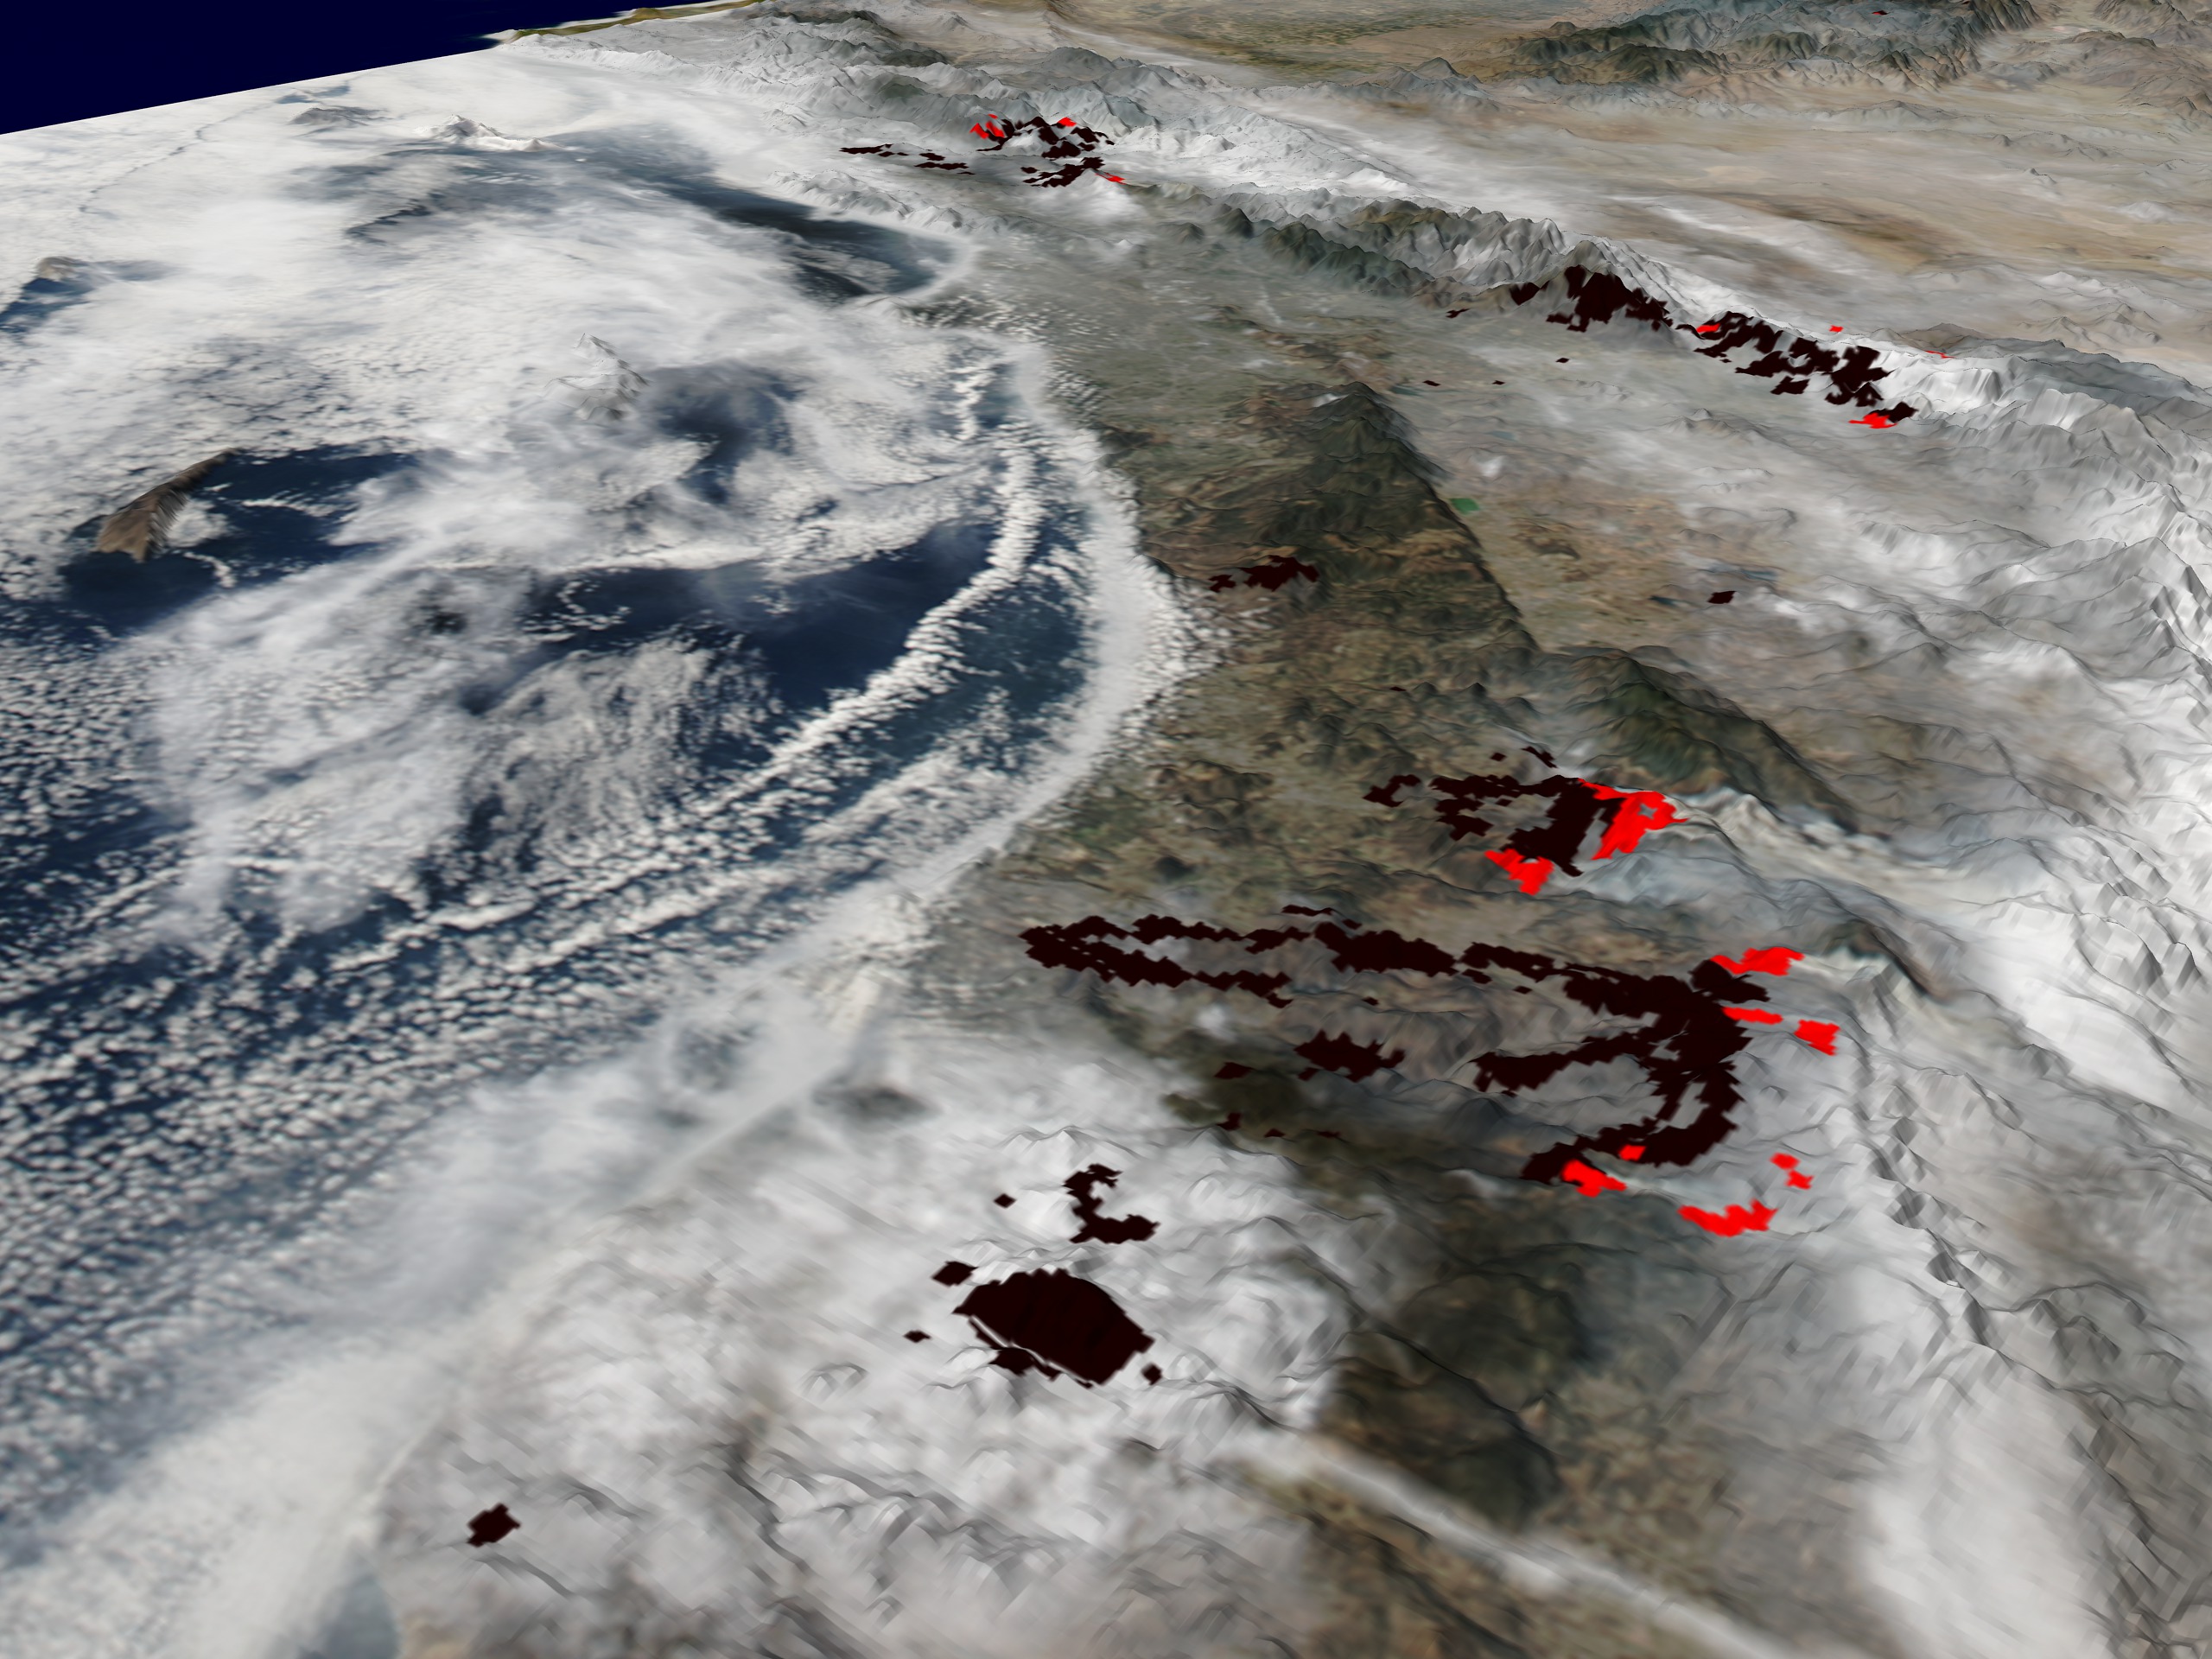
2003 California Fire Sequence as Seen by MODIS
Visualization Credits
Greg Shirah (NASA/GSFC): Lead Animator
Lori Perkins (NASA/GSFC): Animator
Stuart A. Snodgrass (GST): Animator
Lori Perkins (NASA/GSFC): Animator
Stuart A. Snodgrass (GST): Animator
Please give credit for this item to:
NASA/Goddard Space Flight Center Scientific Visualization Studio, MODIS Rapid Response Team, NASA Goddard Space Flight Center
NASA/Goddard Space Flight Center Scientific Visualization Studio, MODIS Rapid Response Team, NASA Goddard Space Flight Center
Short URL to share this page:
https://svs.gsfc.nasa.gov/2852
Mission:
Terra
Data Used:
Note: While we identify the data sets used in these visualizations, we do not store any further details nor the data sets themselves on our site.
Keywords:
GCMD >> Earth Science >> Biosphere >> Ecological Dynamics >> Fire Occurrence
NASA Science >> Earth
GCMD keywords can be found on the Internet with the following citation: Olsen, L.M., G. Major, K. Shein, J. Scialdone, S. Ritz, T. Stevens, M. Morahan, A. Aleman, R. Vogel, S. Leicester, H. Weir, M. Meaux, S. Grebas, C.Solomon, M. Holland, T. Northcutt, R. A. Restrepo, R. Bilodeau, 2013. NASA/Global Change Master Directory (GCMD) Earth Science Keywords. Version 8.0.0.0.0
https://svs.gsfc.nasa.gov/2852
Mission:
Terra
Data Used:
Terra/MODIS
2003/10/26, 2003/10/28, 2003/10/29Aqua/MODIS
2003/10/23, 2003/10/25, 2003/10/27Keywords:
GCMD >> Earth Science >> Biosphere >> Ecological Dynamics >> Fire Occurrence
NASA Science >> Earth
GCMD keywords can be found on the Internet with the following citation: Olsen, L.M., G. Major, K. Shein, J. Scialdone, S. Ritz, T. Stevens, M. Morahan, A. Aleman, R. Vogel, S. Leicester, H. Weir, M. Meaux, S. Grebas, C.Solomon, M. Holland, T. Northcutt, R. A. Restrepo, R. Bilodeau, 2013. NASA/Global Change Master Directory (GCMD) Earth Science Keywords. Version 8.0.0.0.0


