Earth
ID: 273
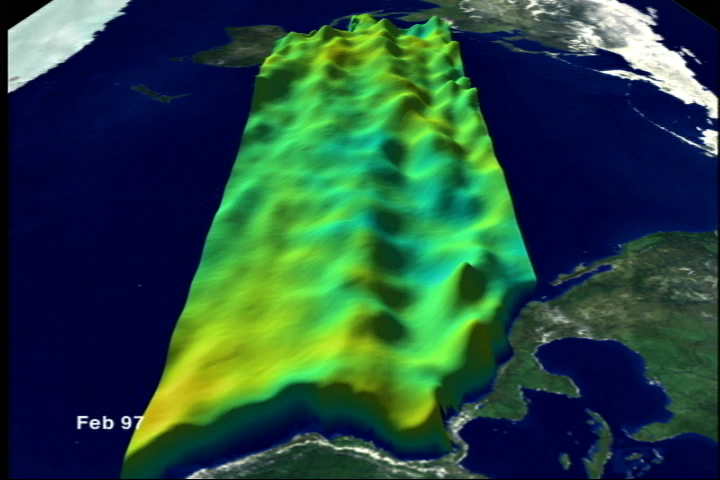
Sea surface temperature anomalies are in color with red being warmer than normal and blue being colder then normal. Sea surface height anomalies are shown as exaggerated heights.
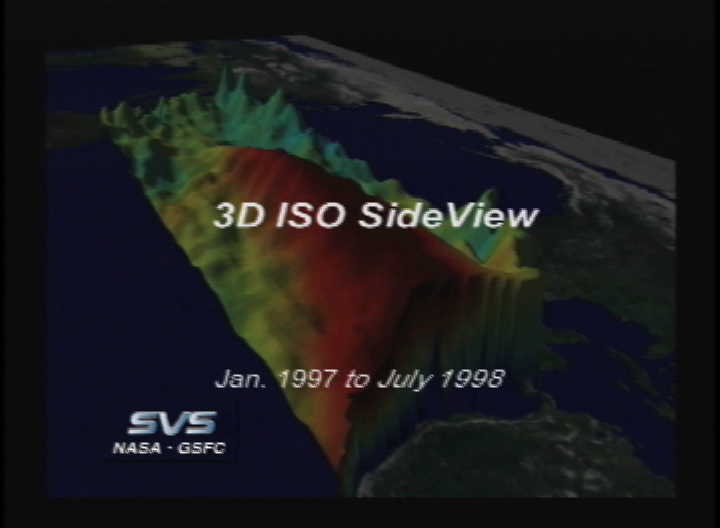
El Niño Sea Surface Temperature and Height Anomalies 3D Side View: January 1997 through July 1998
Visualization Credits
Please give credit for this item to:
NASA/Goddard Space Flight Center Scientific Visualization Studio
NASA/Goddard Space Flight Center Scientific Visualization Studio
Short URL to share this page:
https://svs.gsfc.nasa.gov/273
Data Used:
Note: While we identify the data sets used in these visualizations, we do not store any further details nor the data sets themselves on our site.
This item is part of this series:
El Niño and La Niña
Keywords:
DLESE >> Physical oceanography
NASA Science >> Earth
https://svs.gsfc.nasa.gov/273
Data Used:
TOPEX/Poseidon/Sea Surface Height Anomaly
1997/01/01-1998/07/31NOAA-14/AVHRR/NCEP Sea Surface Temperature Anomaly
1997/01/01-1998/07/31This item is part of this series:
El Niño and La Niña
Keywords:
DLESE >> Physical oceanography
NASA Science >> Earth


