Earth
ID: 271

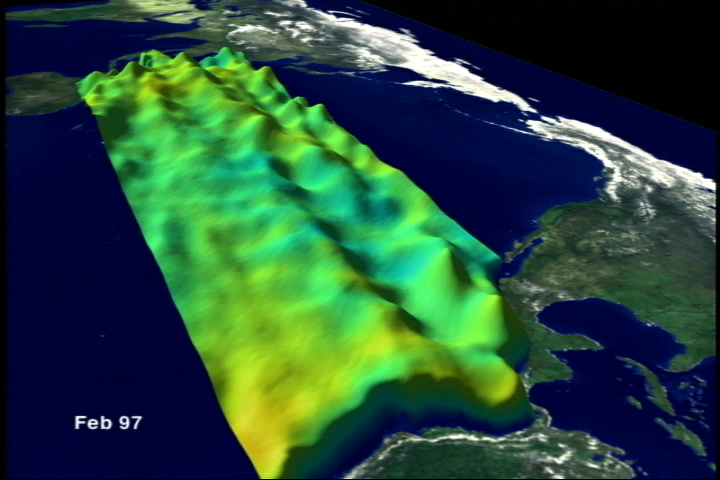
El Niño Sea Surface Temperature and Height Anomalies 3D Isometric View: Jan. 1997 through Jul. 1998
Visualization Credits
Please give credit for this item to:
NASA/Goddard Space Flight Center Scientific Visualization Studio
NASA/Goddard Space Flight Center Scientific Visualization Studio
Short URL to share this page:
https://svs.gsfc.nasa.gov/271
Data Used:
Note: While we identify the data sets used in these visualizations, we do not store any further details nor the data sets themselves on our site.
This item is part of this series:
El Niño and La Niña
Keywords:
DLESE >> Physical oceanography
NASA Science >> Earth
https://svs.gsfc.nasa.gov/271
Data Used:
NOAA-14/AVHRR/NCEP Sea Surface Temperature Anomaly
1997/01/01-1998/07/31TOPEX/Poseidon/Sea Surface Height Anomaly
1997/01/01-1998/07/31This item is part of this series:
El Niño and La Niña
Keywords:
DLESE >> Physical oceanography
NASA Science >> Earth


