Earth
ID: 2647
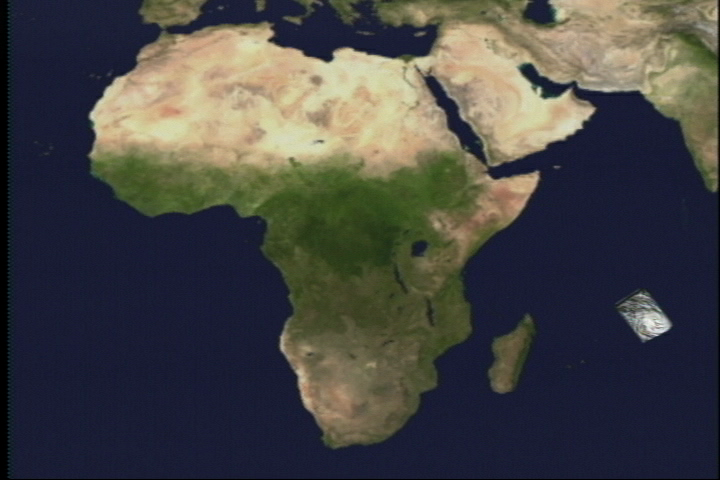
Tropical Cyclone Boura approaches Madagascar on November 17, 2002. The storm has intensified over night. The rain structure is depicted with 5 different isosurfaces. The first isosurface is gray and depicts areas with 0.5 inches of rain per hour. The second is light blue and reflects 1.0 inches of rain per hour. The third is green and shows 1.7 inches of rain per hour. The forth is yellow and represents 2.0 inches of rain per hour. The last isosurface is red and shows 2.2 inches or more of rain per hour.
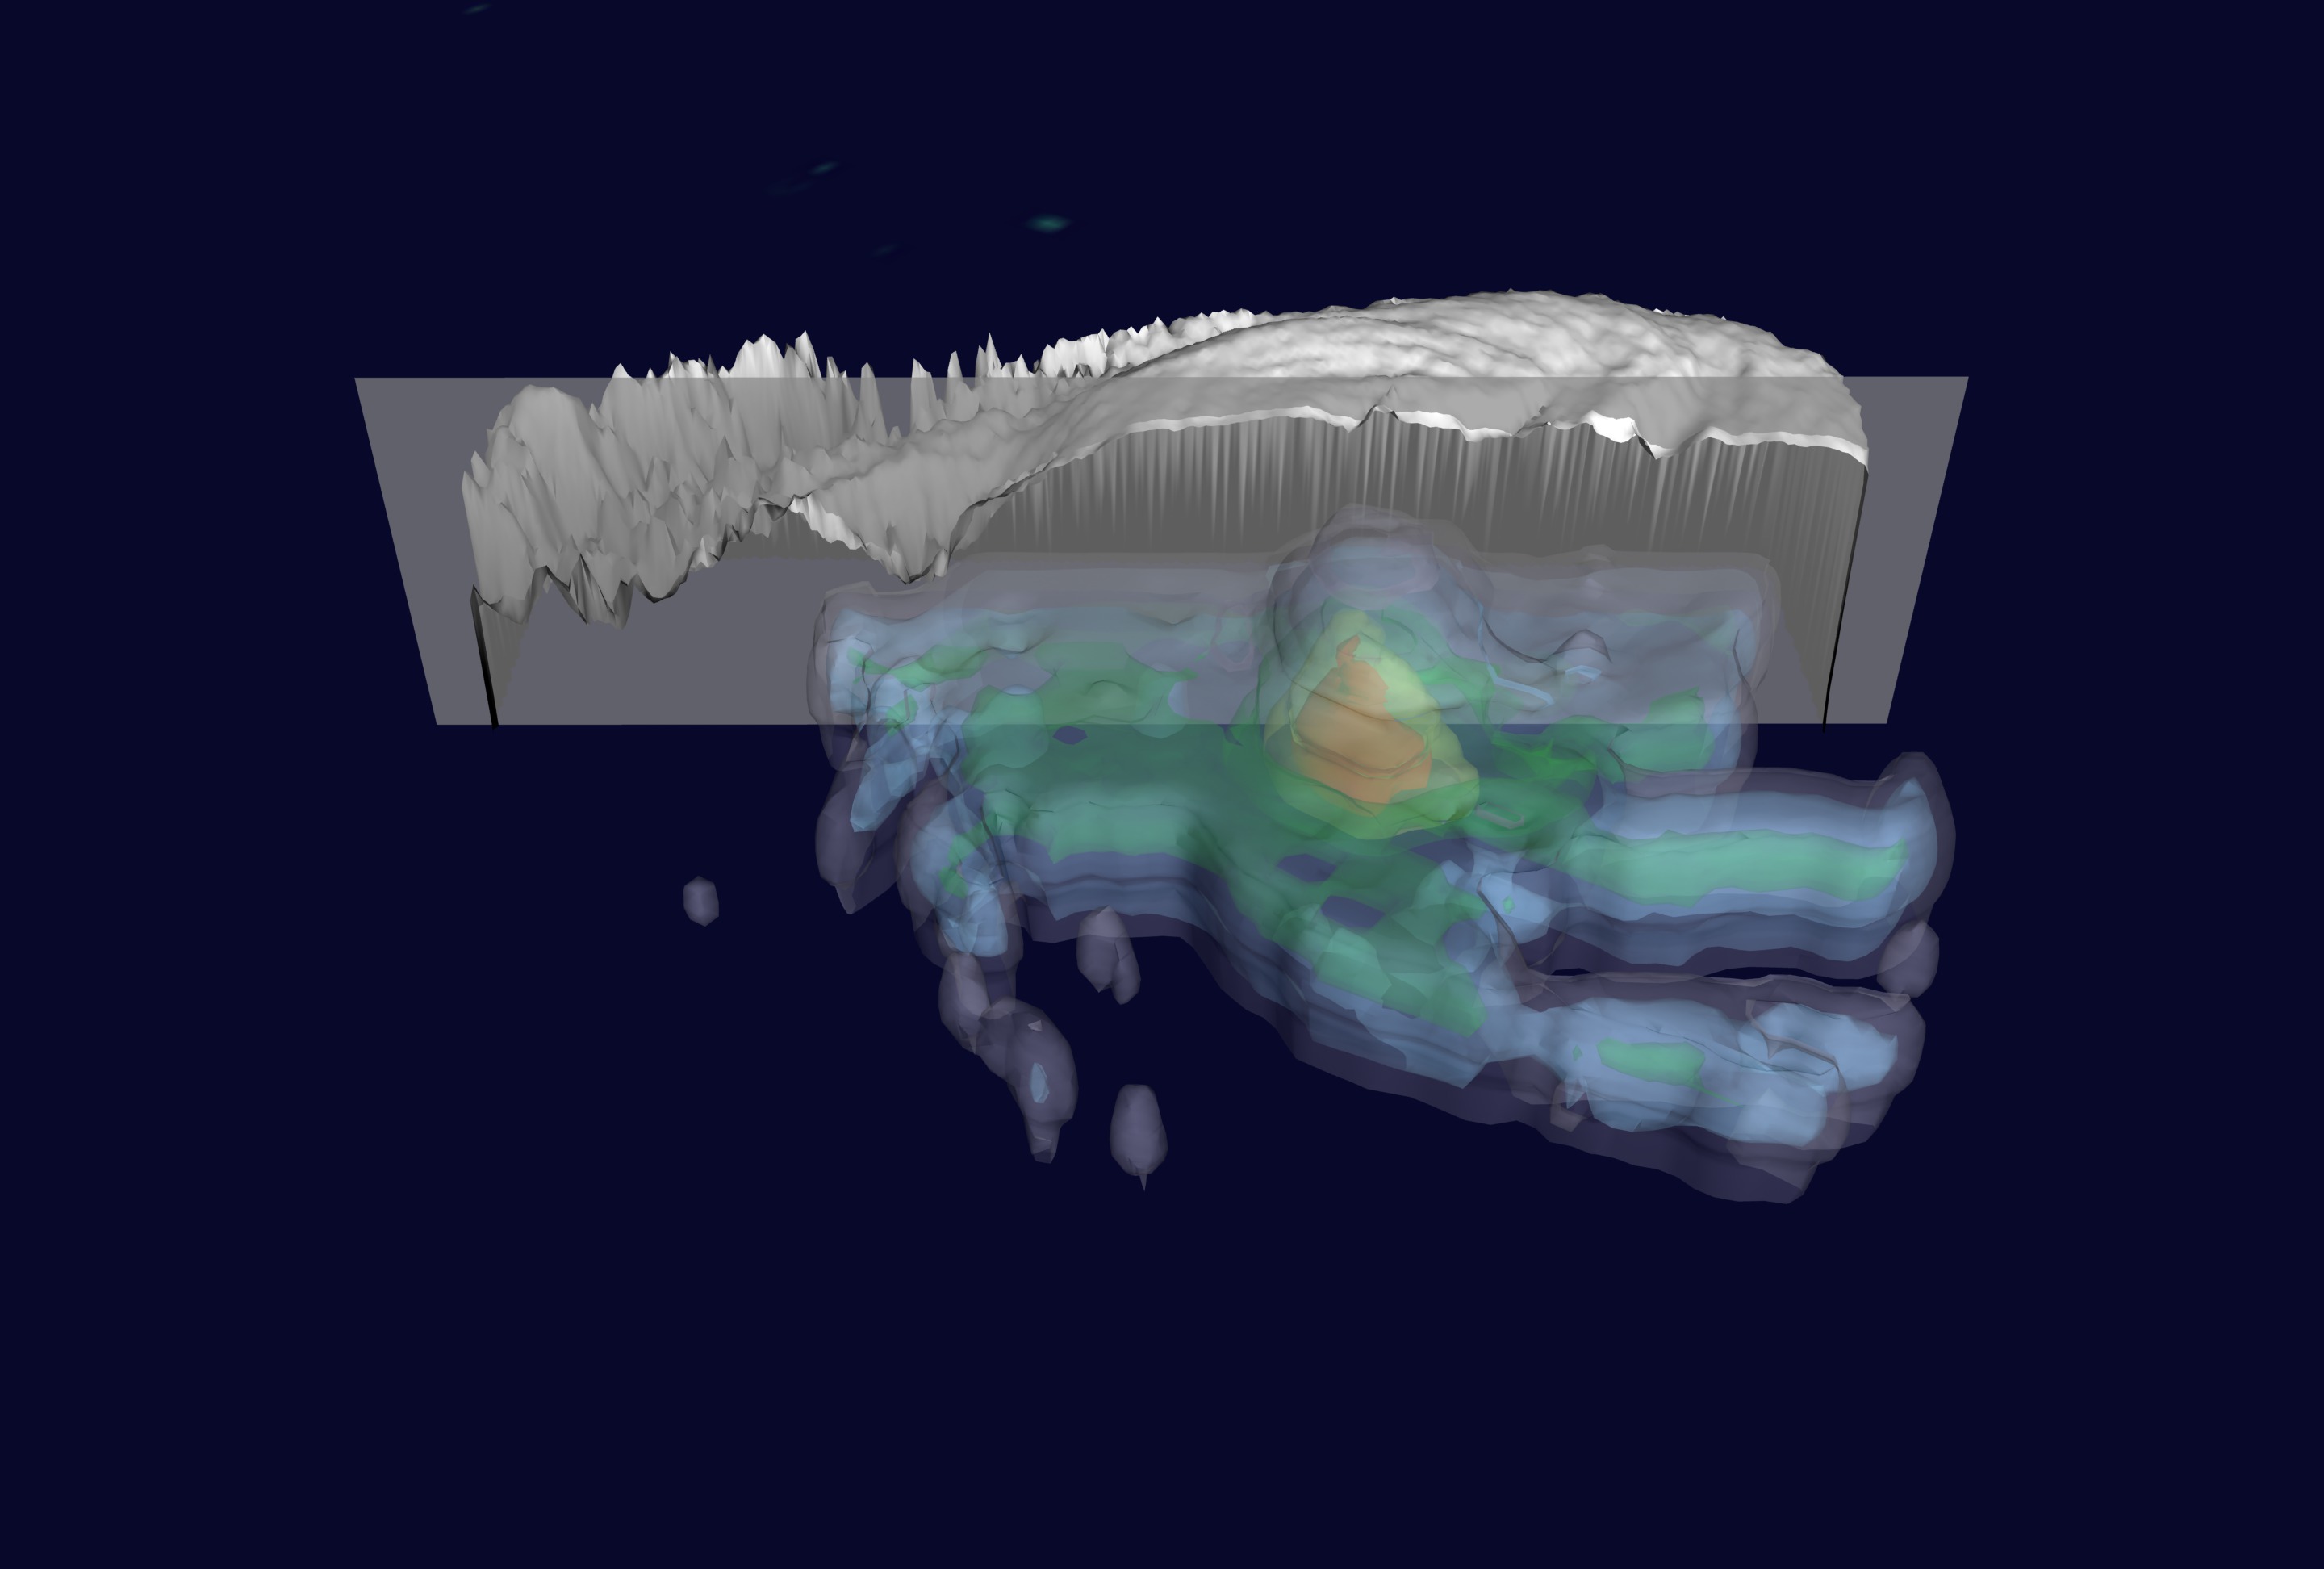
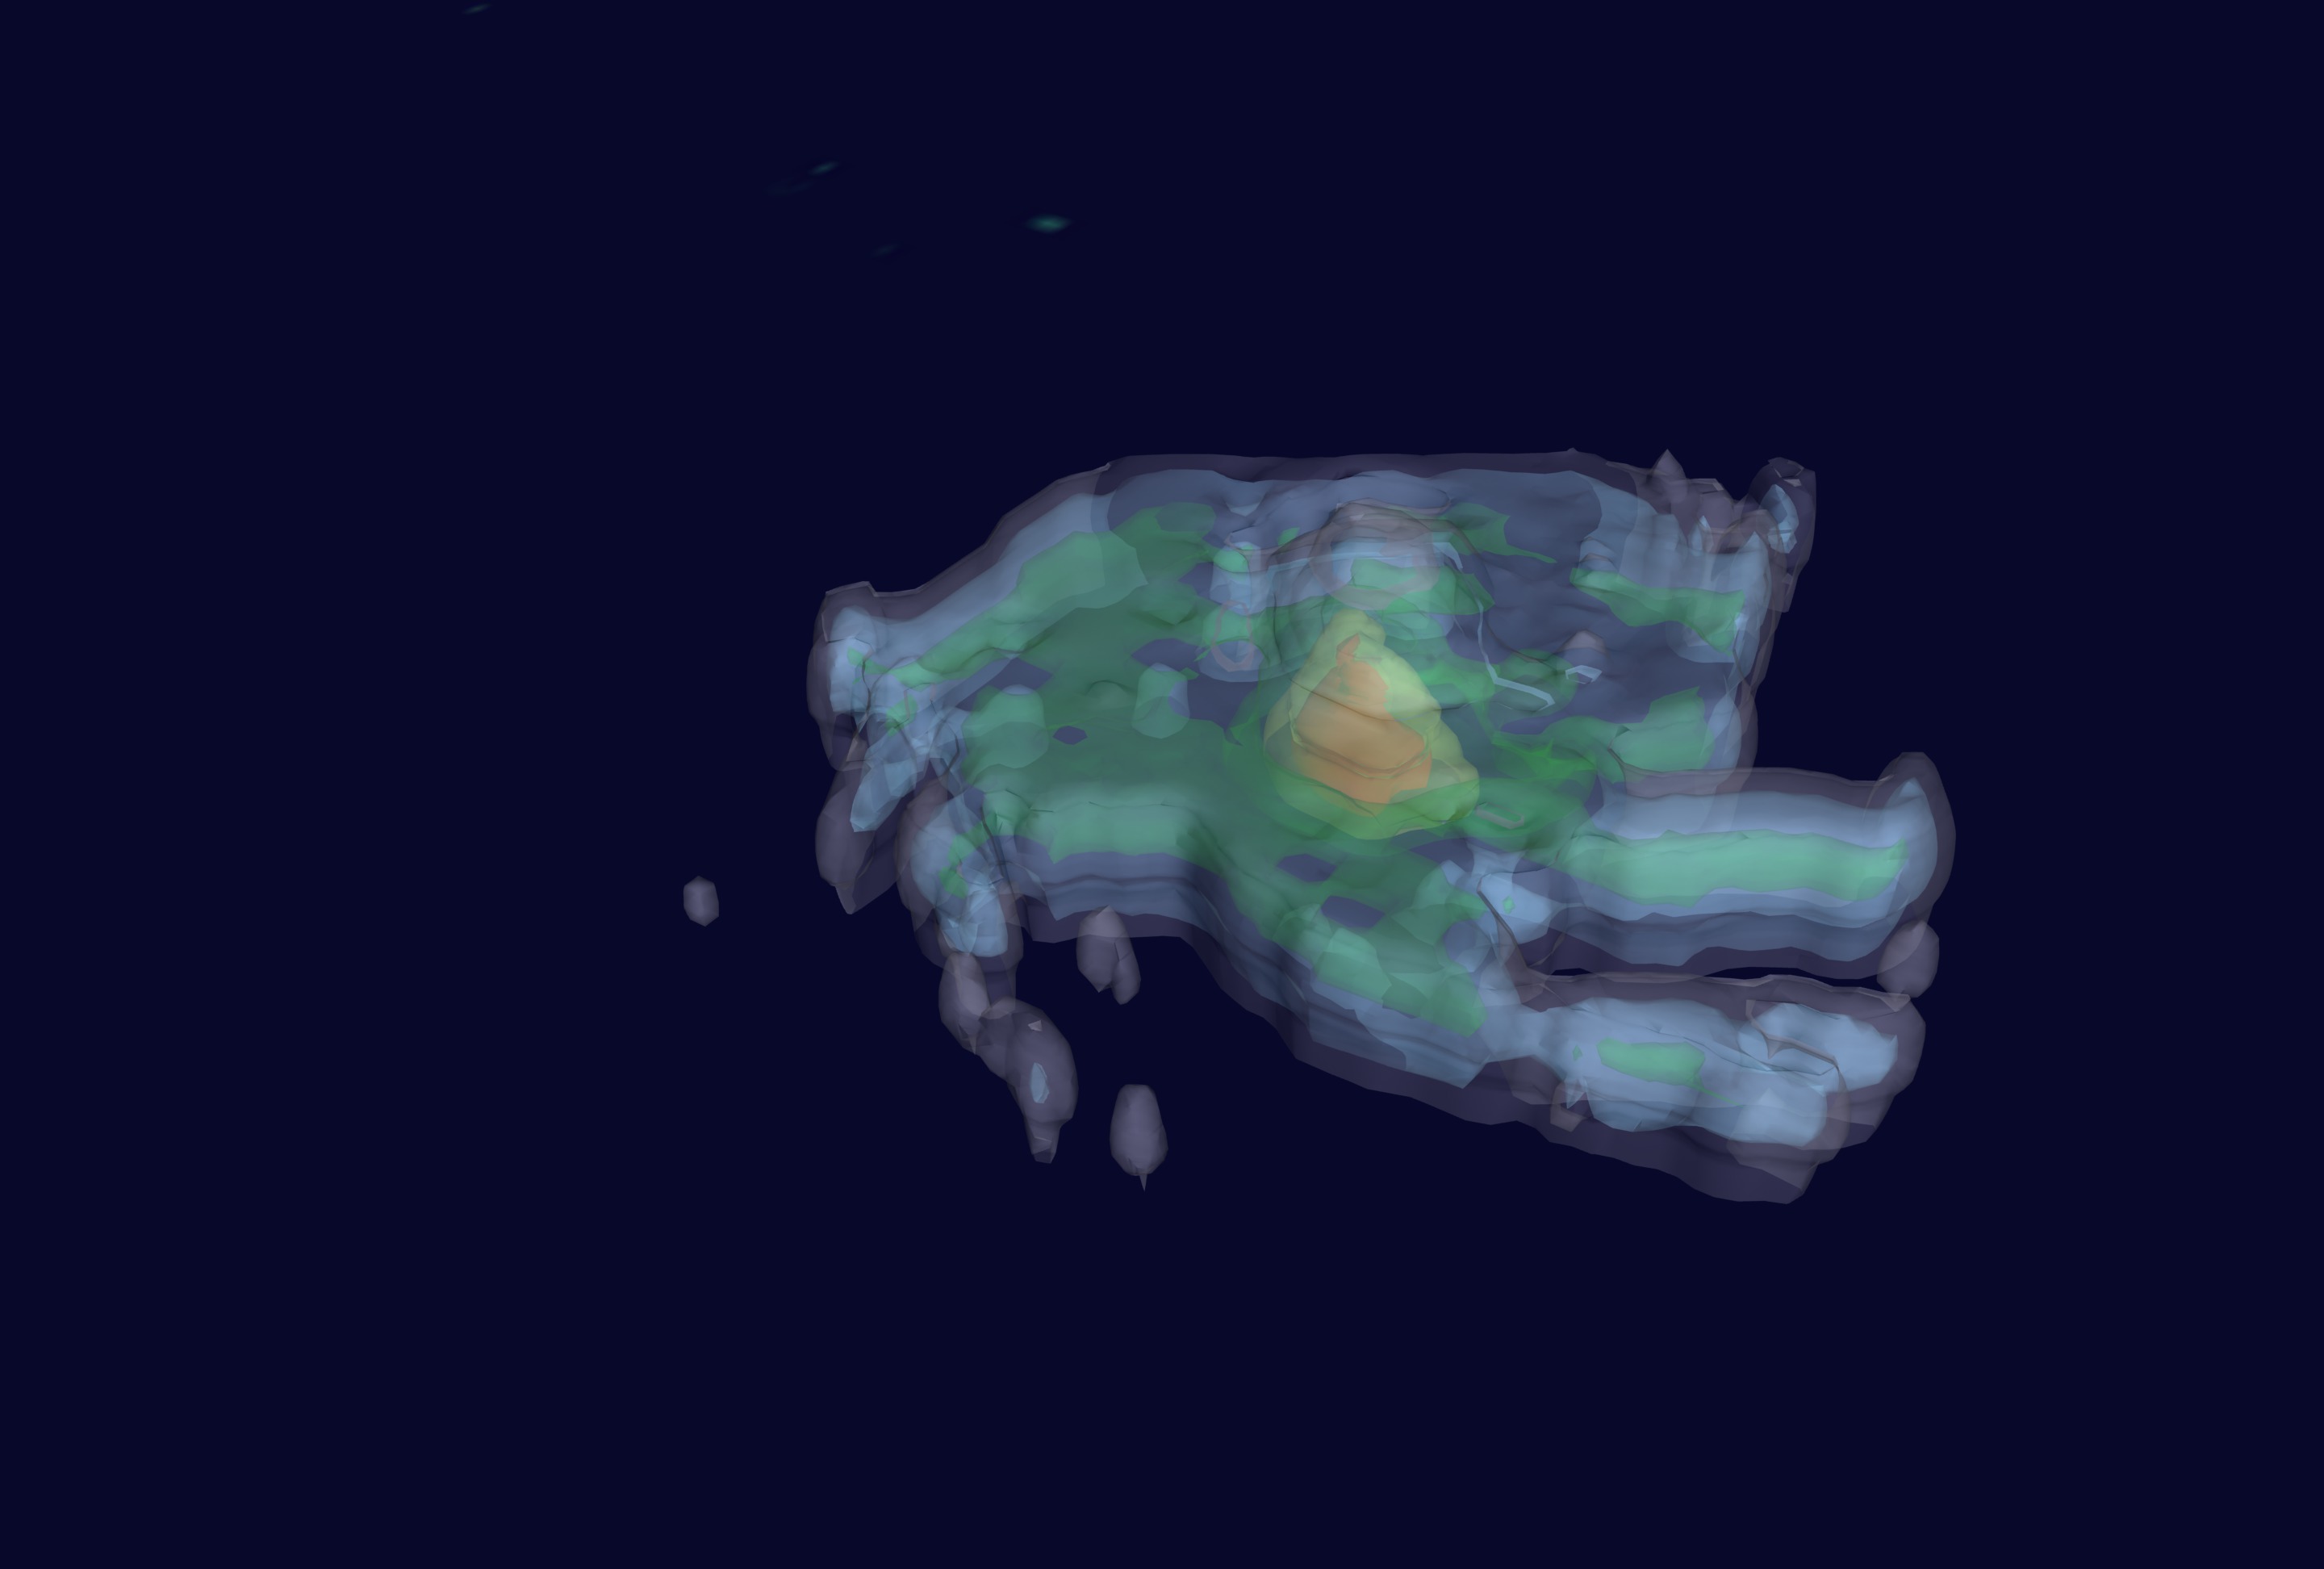
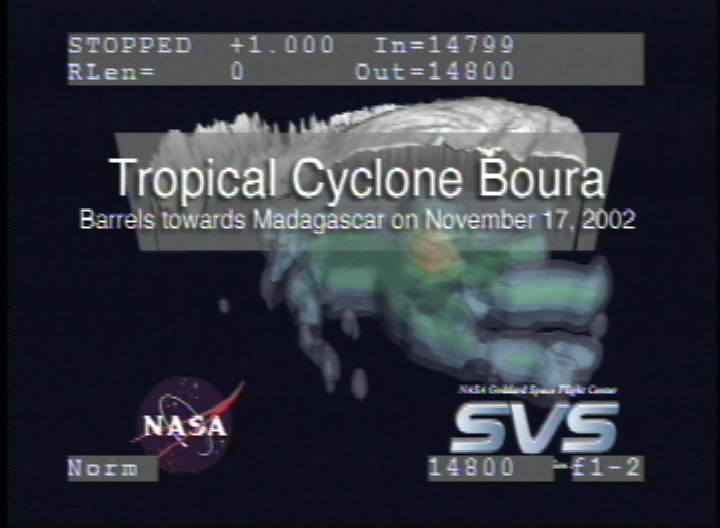
Tropical Cyclone Boura on November 17, 2002
Visualization Credits
Please give credit for this item to:
NASA/Goddard Space Flight Center Scientific Visualization Studio
NASA/Goddard Space Flight Center Scientific Visualization Studio
Short URL to share this page:
https://svs.gsfc.nasa.gov/2647
Mission:
Tropical Rainfall Measuring Mission - TRMM
Data Used:
Note: While we identify the data sets used in these visualizations, we do not store any further details nor the data sets themselves on our site.
This item is part of this series:
TRMM 3D Hurricanes
Keywords:
DLESE >> Atmospheric science
SVS >> Boura
DLESE >> Natural hazards
GCMD >> Earth Science >> Atmosphere >> Atmospheric Phenomena >> Cyclones
GCMD >> Location >> Madagascar
NASA Science >> Earth
GCMD keywords can be found on the Internet with the following citation: Olsen, L.M., G. Major, K. Shein, J. Scialdone, S. Ritz, T. Stevens, M. Morahan, A. Aleman, R. Vogel, S. Leicester, H. Weir, M. Meaux, S. Grebas, C.Solomon, M. Holland, T. Northcutt, R. A. Restrepo, R. Bilodeau, 2013. NASA/Global Change Master Directory (GCMD) Earth Science Keywords. Version 8.0.0.0.0
https://svs.gsfc.nasa.gov/2647
Mission:
Tropical Rainfall Measuring Mission - TRMM
Data Used:
TRMM/PR
2002/11/17TRMM/TMI
2002/11/17TRMM/VIS
2002/11/17This item is part of this series:
TRMM 3D Hurricanes
Keywords:
DLESE >> Atmospheric science
SVS >> Boura
DLESE >> Natural hazards
GCMD >> Earth Science >> Atmosphere >> Atmospheric Phenomena >> Cyclones
GCMD >> Location >> Madagascar
NASA Science >> Earth
GCMD keywords can be found on the Internet with the following citation: Olsen, L.M., G. Major, K. Shein, J. Scialdone, S. Ritz, T. Stevens, M. Morahan, A. Aleman, R. Vogel, S. Leicester, H. Weir, M. Meaux, S. Grebas, C.Solomon, M. Holland, T. Northcutt, R. A. Restrepo, R. Bilodeau, 2013. NASA/Global Change Master Directory (GCMD) Earth Science Keywords. Version 8.0.0.0.0


