Earth
Sun
ID: 2391
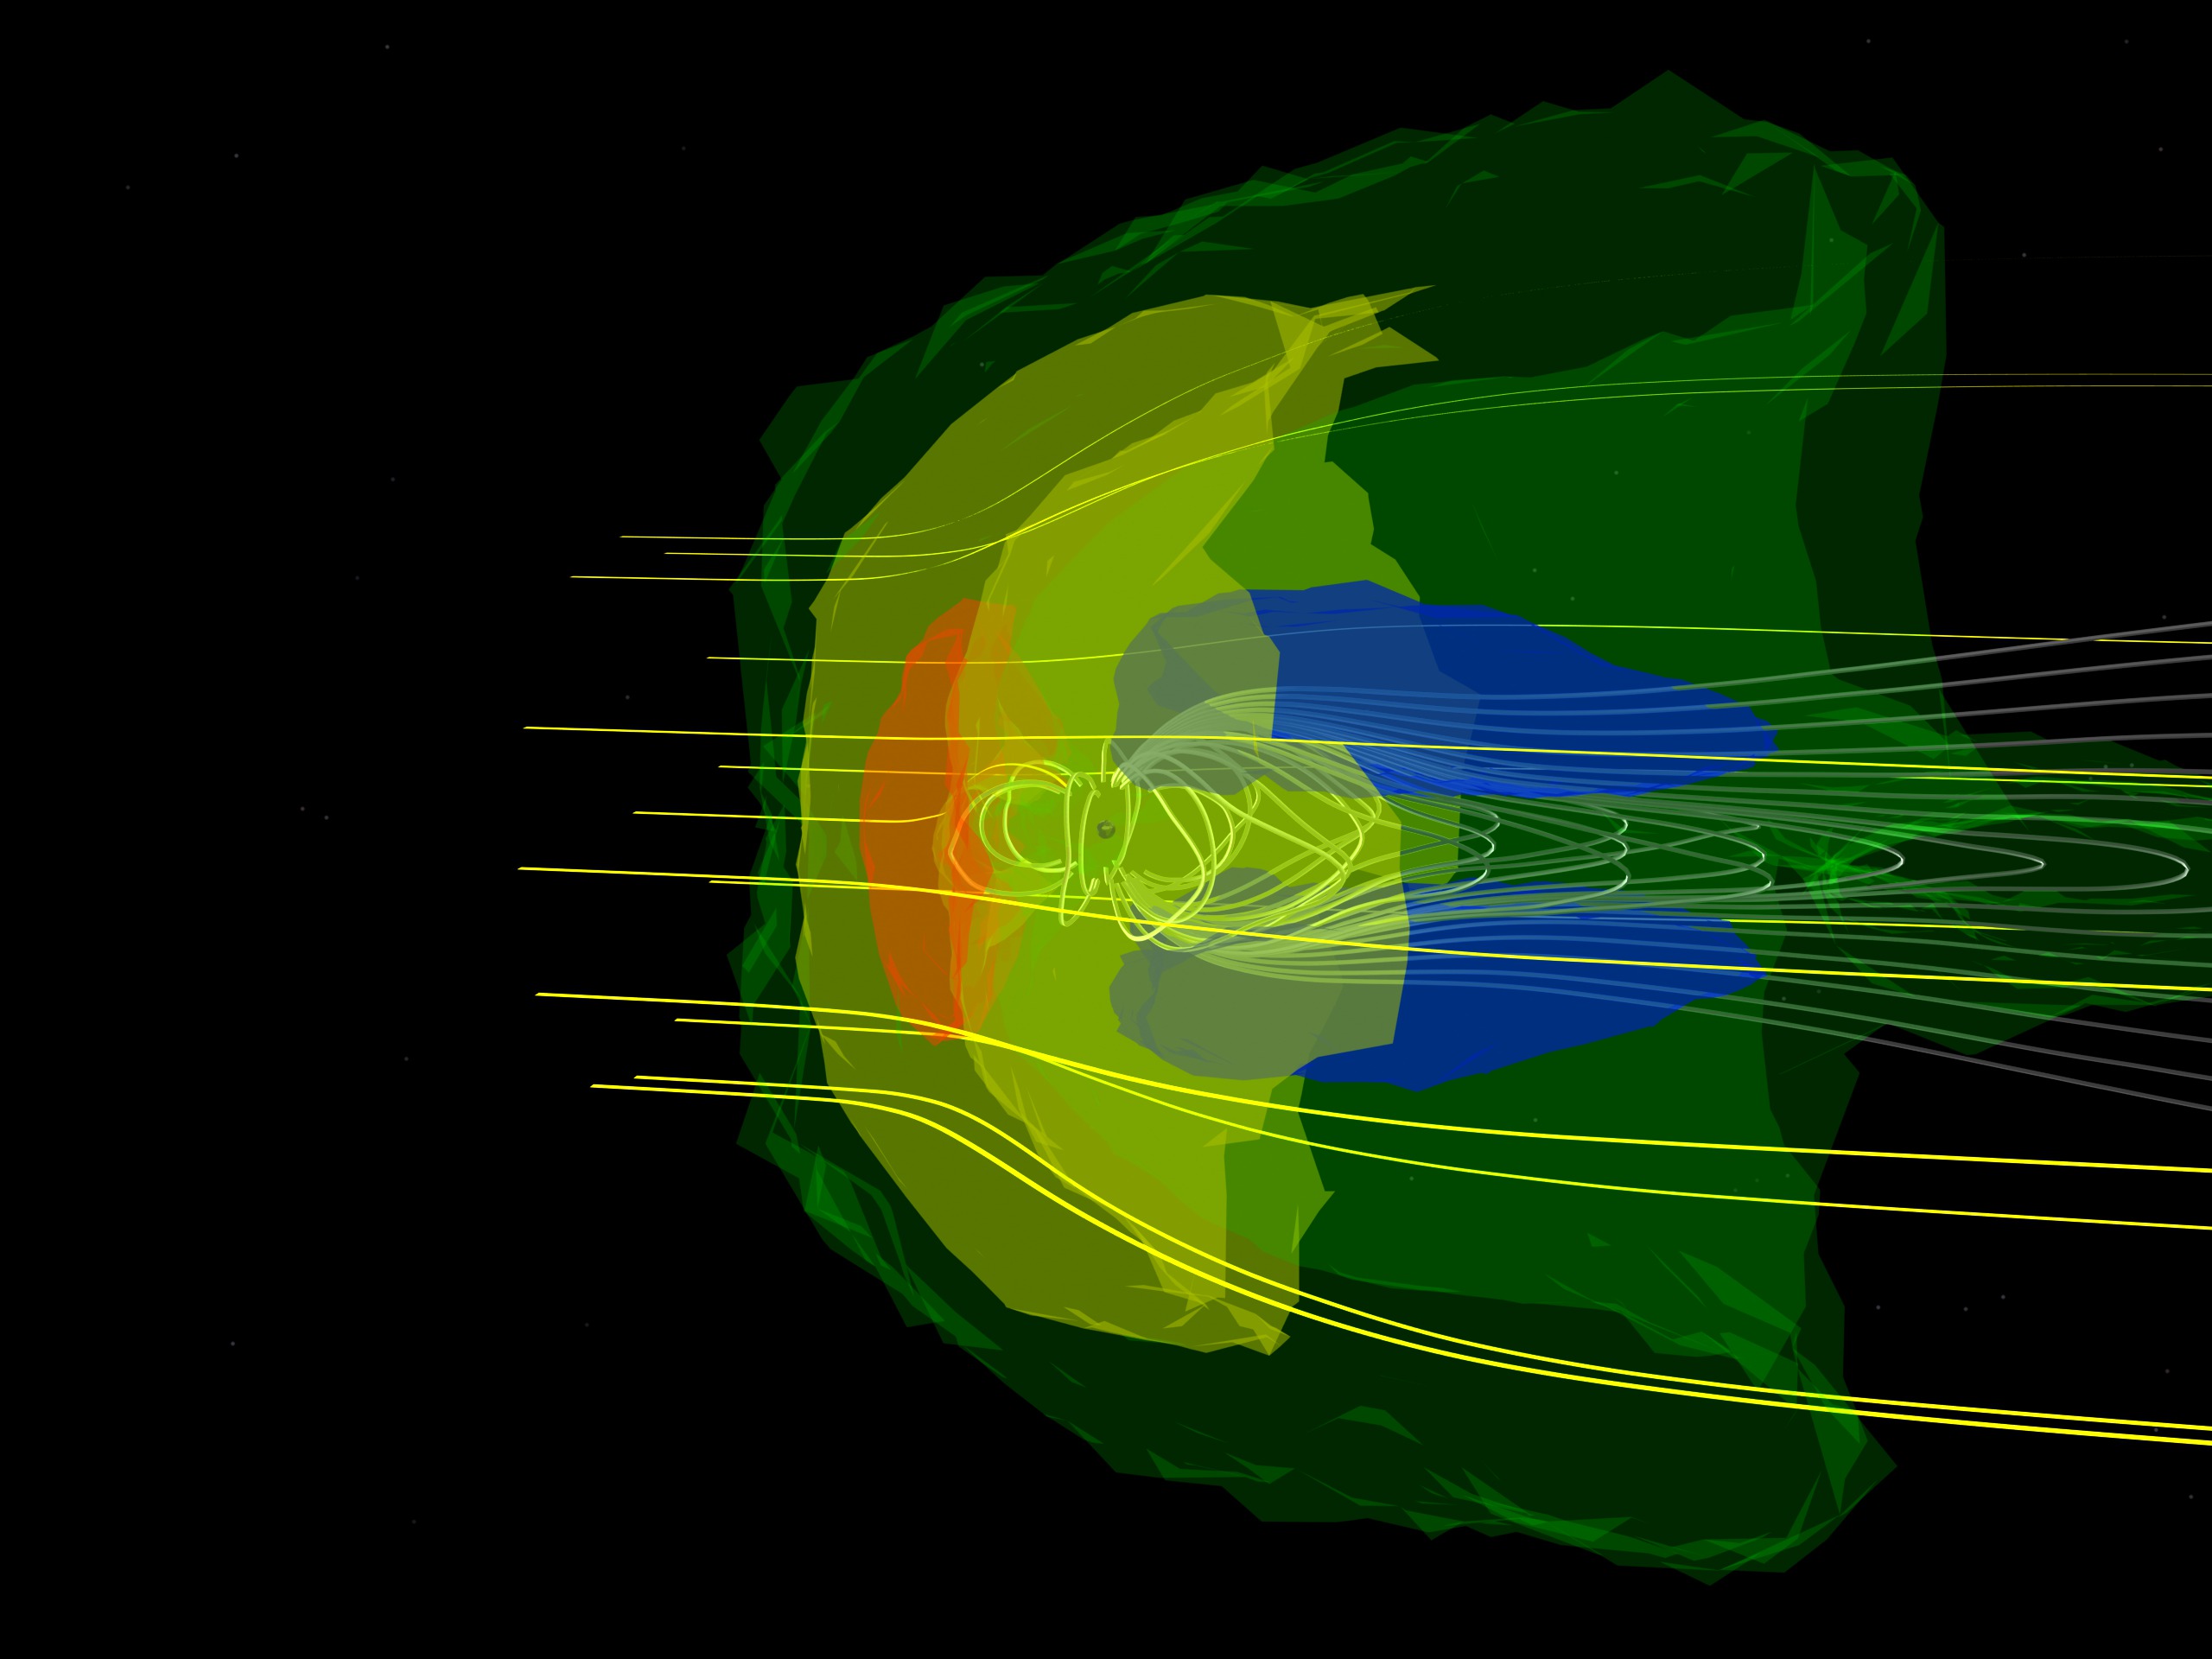
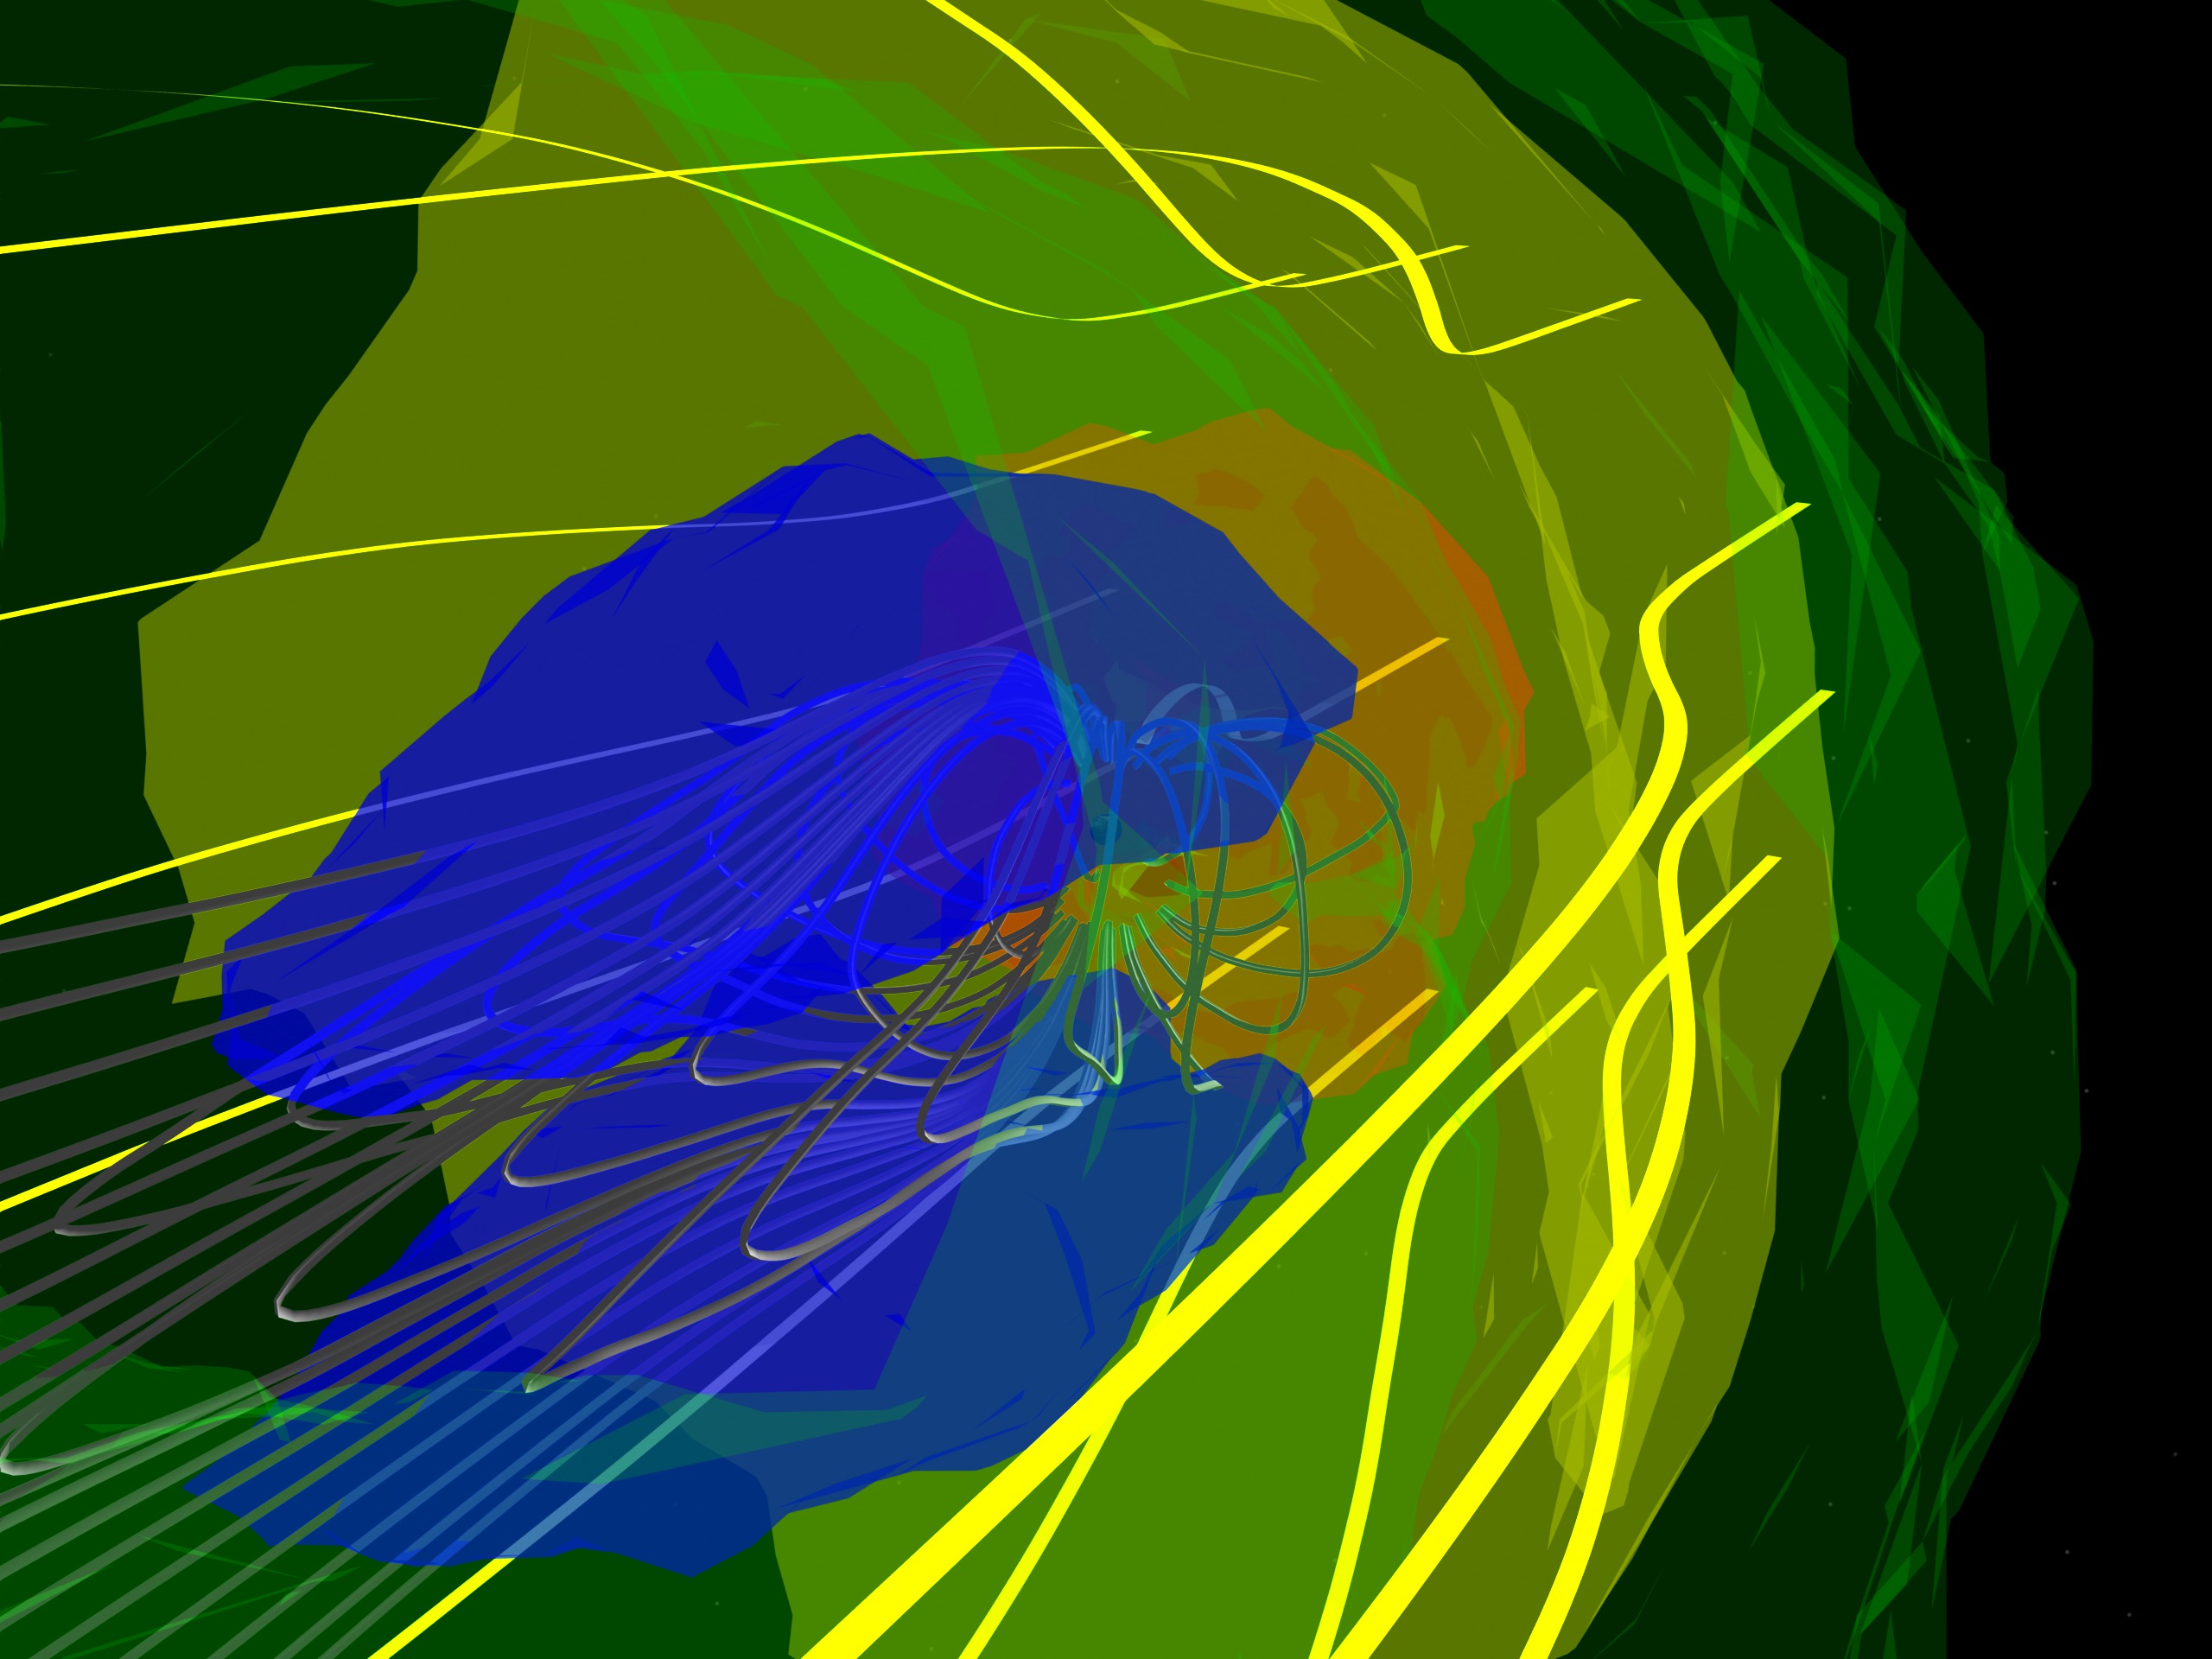
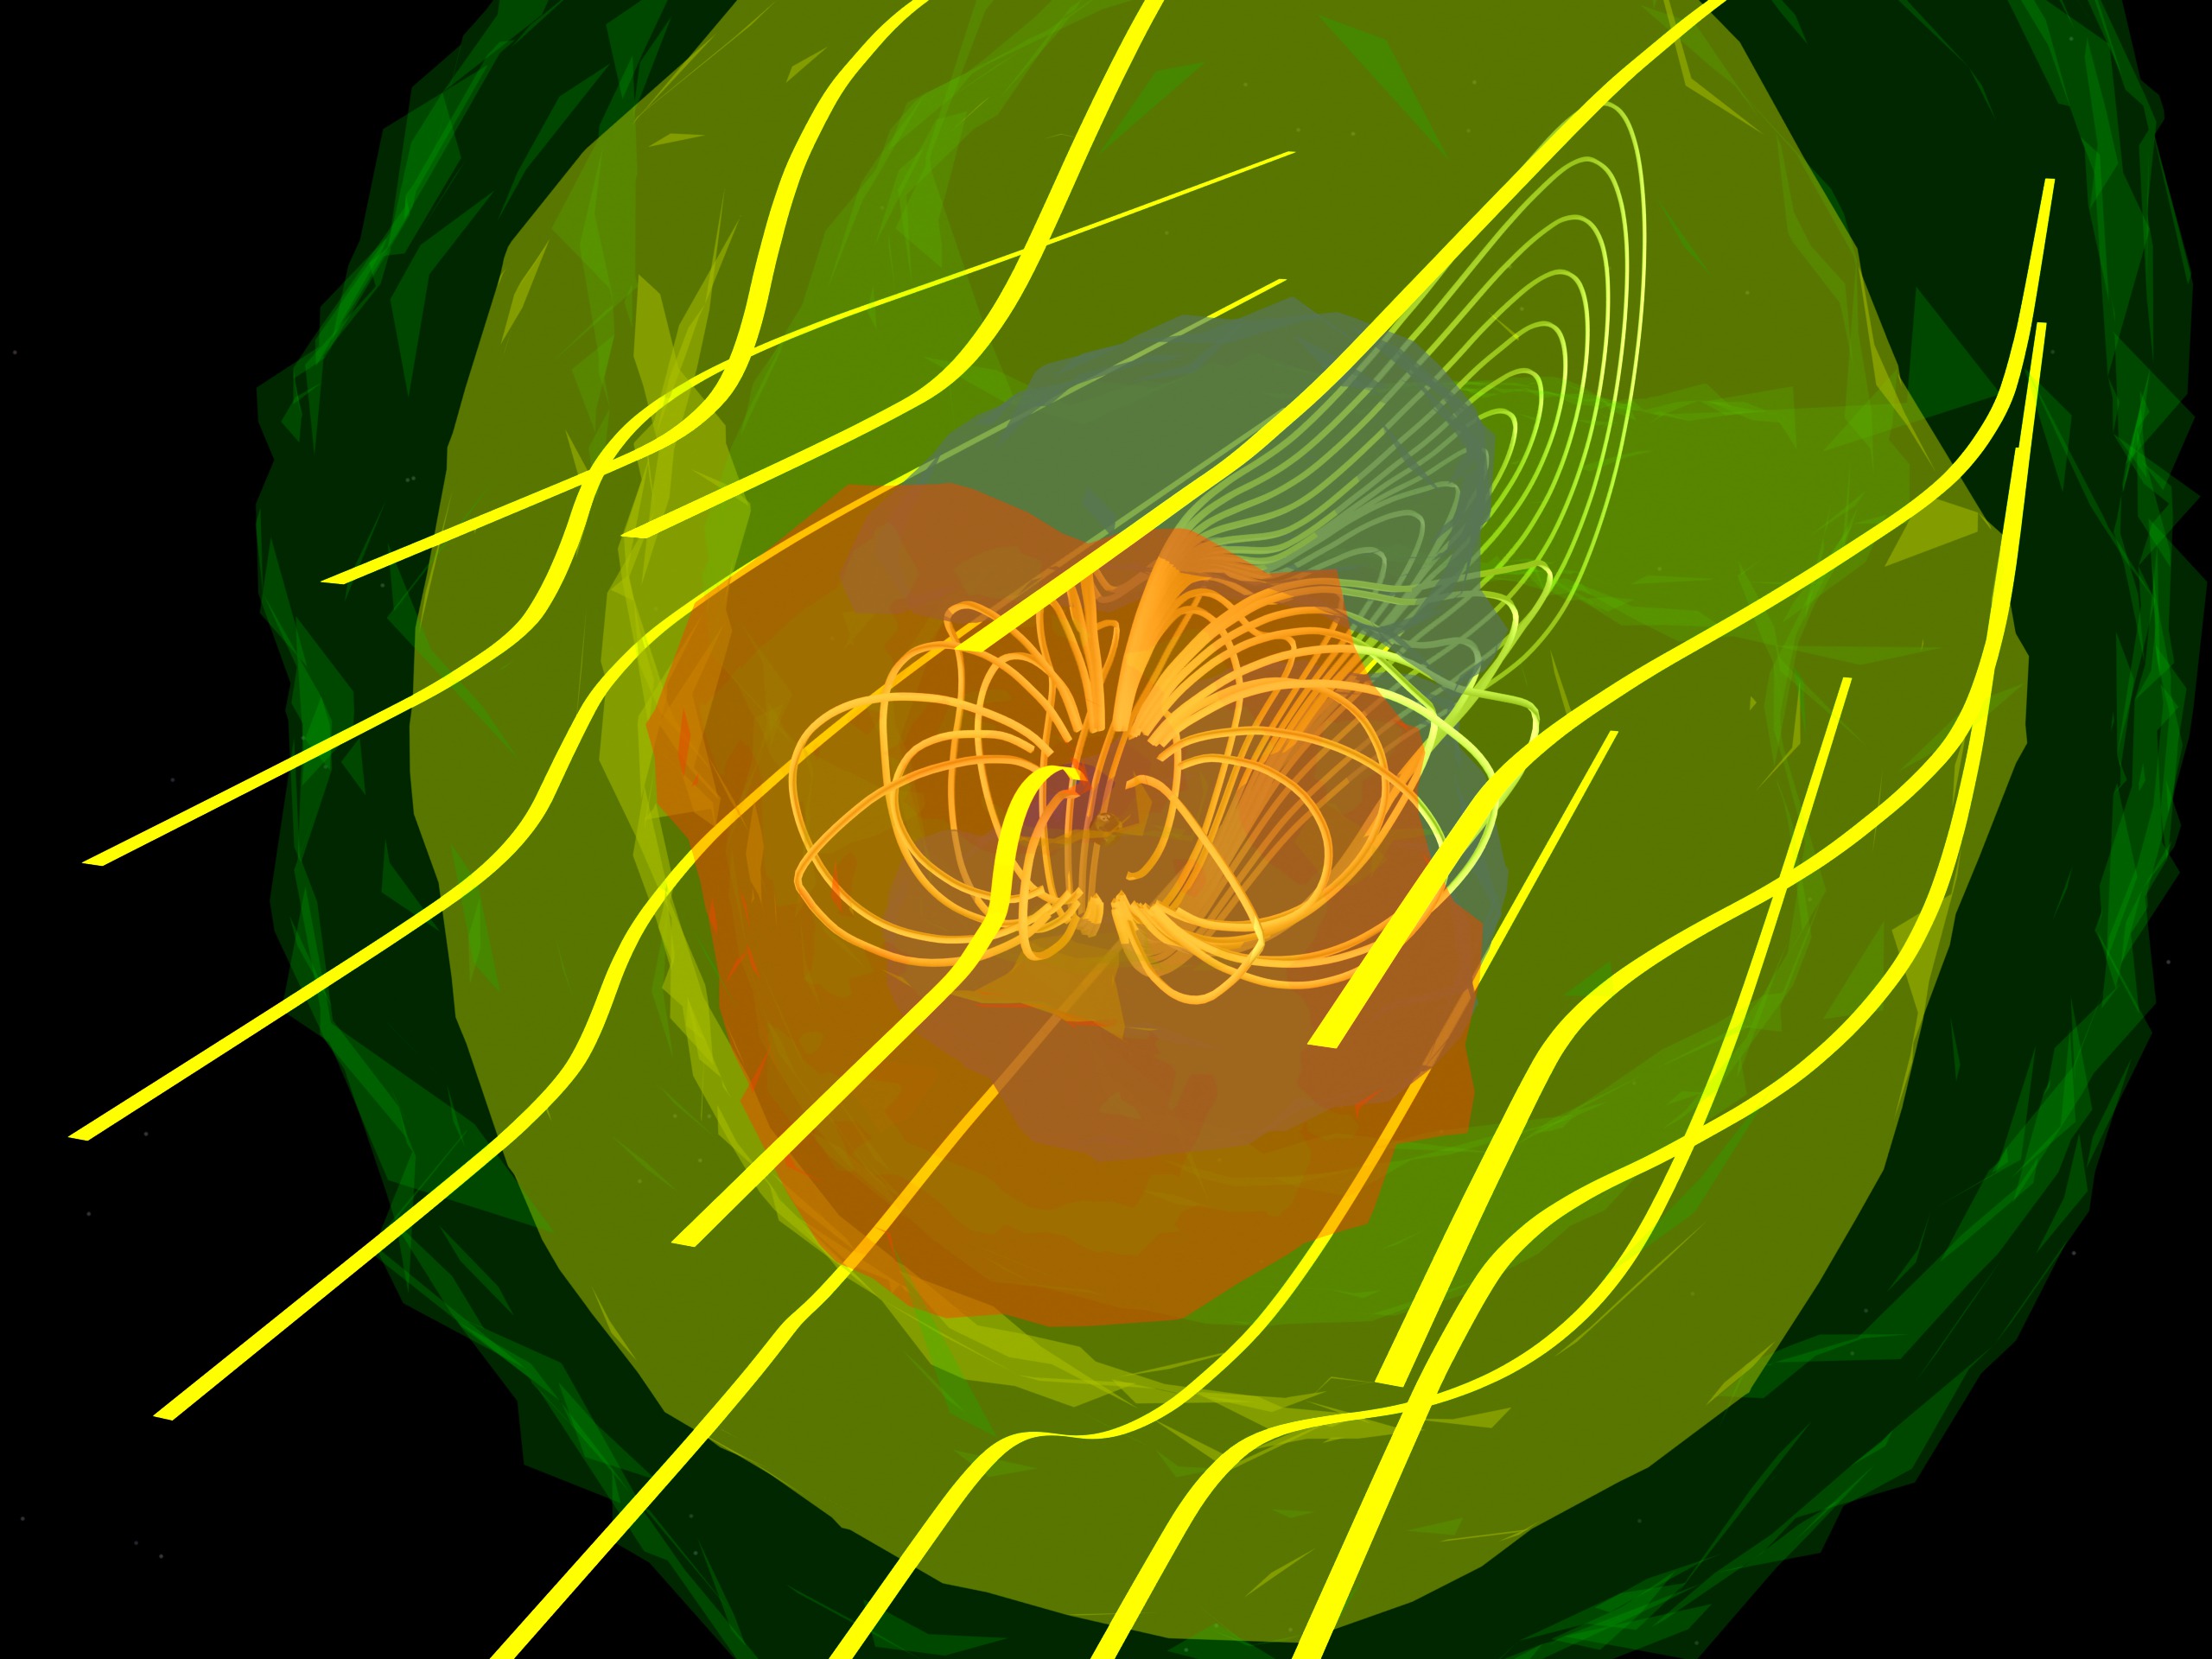
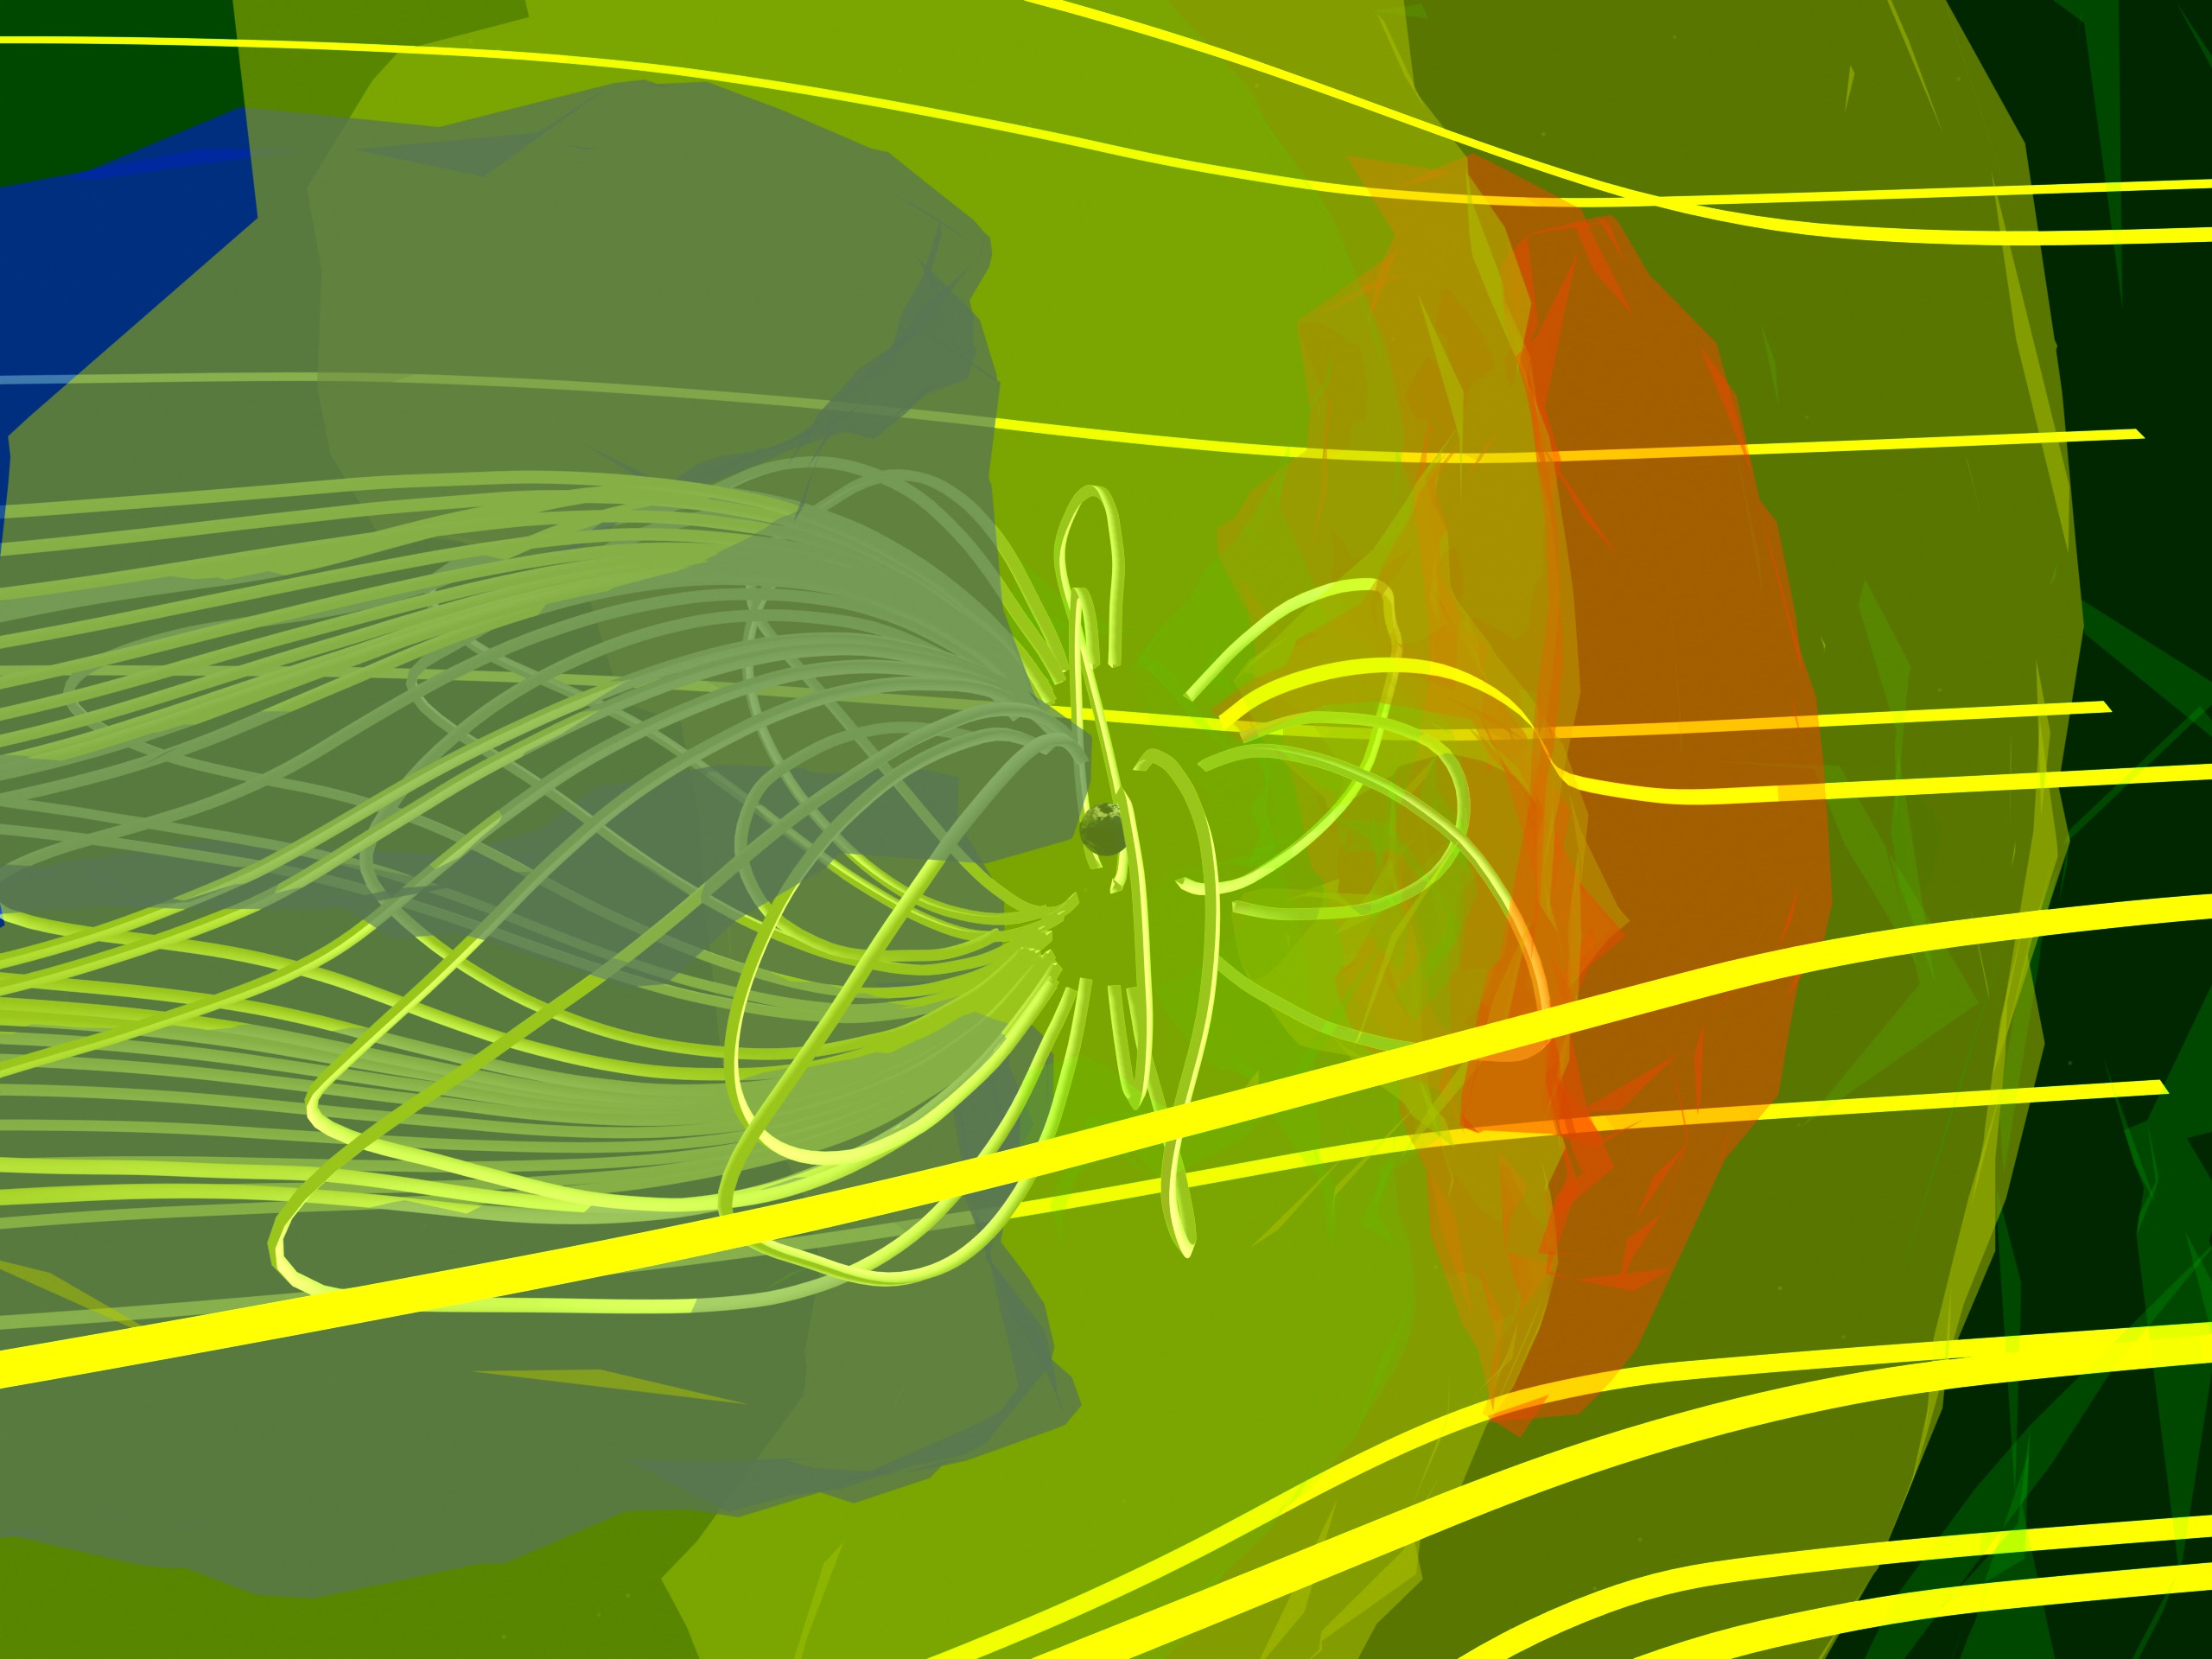
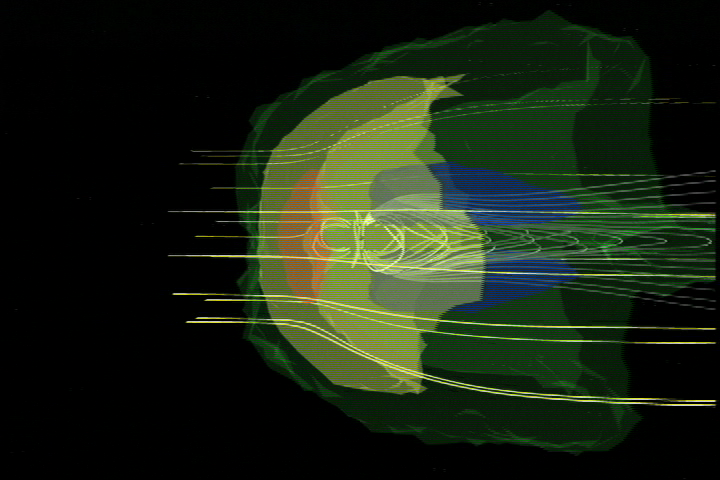
A view of a computer-generated model of the Earth's magnetosphere. Semi-transparent surfaces represent particle density (red is high, blue is low), the silvery tube represent magnetic field lines and the yellow ribbons represent the paths of charged solar wind particles. In this particular model, the solar wind has an ambient density of 8.35 particles/cm^3. The isosurfaces are then red (> 17 particles/cm^3), yellow (> 12 particles/cm^3), green (> 8.6 particles/cm^3) and blue (< 1.0 particle/cm^3).

Magnetosphere II: The Solar Wind Strikes Back!
Visualization Credits
Tom Bridgman (Global Science and Technology, Inc.): Lead Animator
Horace Mitchell (NASA/GSFC): Animator
Eric Sokolowsky (GST): Animator
Dan Spicer (NASA/GSFC): Scientist
Horace Mitchell (NASA/GSFC): Animator
Eric Sokolowsky (GST): Animator
Dan Spicer (NASA/GSFC): Scientist
Please give credit for this item to:
NASA/Goddard Space Flight Center Scientific Visualization Studio
NASA/Goddard Space Flight Center Scientific Visualization Studio
Short URL to share this page:
https://svs.gsfc.nasa.gov/2391
Data Used:
Note: While we identify the data sets used in these visualizations, we do not store any further details nor the data sets themselves on our site.
This item is part of this series:
Magnetosphere
Keywords:
SVS >> Earth
SVS >> Geomagnetic Field
SVS >> HDTV
SVS >> Magnetosphere
SVS >> Solar Wind
DLESE >> Space science
NASA Science >> Earth
NASA Science >> Sun
https://svs.gsfc.nasa.gov/2391
Data Used:
3D Unstructured-mesh Magnetosphere Simulation
Model
Model generated by Dan Spicer, NASA
This item is part of this series:
Magnetosphere
Keywords:
SVS >> Earth
SVS >> Geomagnetic Field
SVS >> HDTV
SVS >> Magnetosphere
SVS >> Solar Wind
DLESE >> Space science
NASA Science >> Earth
NASA Science >> Sun


