Earth
ID: 2366
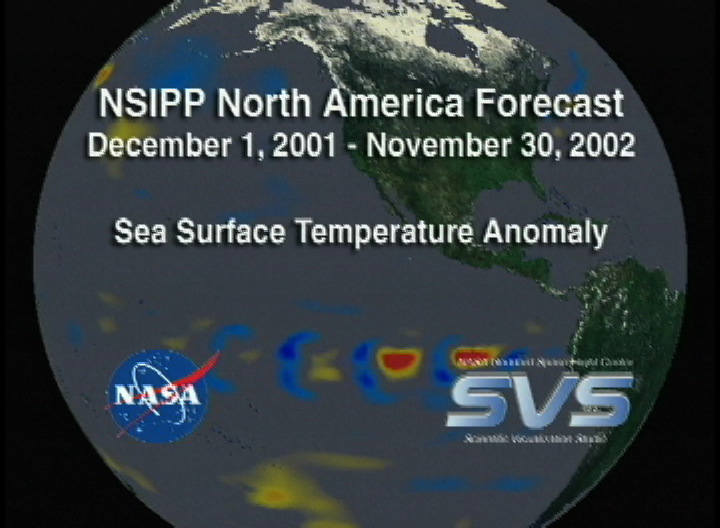
NSIPP North America Forecast December 1, 2001 - November 30, 2002: Sea Surface Temperature Anomaly
For More Information
Visualization Credits
John Waldrop (NASA): Lead Animator
Horace Mitchell (NASA/GSFC): Animator
David Adamec (NASA/GSFC): Scientist
Horace Mitchell (NASA/GSFC): Animator
David Adamec (NASA/GSFC): Scientist
Please give credit for this item to:
NASA/Goddard Space Flight Center Scientific Visualization Studio
NASA/Goddard Space Flight Center Scientific Visualization Studio
Short URL to share this page:
https://svs.gsfc.nasa.gov/2366
Data Used:
Note: While we identify the data sets used in these visualizations, we do not store any further details nor the data sets themselves on our site.
This item is part of this series:
NSIPP
Goddard TV Tape:
G2002-010A
Keywords:
SVS >> Data Assimilation
DLESE >> Physical oceanography
NASA Science >> Earth
https://svs.gsfc.nasa.gov/2366
Data Used:
GEMS/Sea Surface Temperature Anomaly
Model - NASA NSIPP - 2001/12/01-2002/11/30
GEMS stands for Goddard Earth Modeling System. It is also known as the NSIPP Global Climate Model.
This item is part of this series:
NSIPP
Goddard TV Tape:
G2002-010A
Keywords:
SVS >> Data Assimilation
DLESE >> Physical oceanography
NASA Science >> Earth


