Earth
ID: 2231
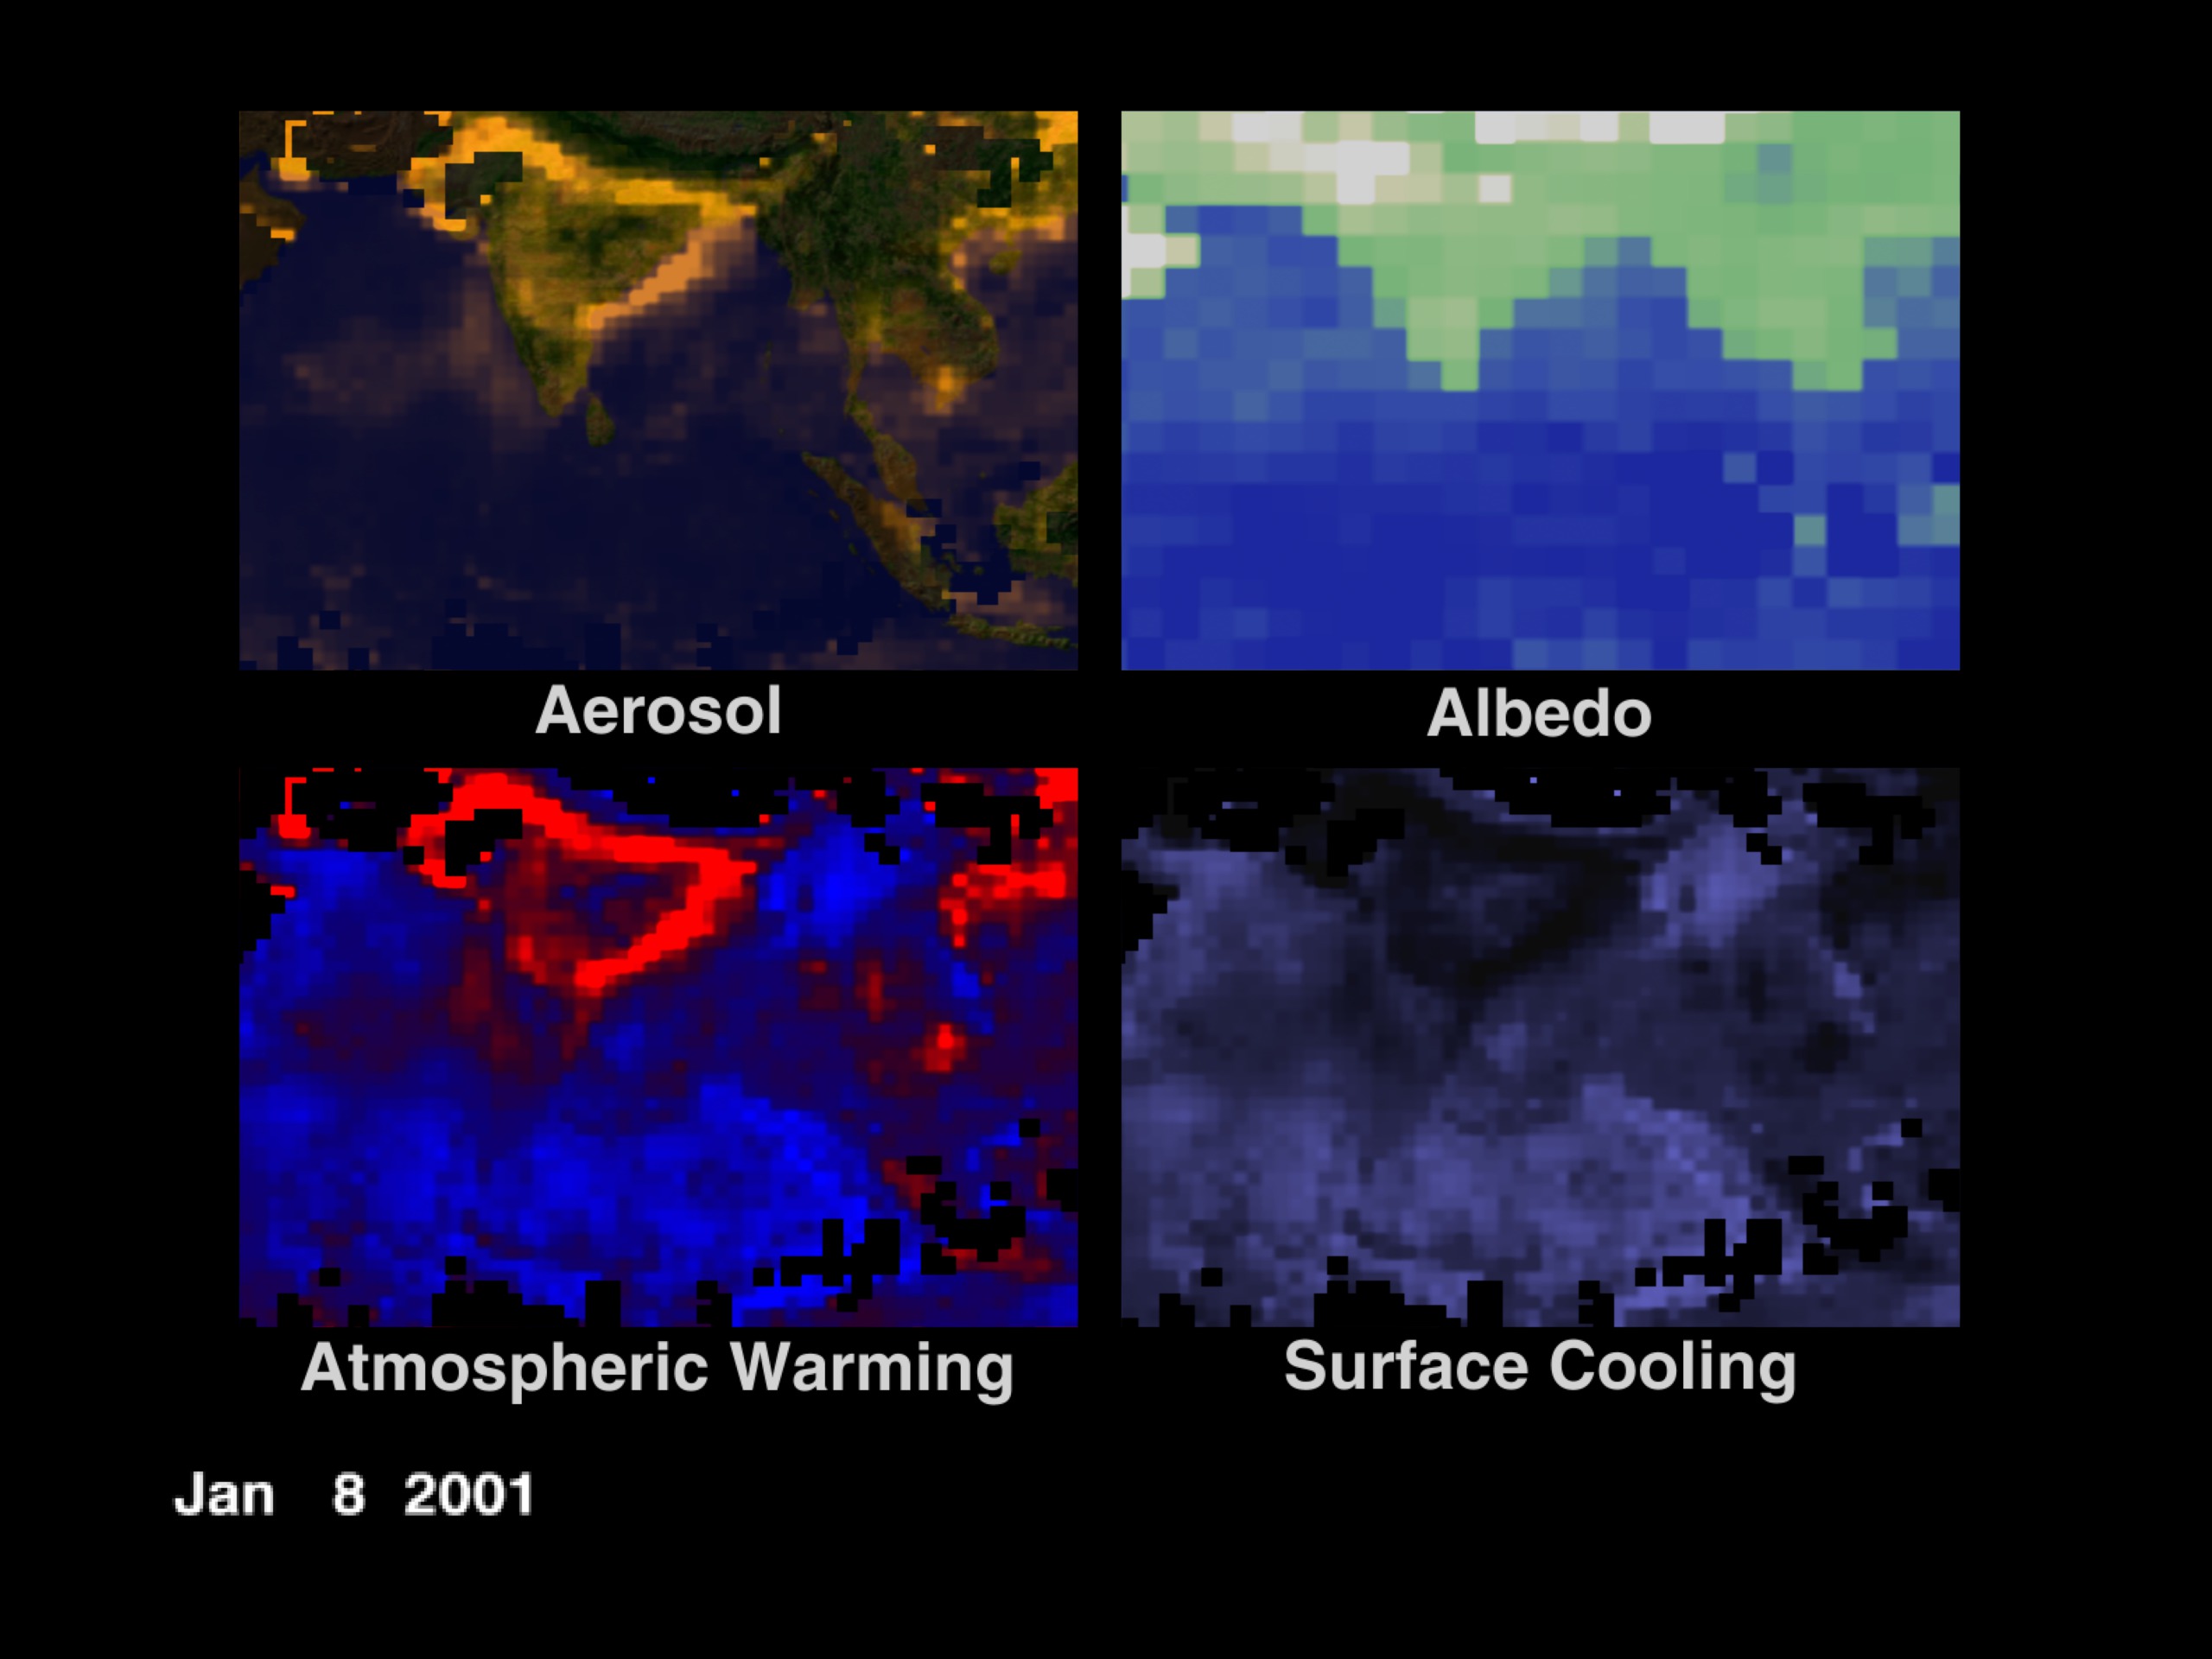
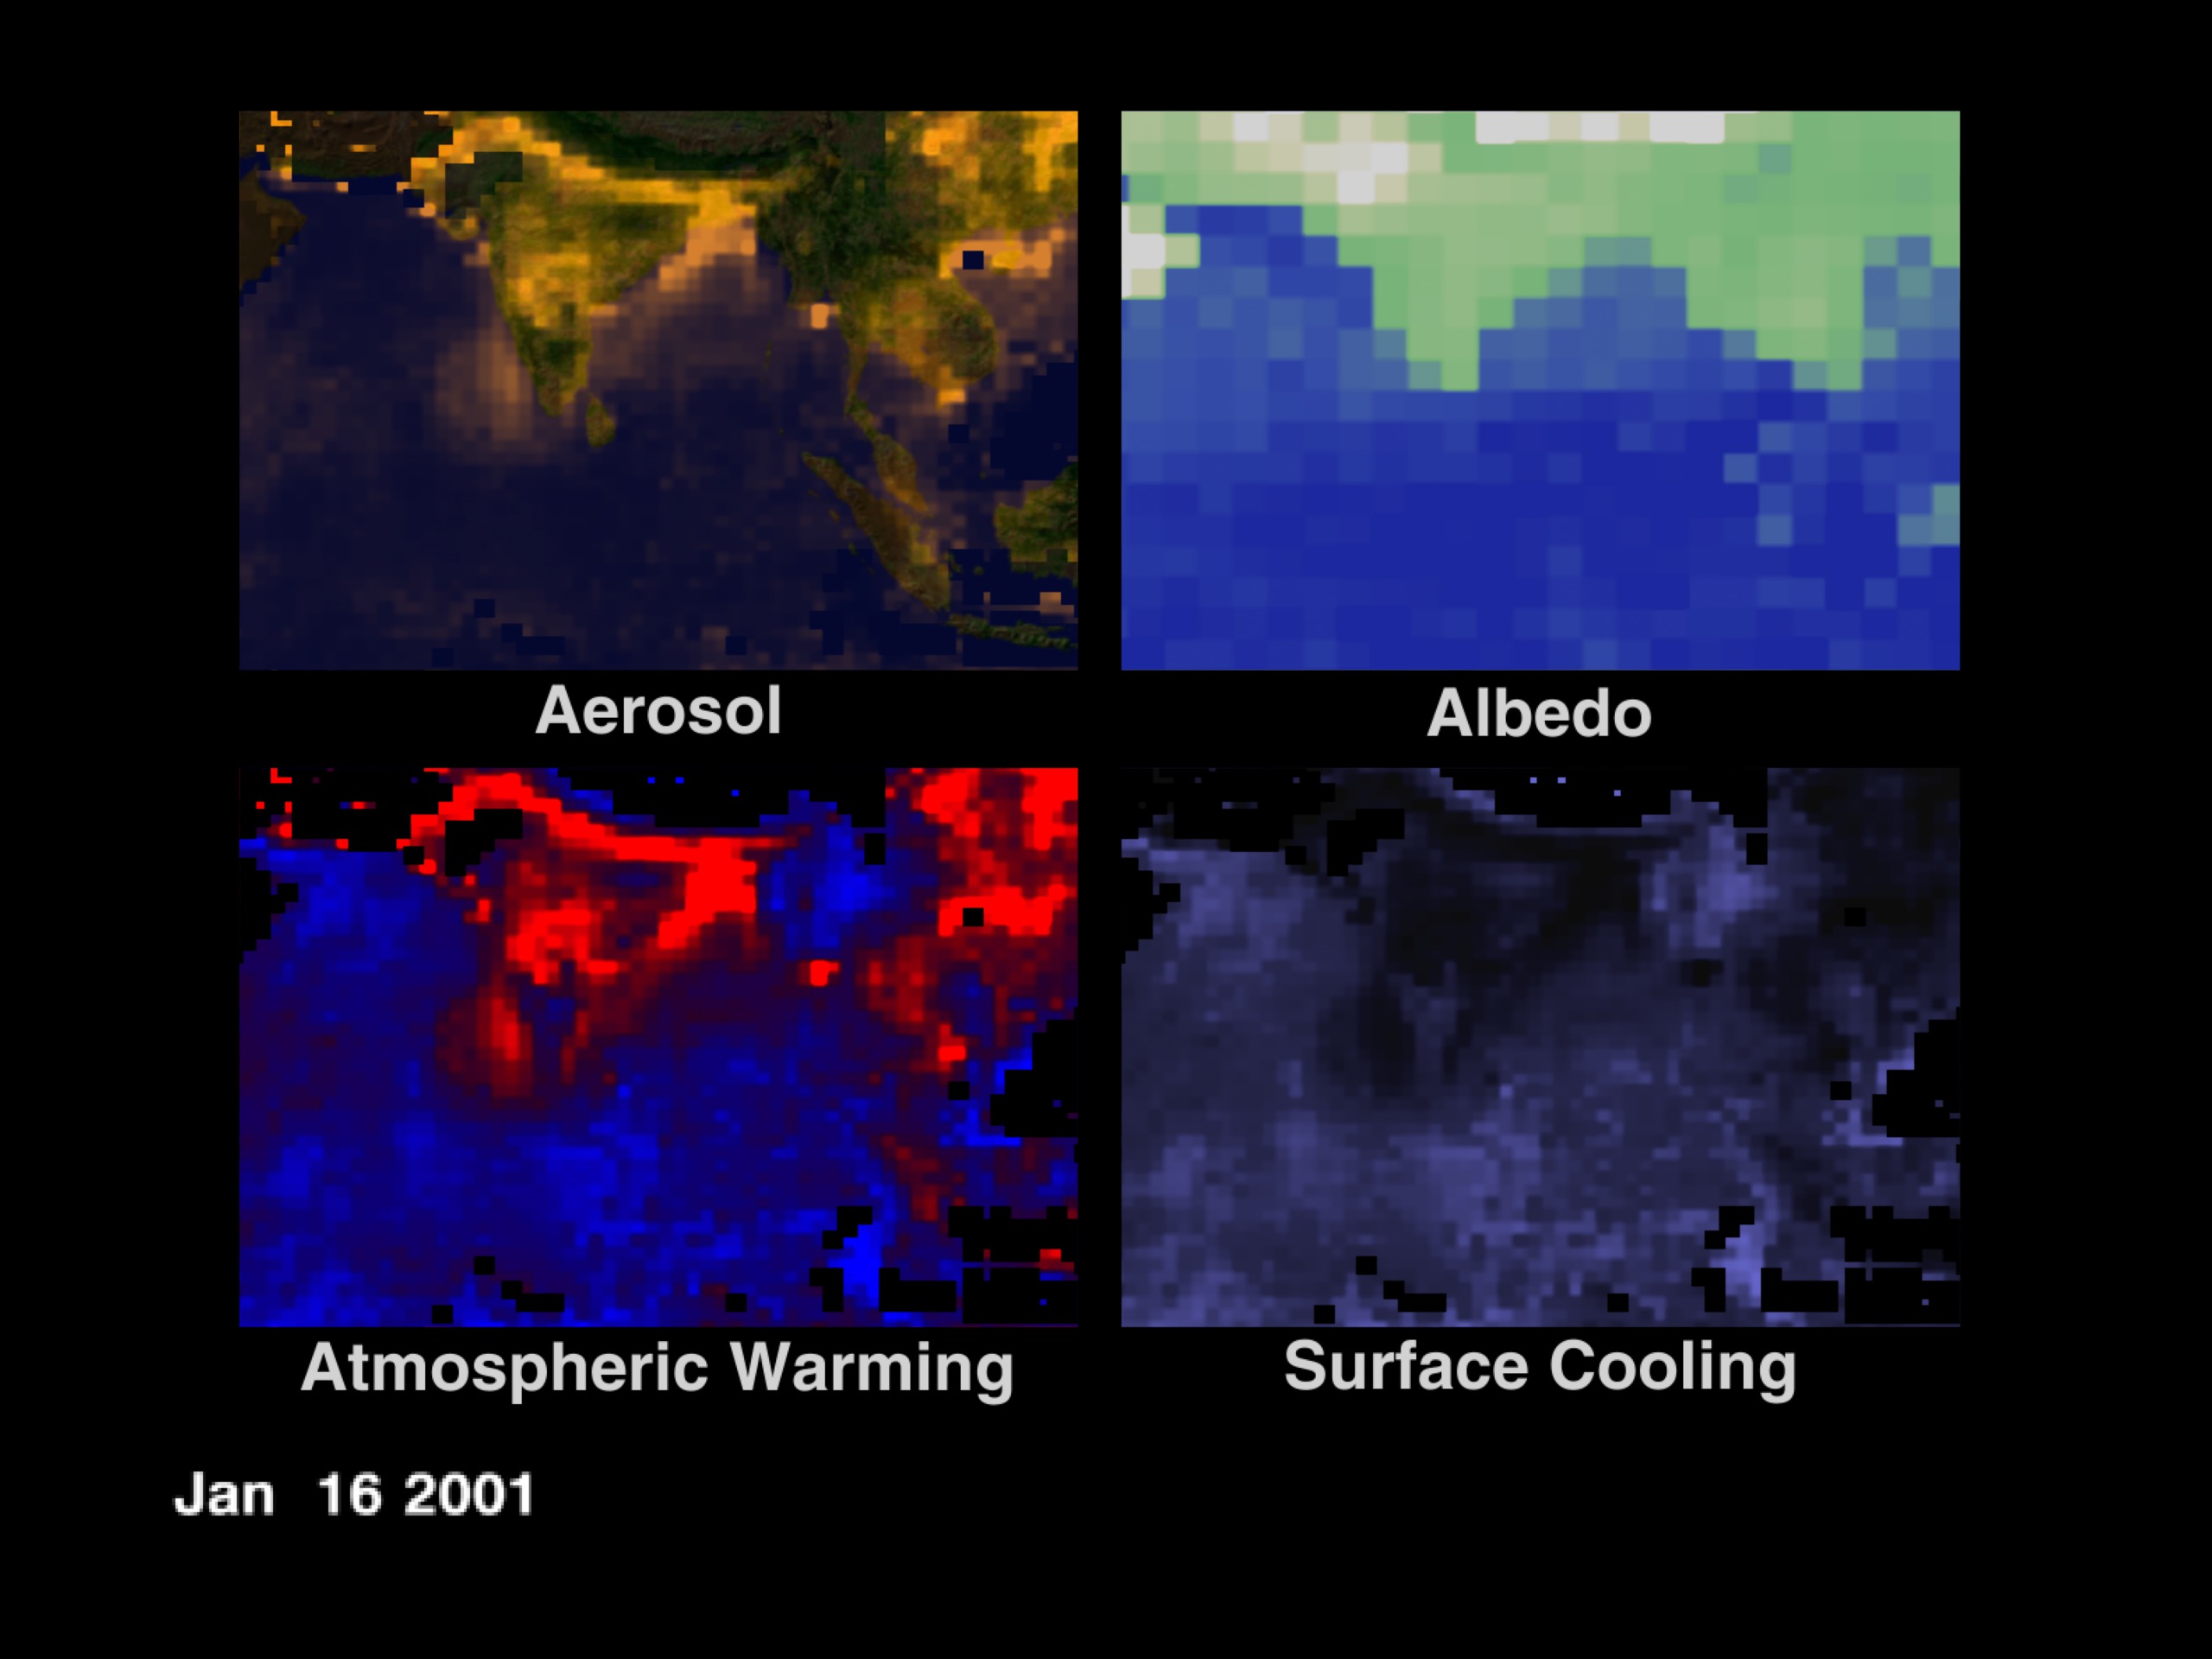
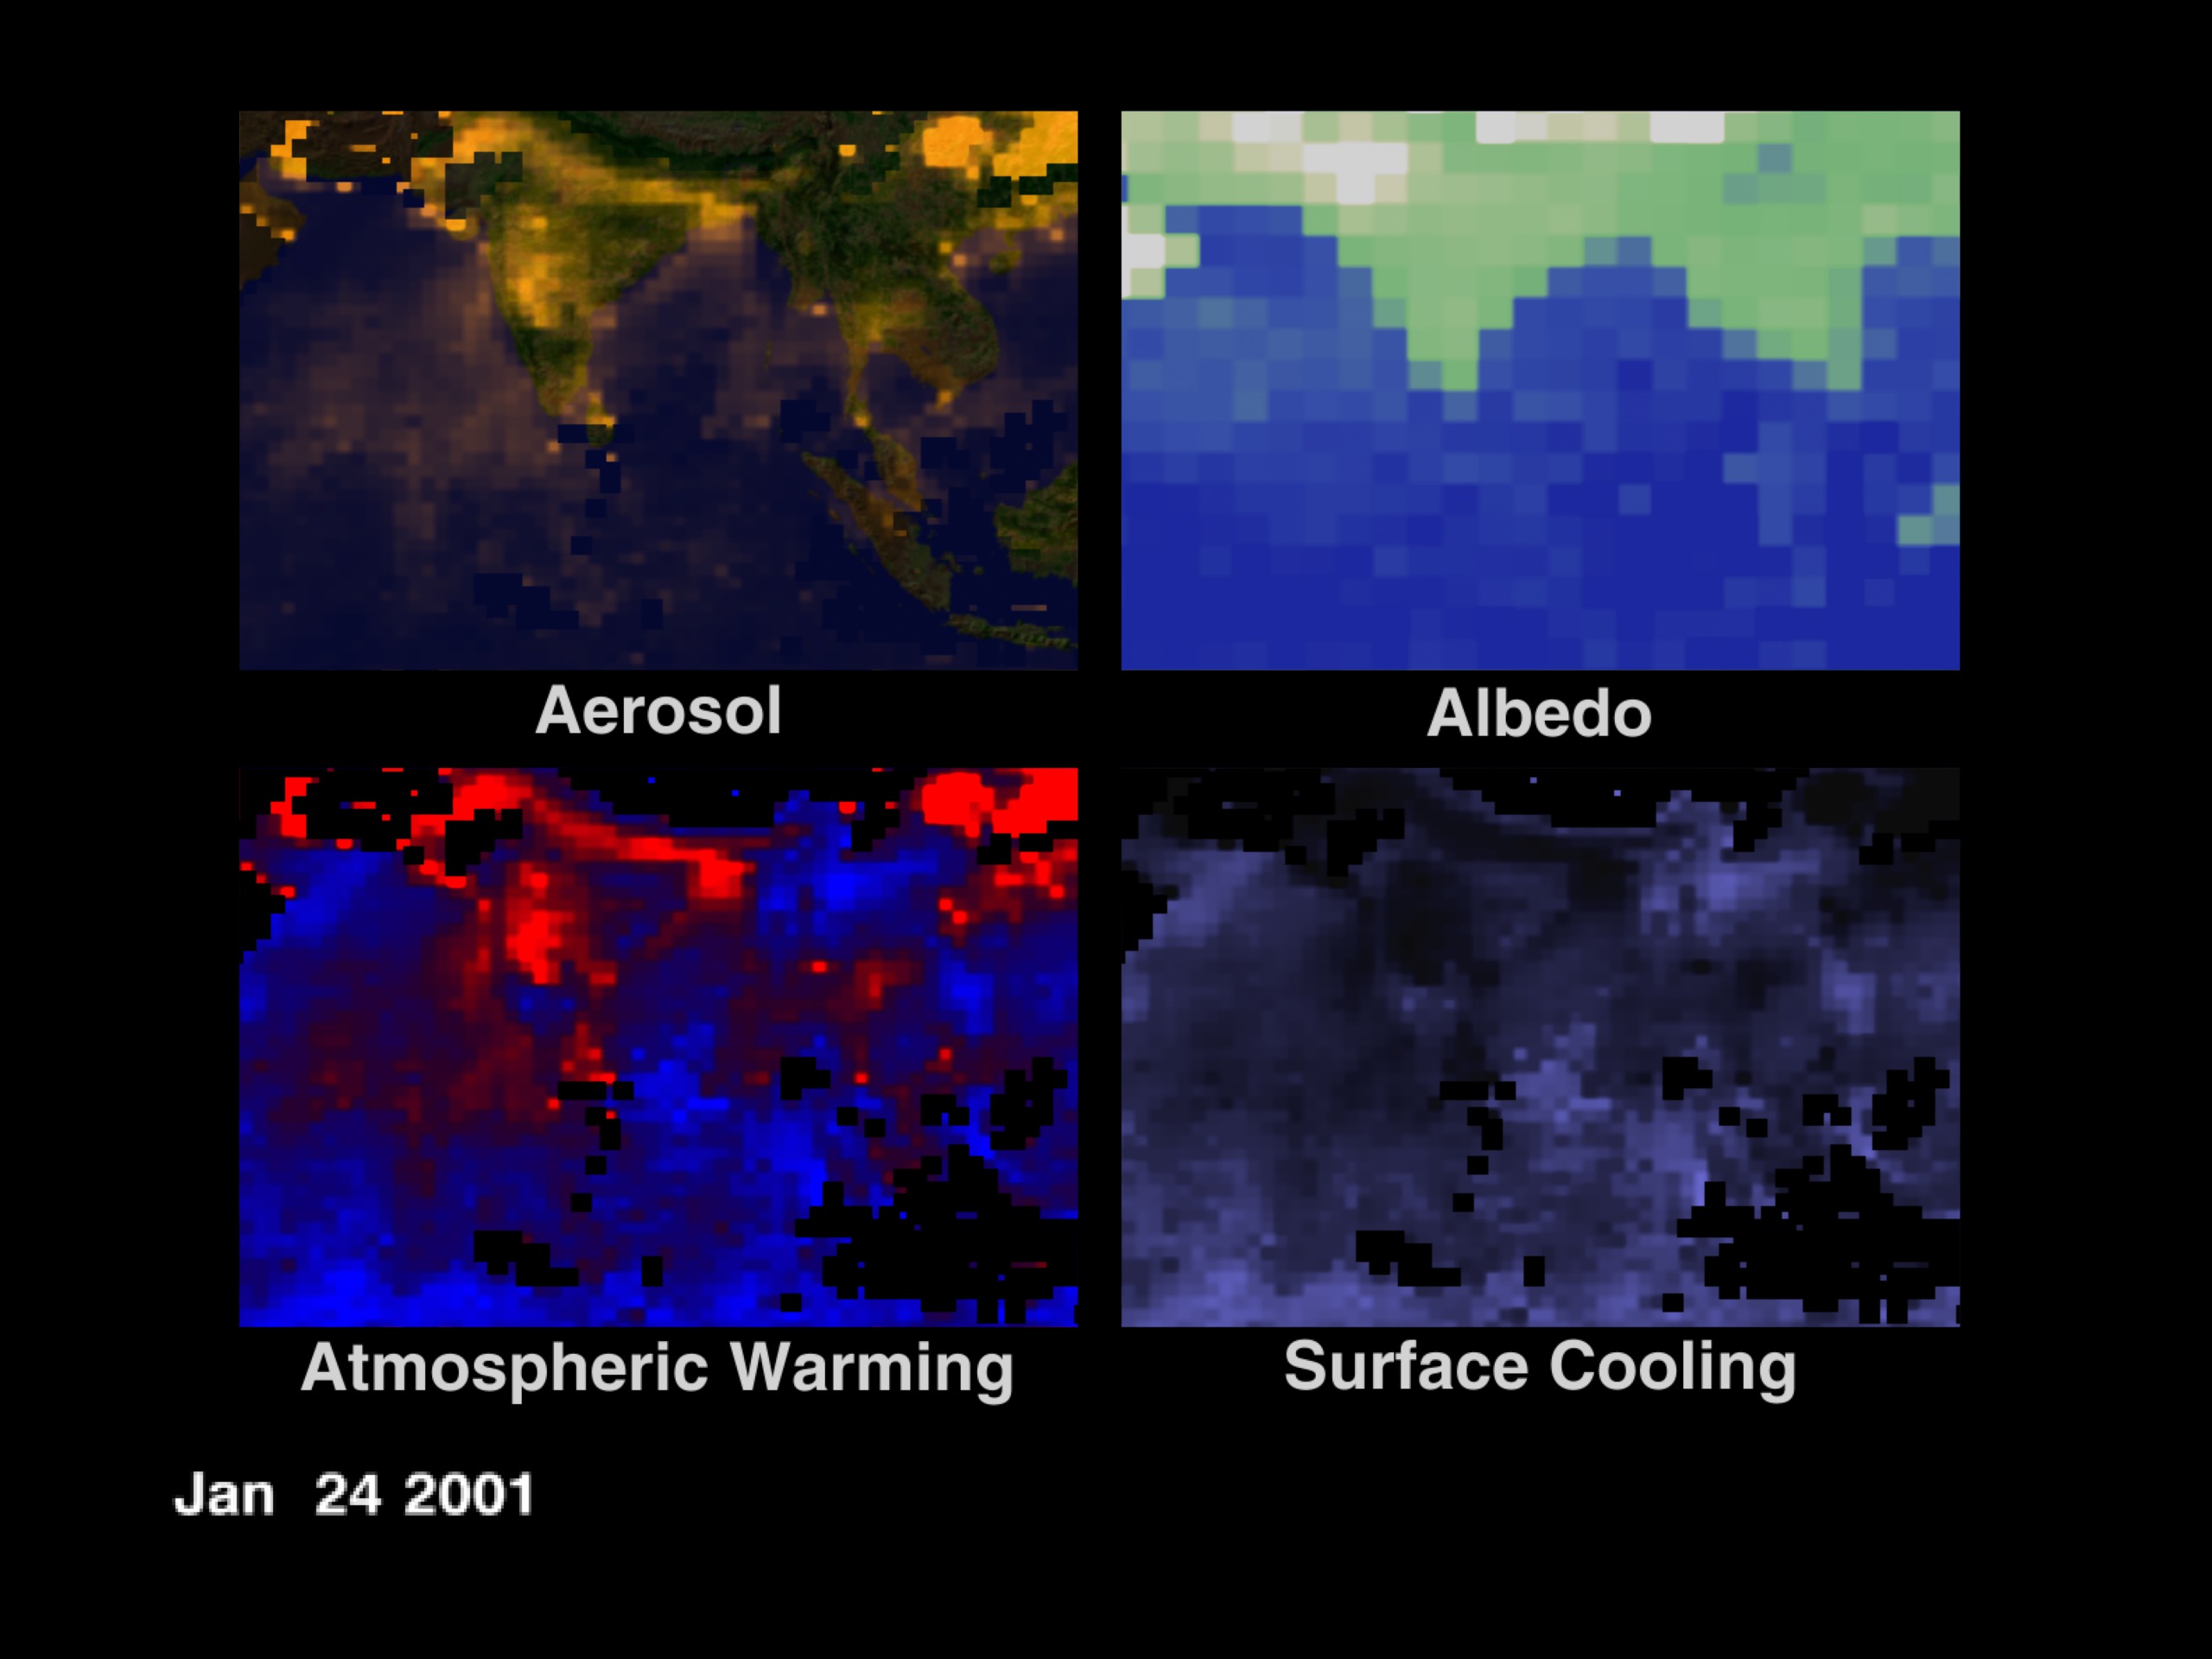
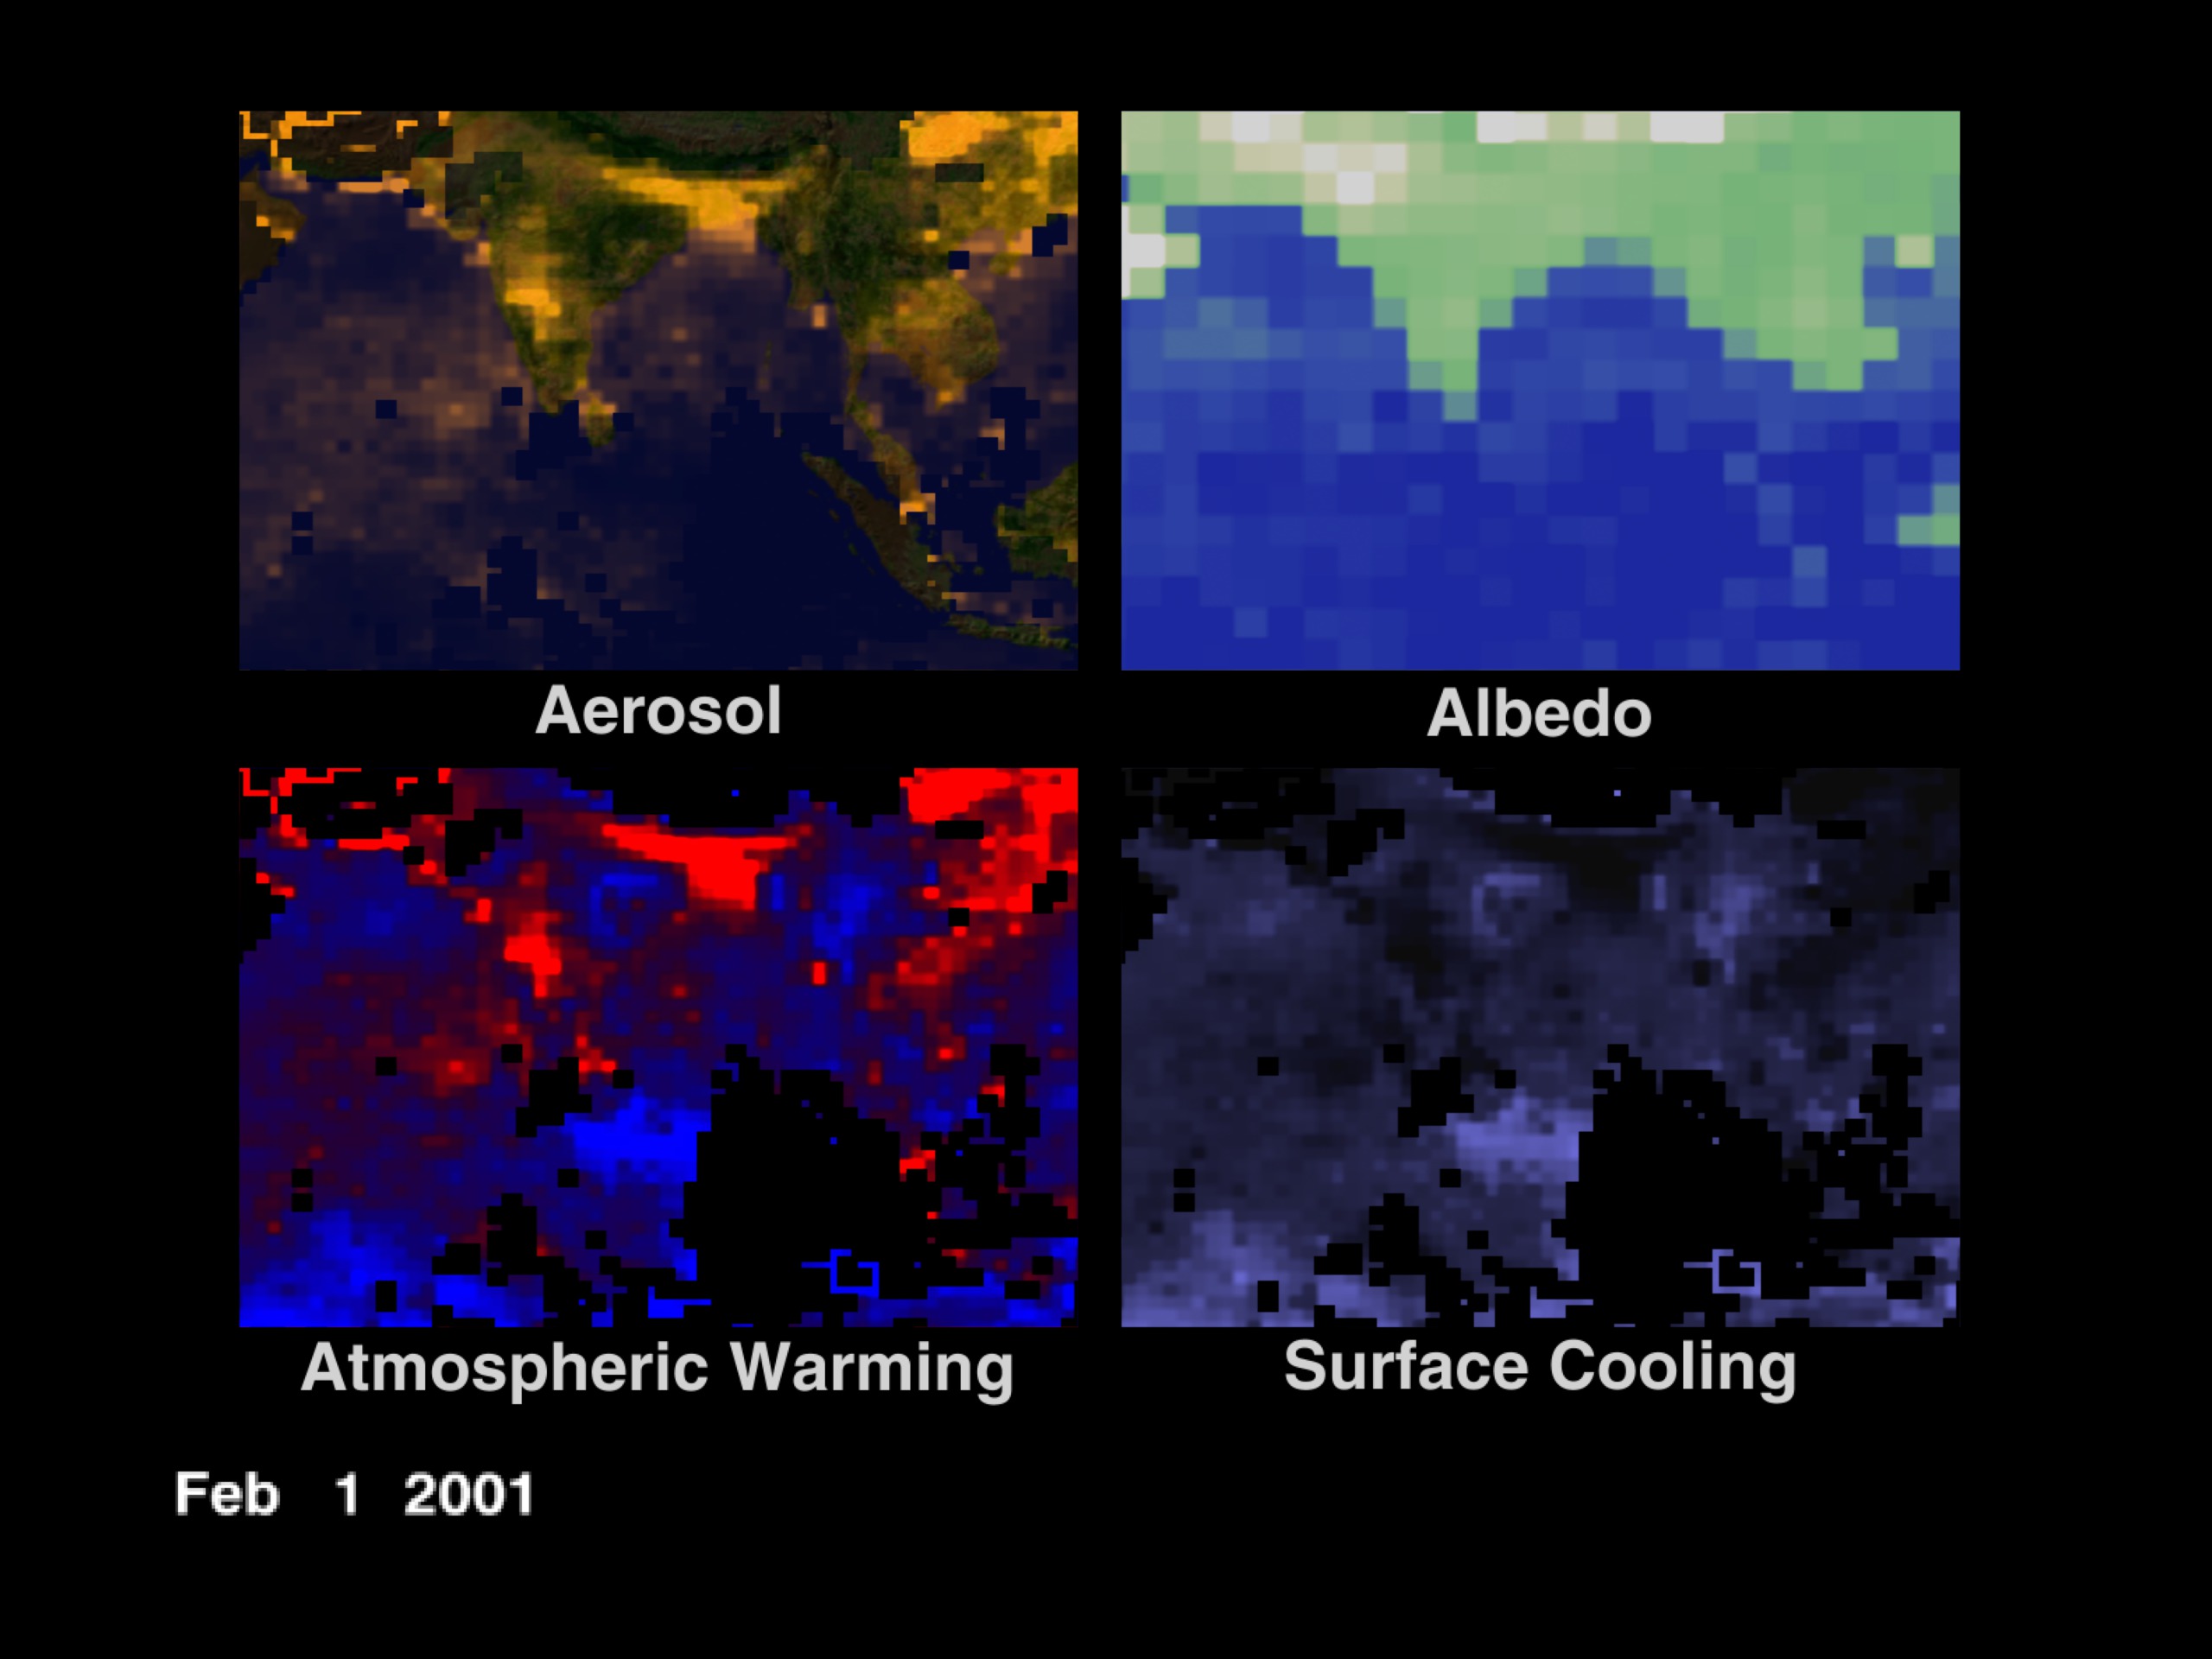
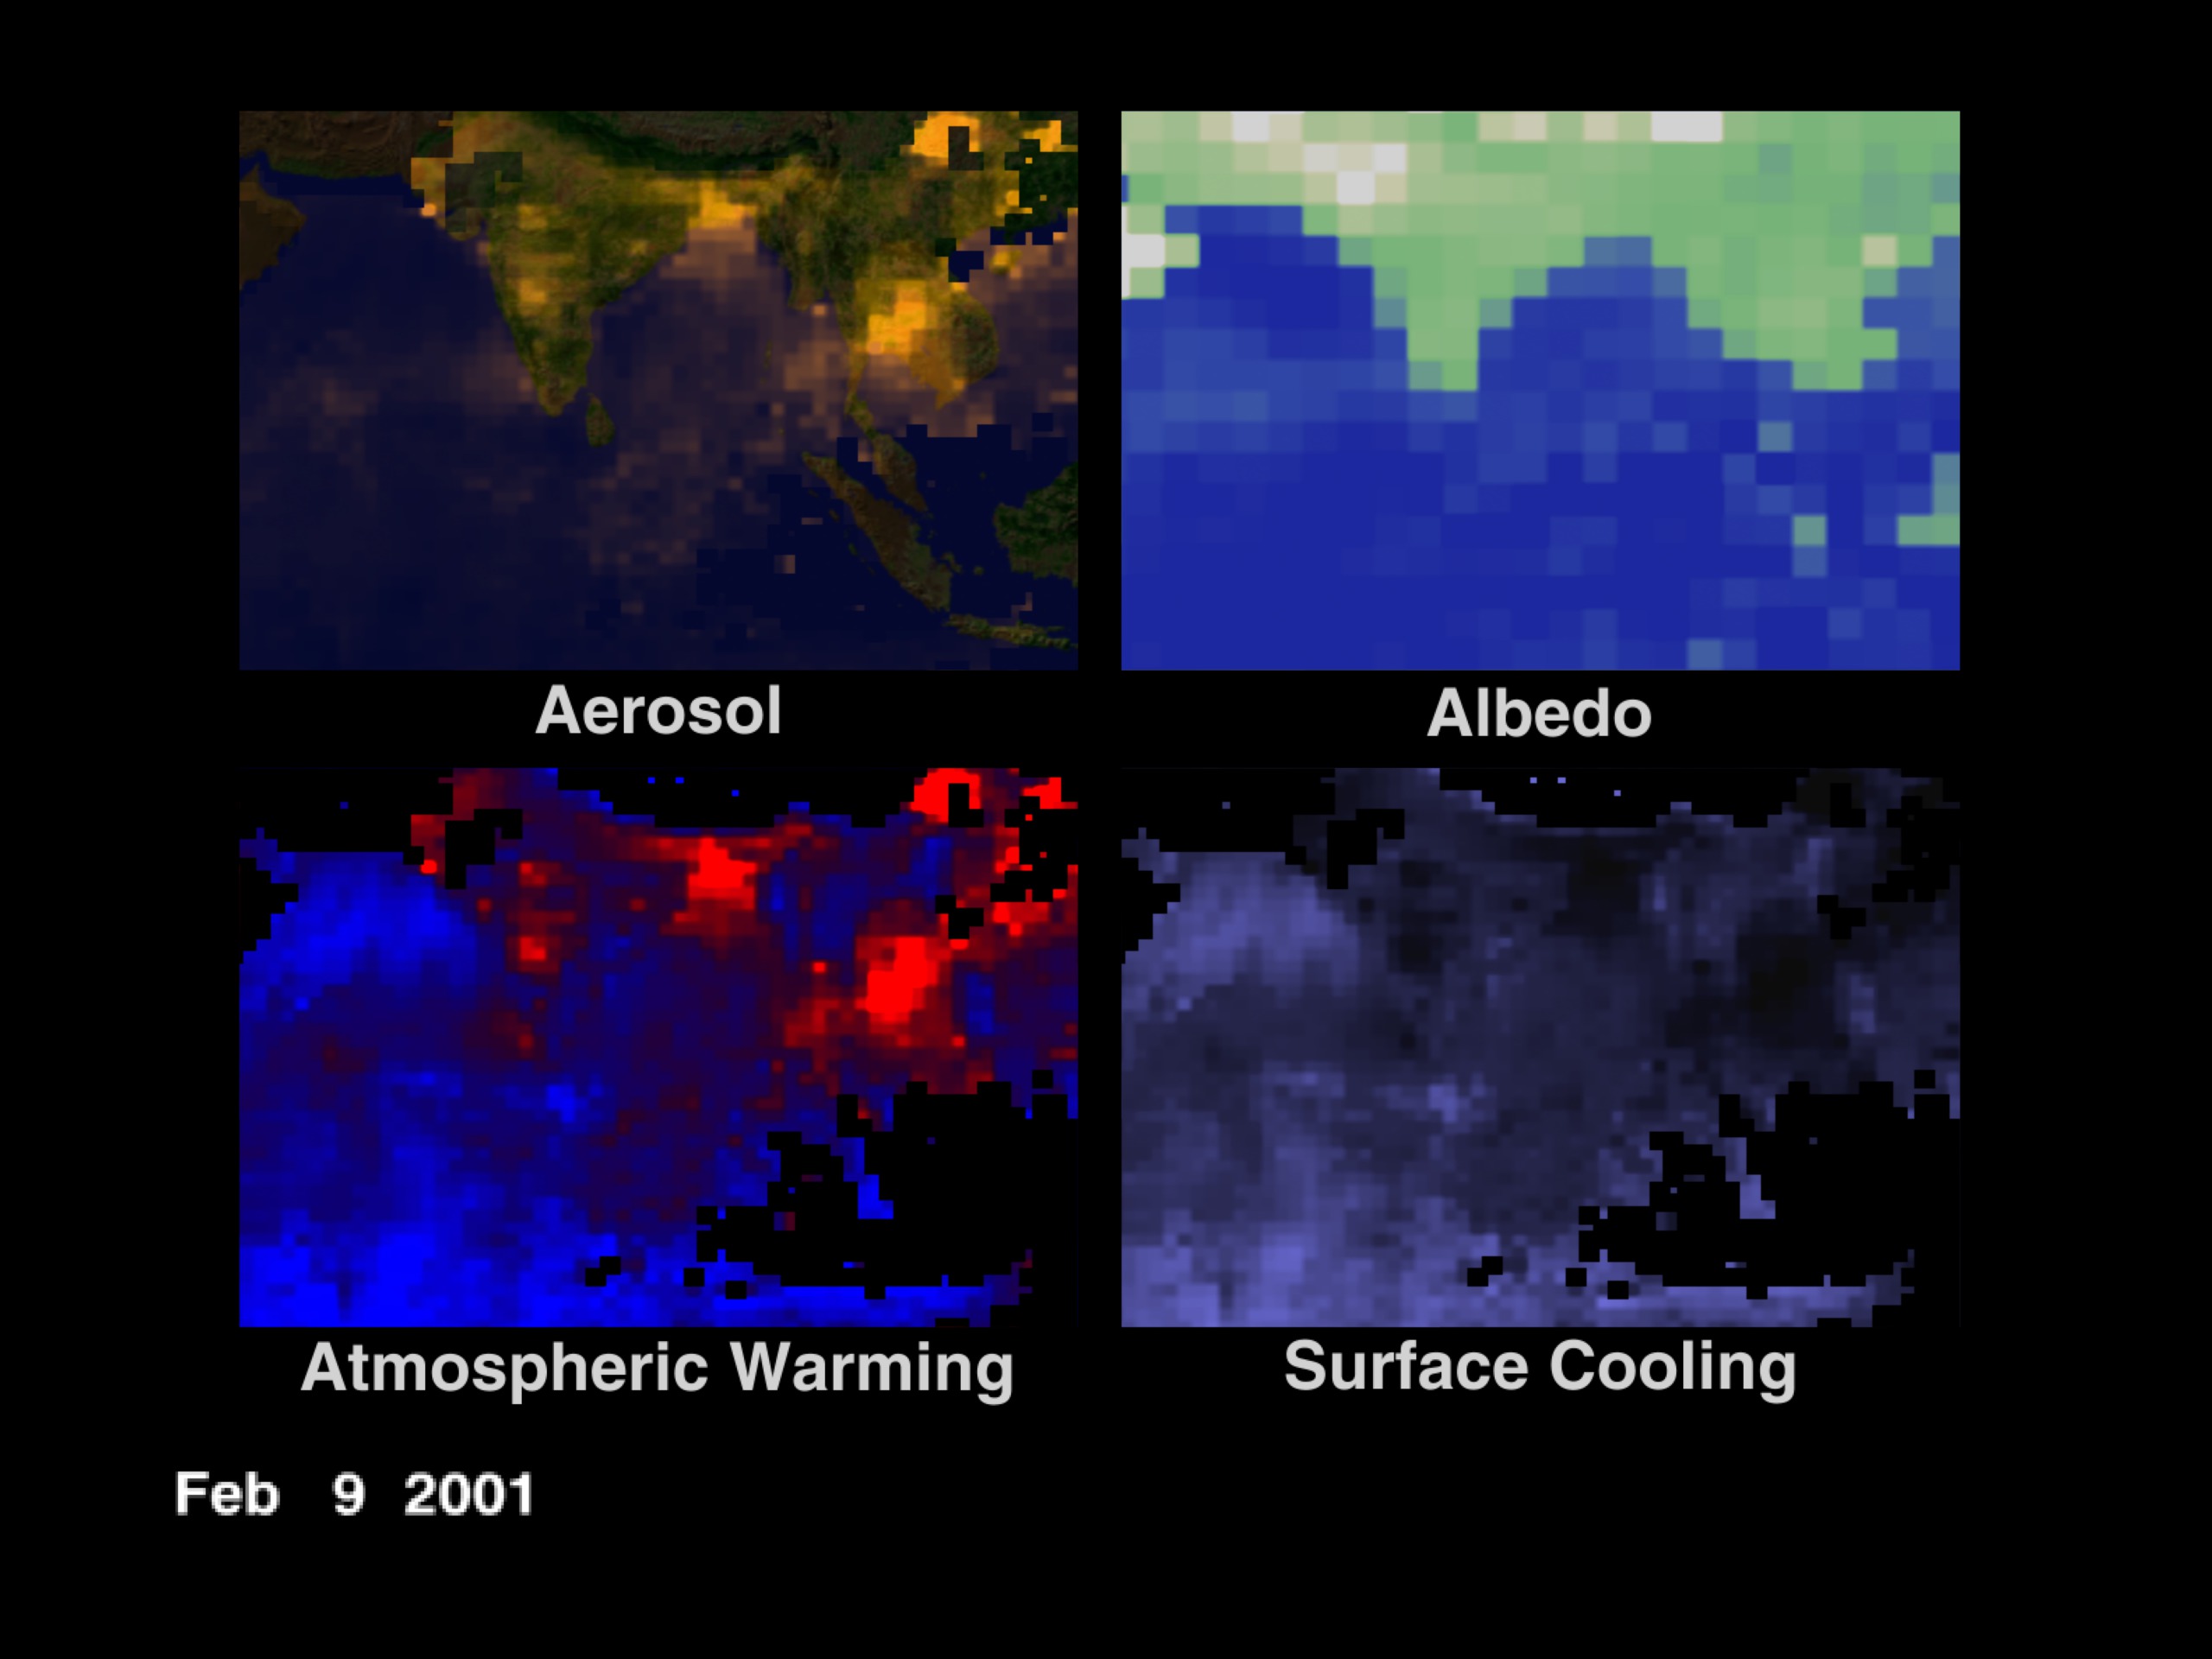
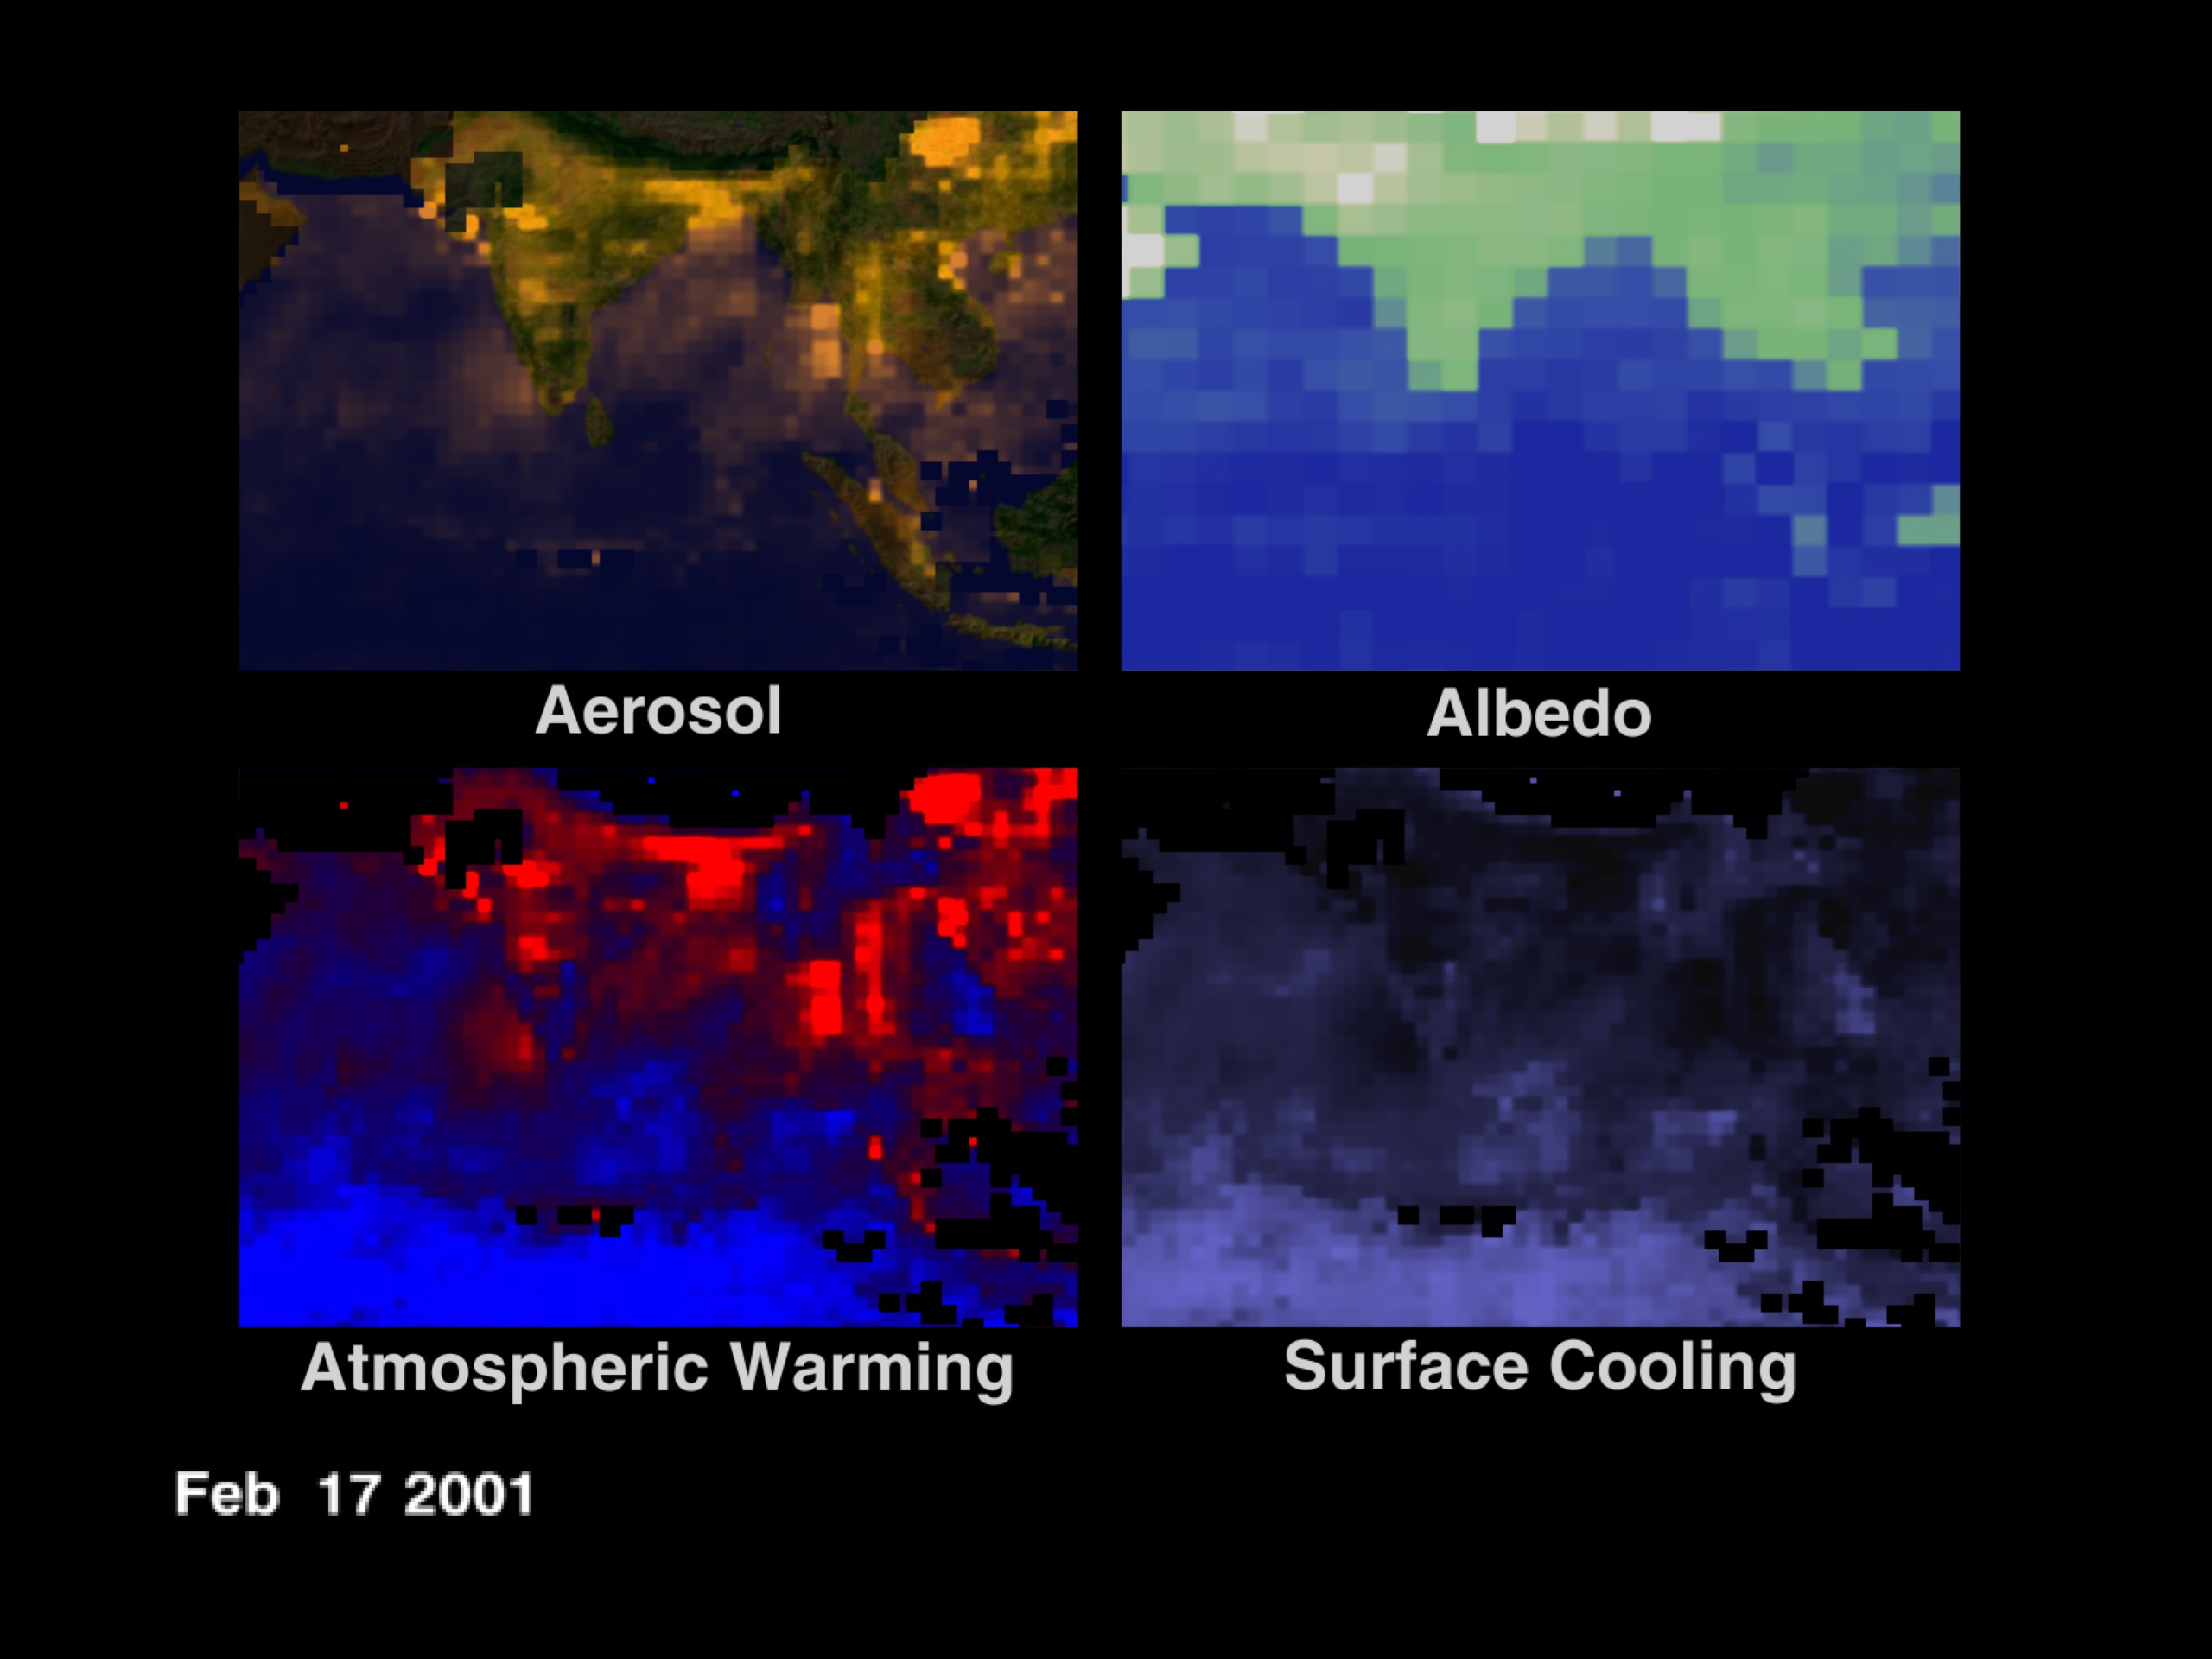
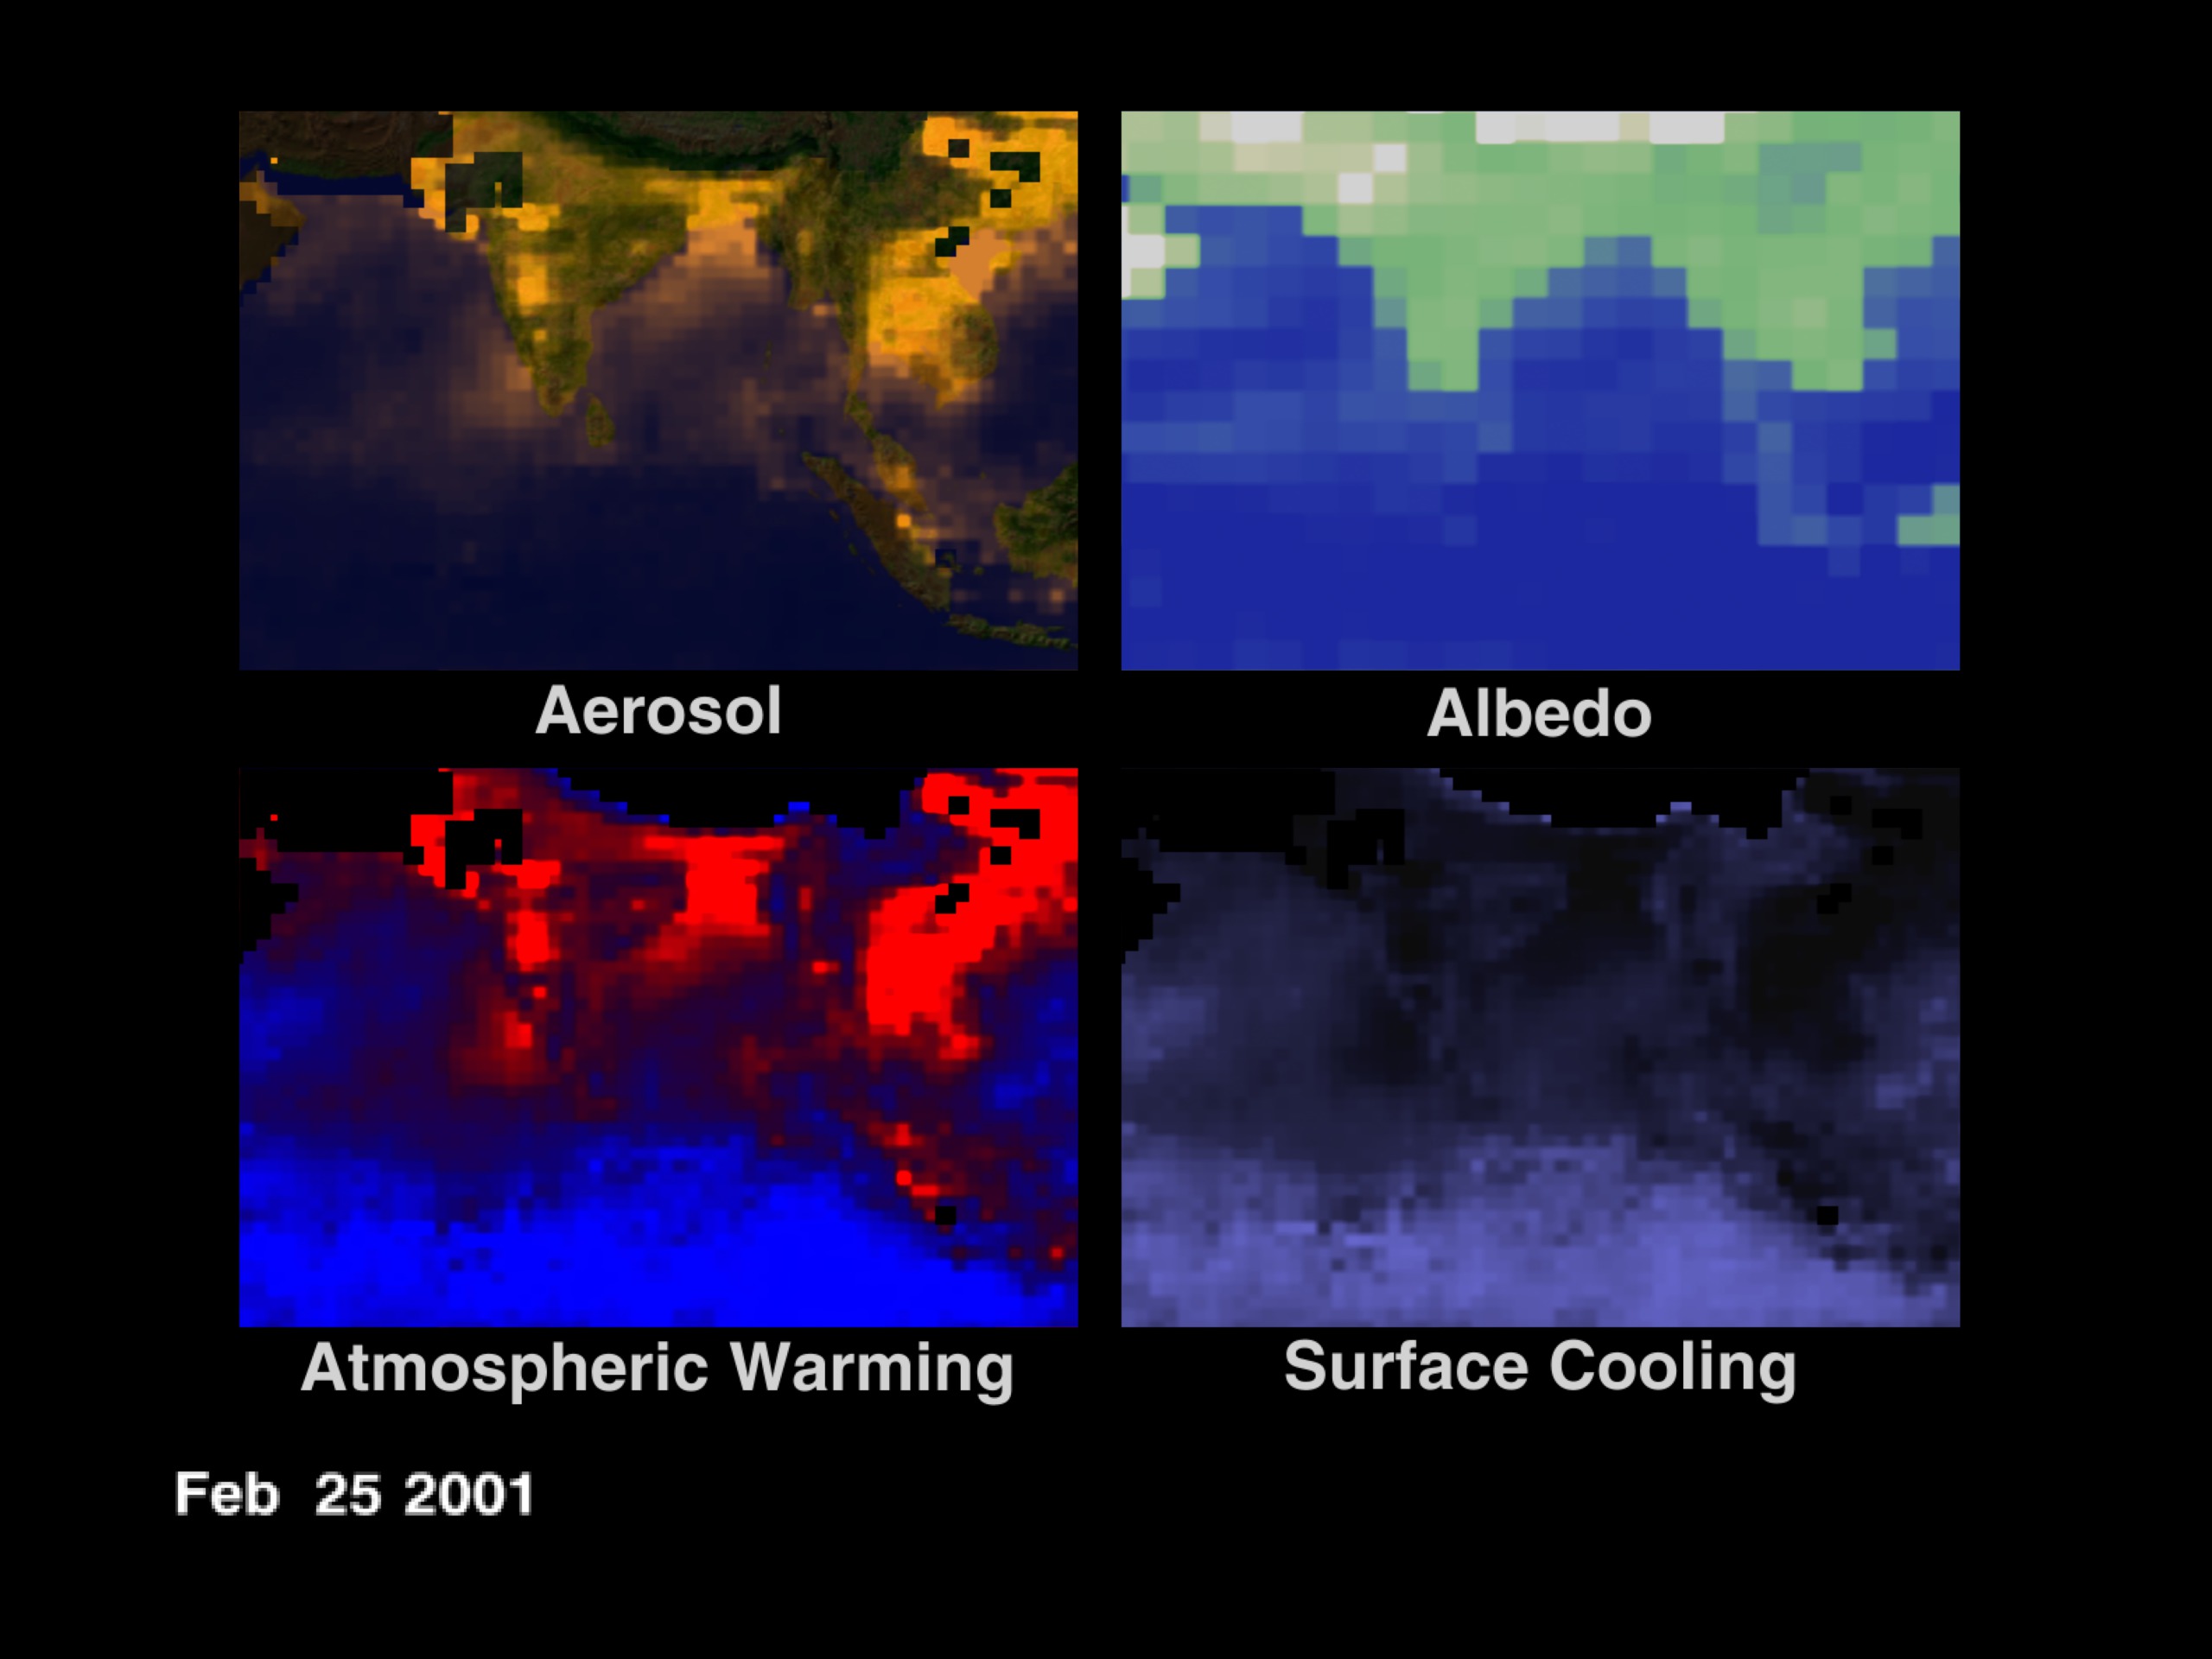
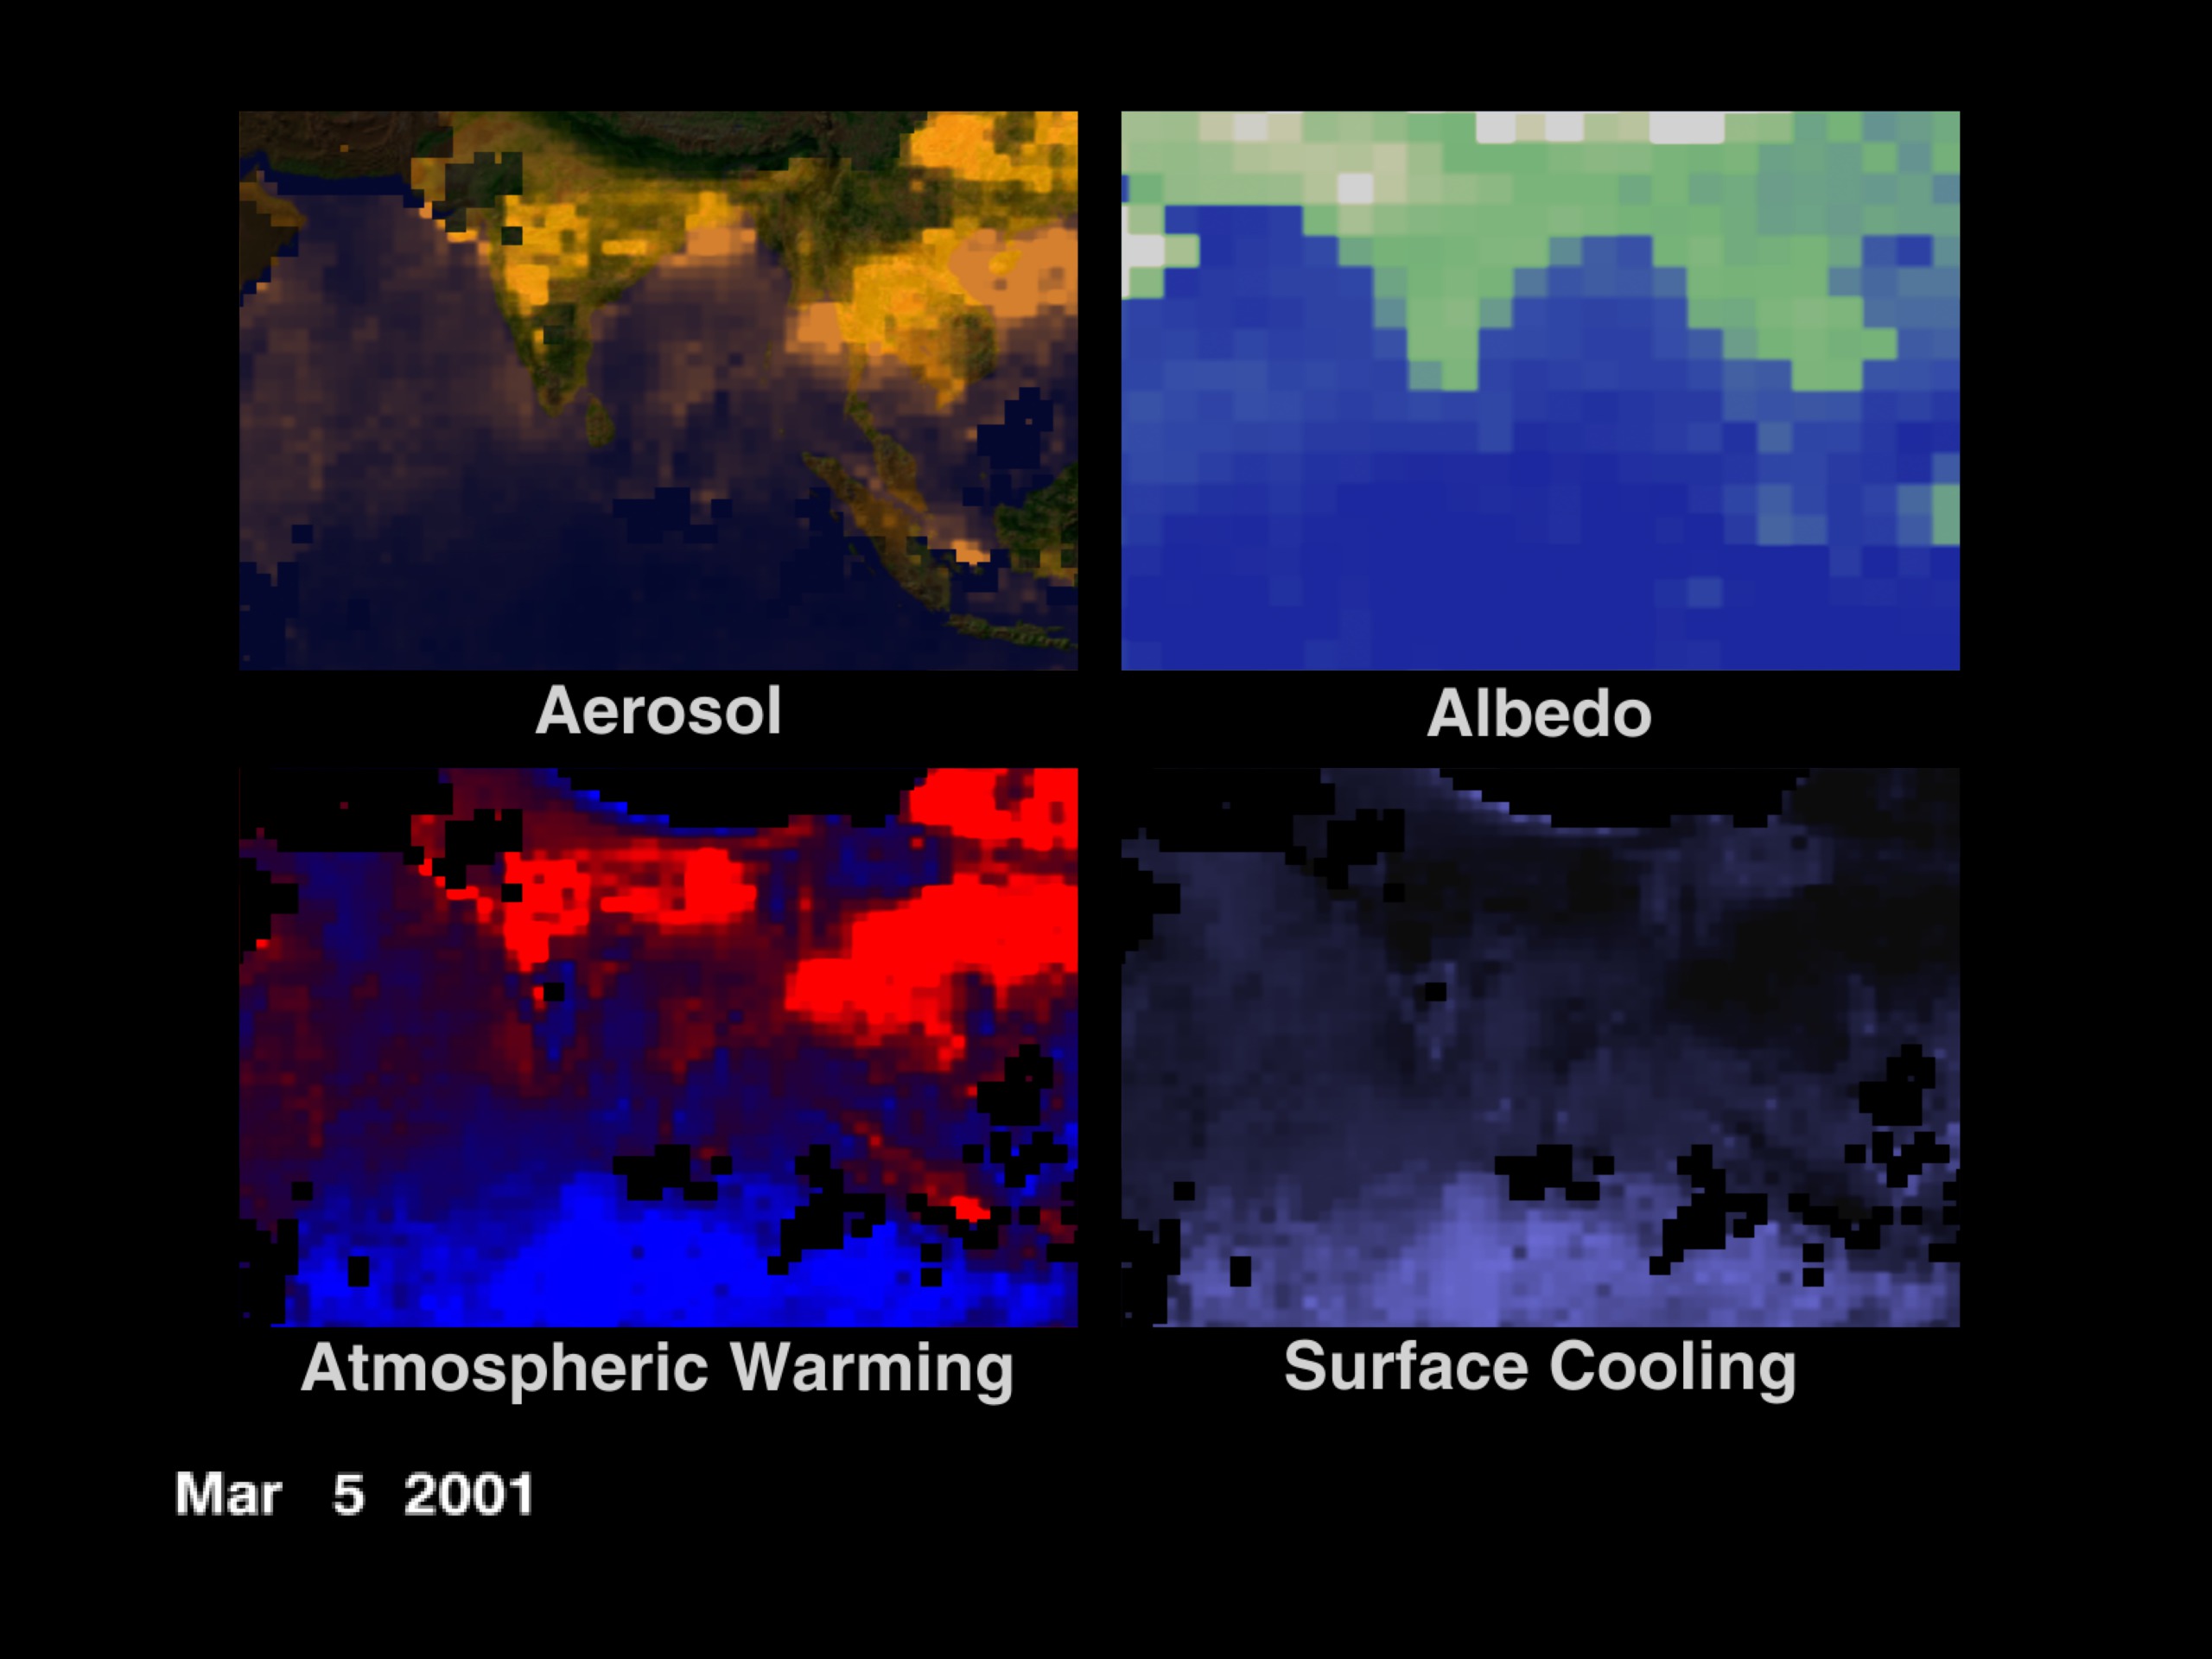
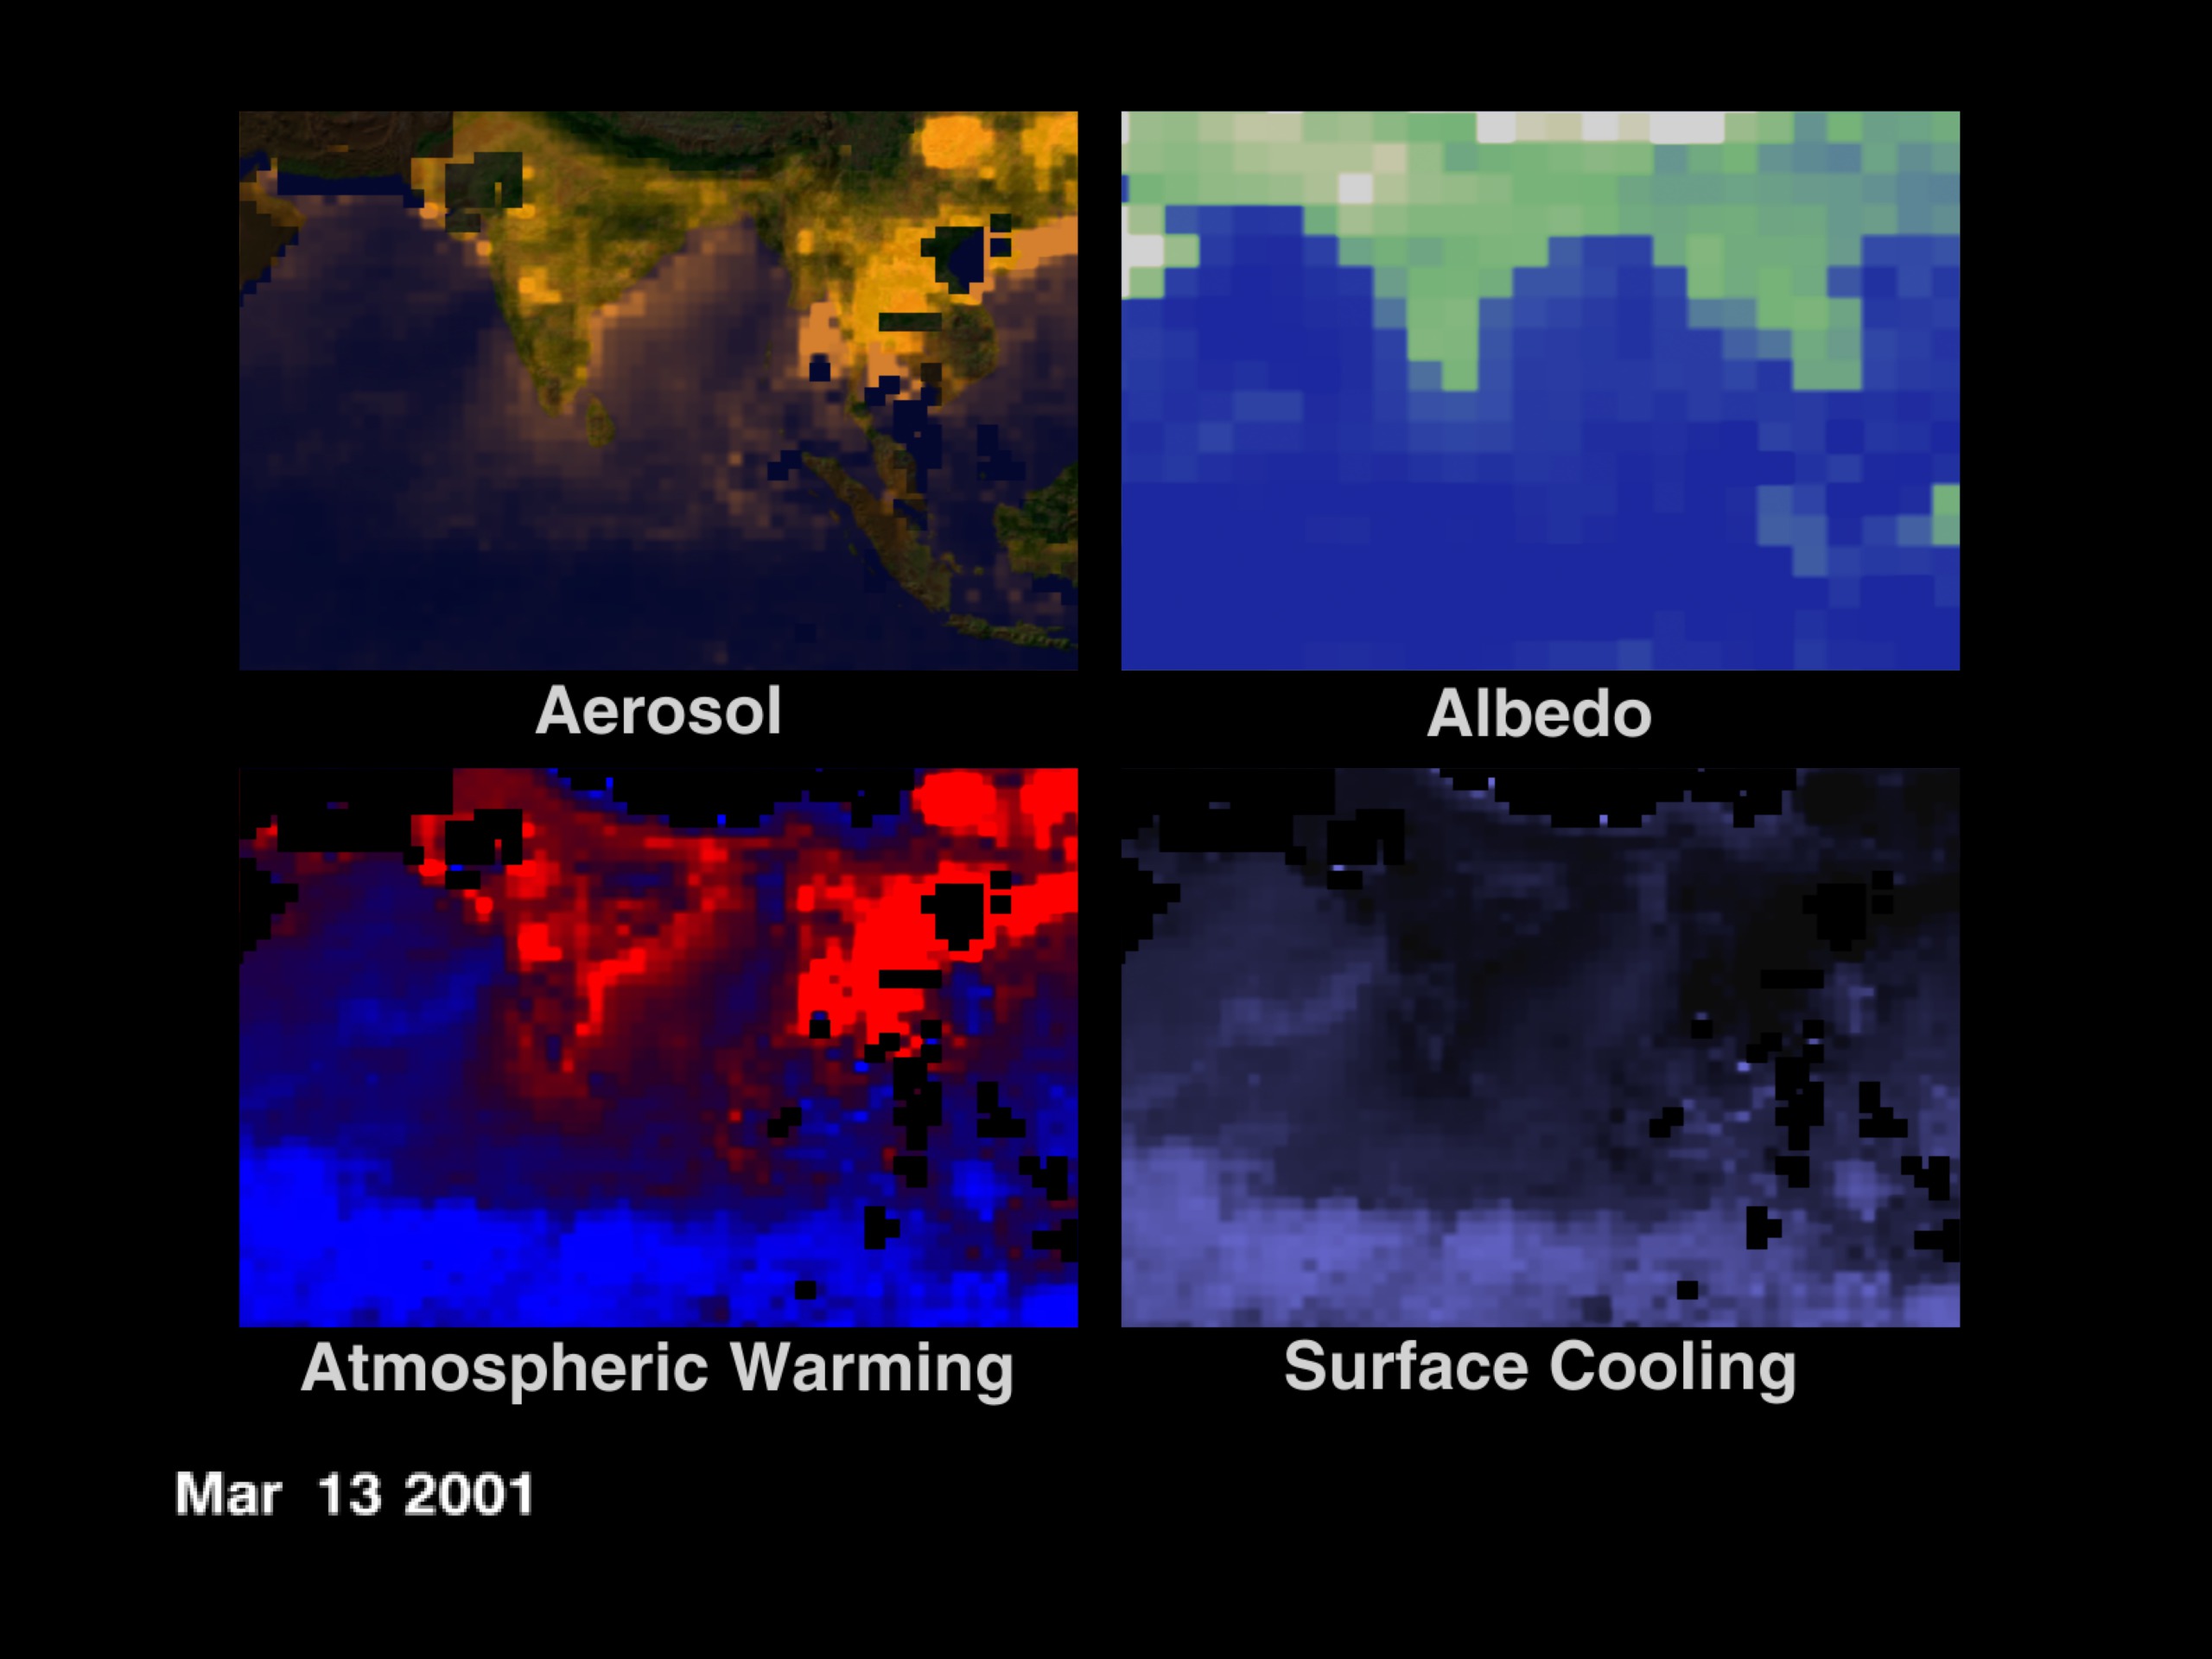
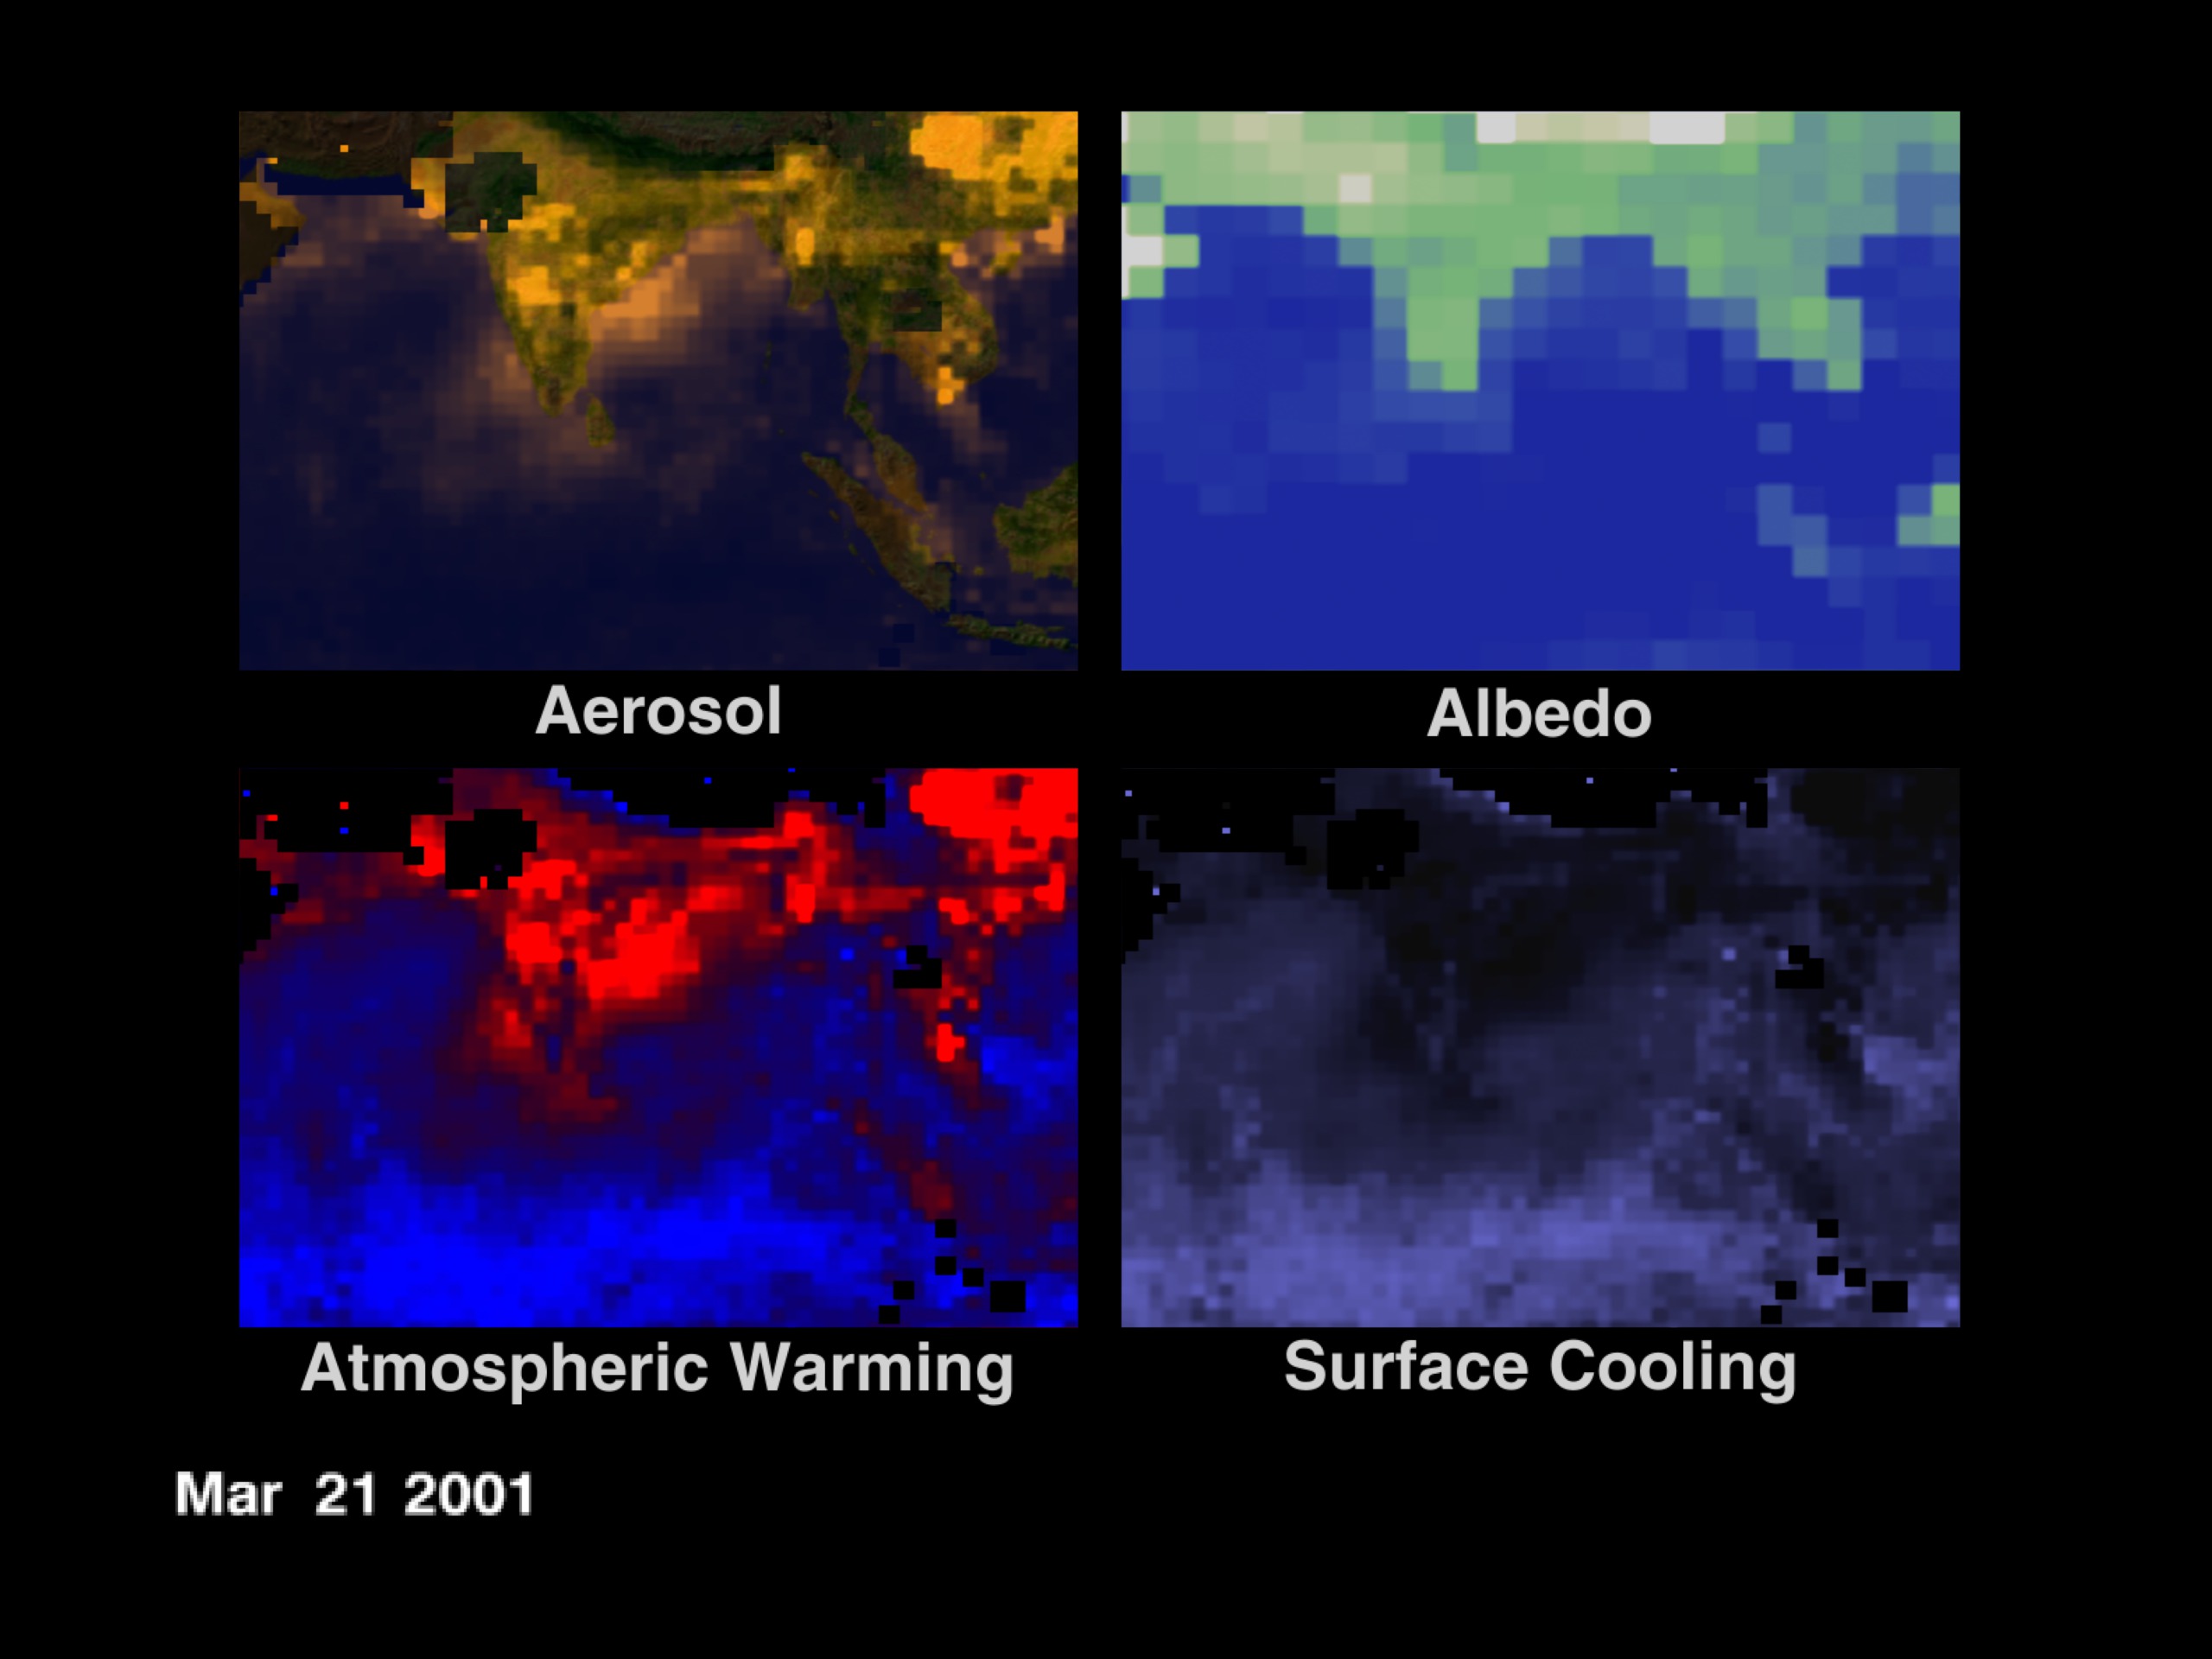
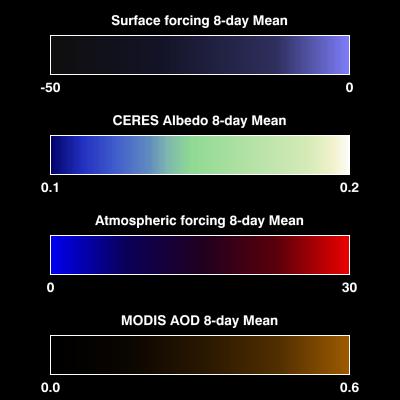
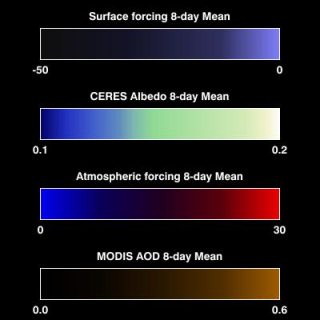
As the aerosol content and solar heating change with time, the atmosphere and the Earth's surface experience different warming and cooling. This animation displays a time series of the INDOEX region with 8-day averages showing aerosol and solar reflectance (albedo) data from the Terra satellite. From these, we see how these inputs generate warming of the atmosphere (Atmospheric Forcing - red regions) and cooling of the surface (Surface Forcing - dark regions). Areas of missing data (due to clouds, etc.) are either black or transparent.
Aerosols and Warming Change with Time - Version 2
Visualization Credits
Tom Bridgman (Global Science and Technology, Inc.): Lead Animator
Veerabhadran Ramanathan (Scripps Institution of Oceanography): Scientist
Anand K. Inamdar (Scripps Institution of Oceanography): Scientist
Veerabhadran Ramanathan (Scripps Institution of Oceanography): Scientist
Anand K. Inamdar (Scripps Institution of Oceanography): Scientist
Please give credit for this item to:
NASA/Goddard Space Flight Center Scientific Visualization Studio
NASA/Goddard Space Flight Center Scientific Visualization Studio
Short URL to share this page:
https://svs.gsfc.nasa.gov/2231
Mission:
Terra
Data Used:
Note: While we identify the data sets used in these visualizations, we do not store any further details nor the data sets themselves on our site.
This item is part of this series:
Aerosols and Warming
Keywords:
DLESE >> Atmospheric science
GCMD >> Earth Science >> Atmosphere >> Aerosols
SVS >> CERES
NASA Science >> Earth
GCMD keywords can be found on the Internet with the following citation: Olsen, L.M., G. Major, K. Shein, J. Scialdone, S. Ritz, T. Stevens, M. Morahan, A. Aleman, R. Vogel, S. Leicester, H. Weir, M. Meaux, S. Grebas, C.Solomon, M. Holland, T. Northcutt, R. A. Restrepo, R. Bilodeau, 2013. NASA/Global Change Master Directory (GCMD) Earth Science Keywords. Version 8.0.0.0.0
https://svs.gsfc.nasa.gov/2231
Mission:
Terra
Data Used:
Terra/CERES
2001/01/01-2001/03/21
The CERES instrument aboard many Earth-orbiting satellites records the flow of reflected Solar radiation and reprocessed longwave radiation in the Earth's radiation budget.
Terra/MODIS
2001/01/01-2001/03/21This item is part of this series:
Aerosols and Warming
Keywords:
DLESE >> Atmospheric science
GCMD >> Earth Science >> Atmosphere >> Aerosols
SVS >> CERES
NASA Science >> Earth
GCMD keywords can be found on the Internet with the following citation: Olsen, L.M., G. Major, K. Shein, J. Scialdone, S. Ritz, T. Stevens, M. Morahan, A. Aleman, R. Vogel, S. Leicester, H. Weir, M. Meaux, S. Grebas, C.Solomon, M. Holland, T. Northcutt, R. A. Restrepo, R. Bilodeau, 2013. NASA/Global Change Master Directory (GCMD) Earth Science Keywords. Version 8.0.0.0.0


