Currrent IMERG Accumulated Anomaly

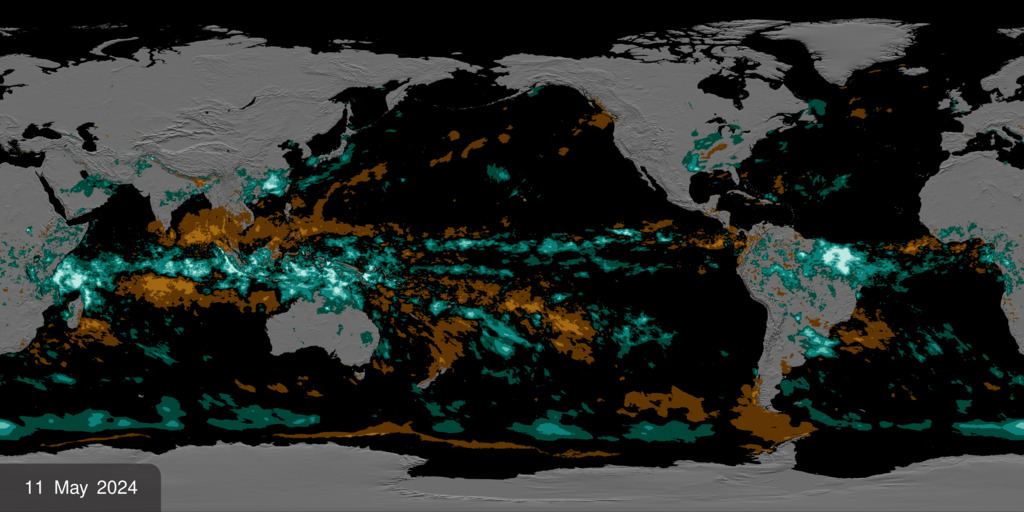
Global IMERG accumulated anomalies in Robinson projection. (Unannotated versions can be downloaded here as well.)
The IMERG accumulated precipitation anomalies from June 1, 2026, to the present represent the total deviation of global rainfall from historical averages over this specific period, serving as a distinct visual footprint of El Niño’s disruption of normal weather patterns. Because the IMERG (Integrated Multi-satellitE Retrievals for GPM) network tracks precise precipitation data, calculating the accumulated anomalies reveals exactly where prolonged dry or wet spells have taken hold. In the context of an El Niño event, this visualization typically illustrates a massive shift in atmospheric circulation, characterized by significant precipitation deficits (negative anomalies depicted in browns) over regions like Indonesia, northern Australia, and parts of the Amazon, contrasted with intense, above-average rainfall (positive anomalies depicted in cyan) migrating into the central and eastern equatorial Pacific. Ultimately, tracking these accumulations over this exact multi-month timeframe allows scientists to quantify the magnitude of El Niño-driven climate teleconnections and clearly visualize the regions experiencing resulting drought or flood risks.
Robinson projected IMERG accumulated anamalies only over land highlight the areas of drought and unusual wetness around the globe. (Unannotated versions can be downloaded here.)
Global IMERG accumulated anomalies in Plate Carree projection. (Unannotated versions can be downloaded here as well.)
Plate Carree projected IMERG accumulated anamalies only over land highlight the areas of drought and unusual wetness around the globe. (Unannotated versions can be downloaded here.)

IMERG Accumulated Anomaly Colorbar where browns are areas with less than usual precipitation and areas in blue are greater than usual precipitation.
Credits
Please give credit for this item to:
NASA's Scientific Visualization Studio
-
Visualizer
-
Alex Kekesi
(ADNET Systems, Inc.)

-
Alex Kekesi
(ADNET Systems, Inc.)
-
Scientists
-
George Huffman
(NASA/GSFC)
- Jason West (eMITS)
- Owen Kelley (George Mason University)
-
George Huffman
(NASA/GSFC)
-
Technical support
- Laurence Schuler (ADNET Systems, Inc.)
- Ian Jones (ADNET Systems, Inc.)
Datasets used
-
IMERG
ID: 863This dataset can be found at: http://pmm.nasa.gov/sites/default/files/document_files/IMERG_ATBD_V4.4.pdf
See all pages that use this dataset
Note: While we identify the data sets used on this page, we do not store any further details, nor the data sets themselves on our site.
Related
Release date
This page was originally published on Wednesday, October 21, 2026.
This page was last updated on Wednesday, October 21, 2026 at 1:06 PM EDT.