Earth
ID: 2195
SeaWiFS 3 year data of the pulse of the planet, helps show the Carbon Build up in the air. For this presentation the Scientist wanted to show how the earth reacts to the chemicals in the air.

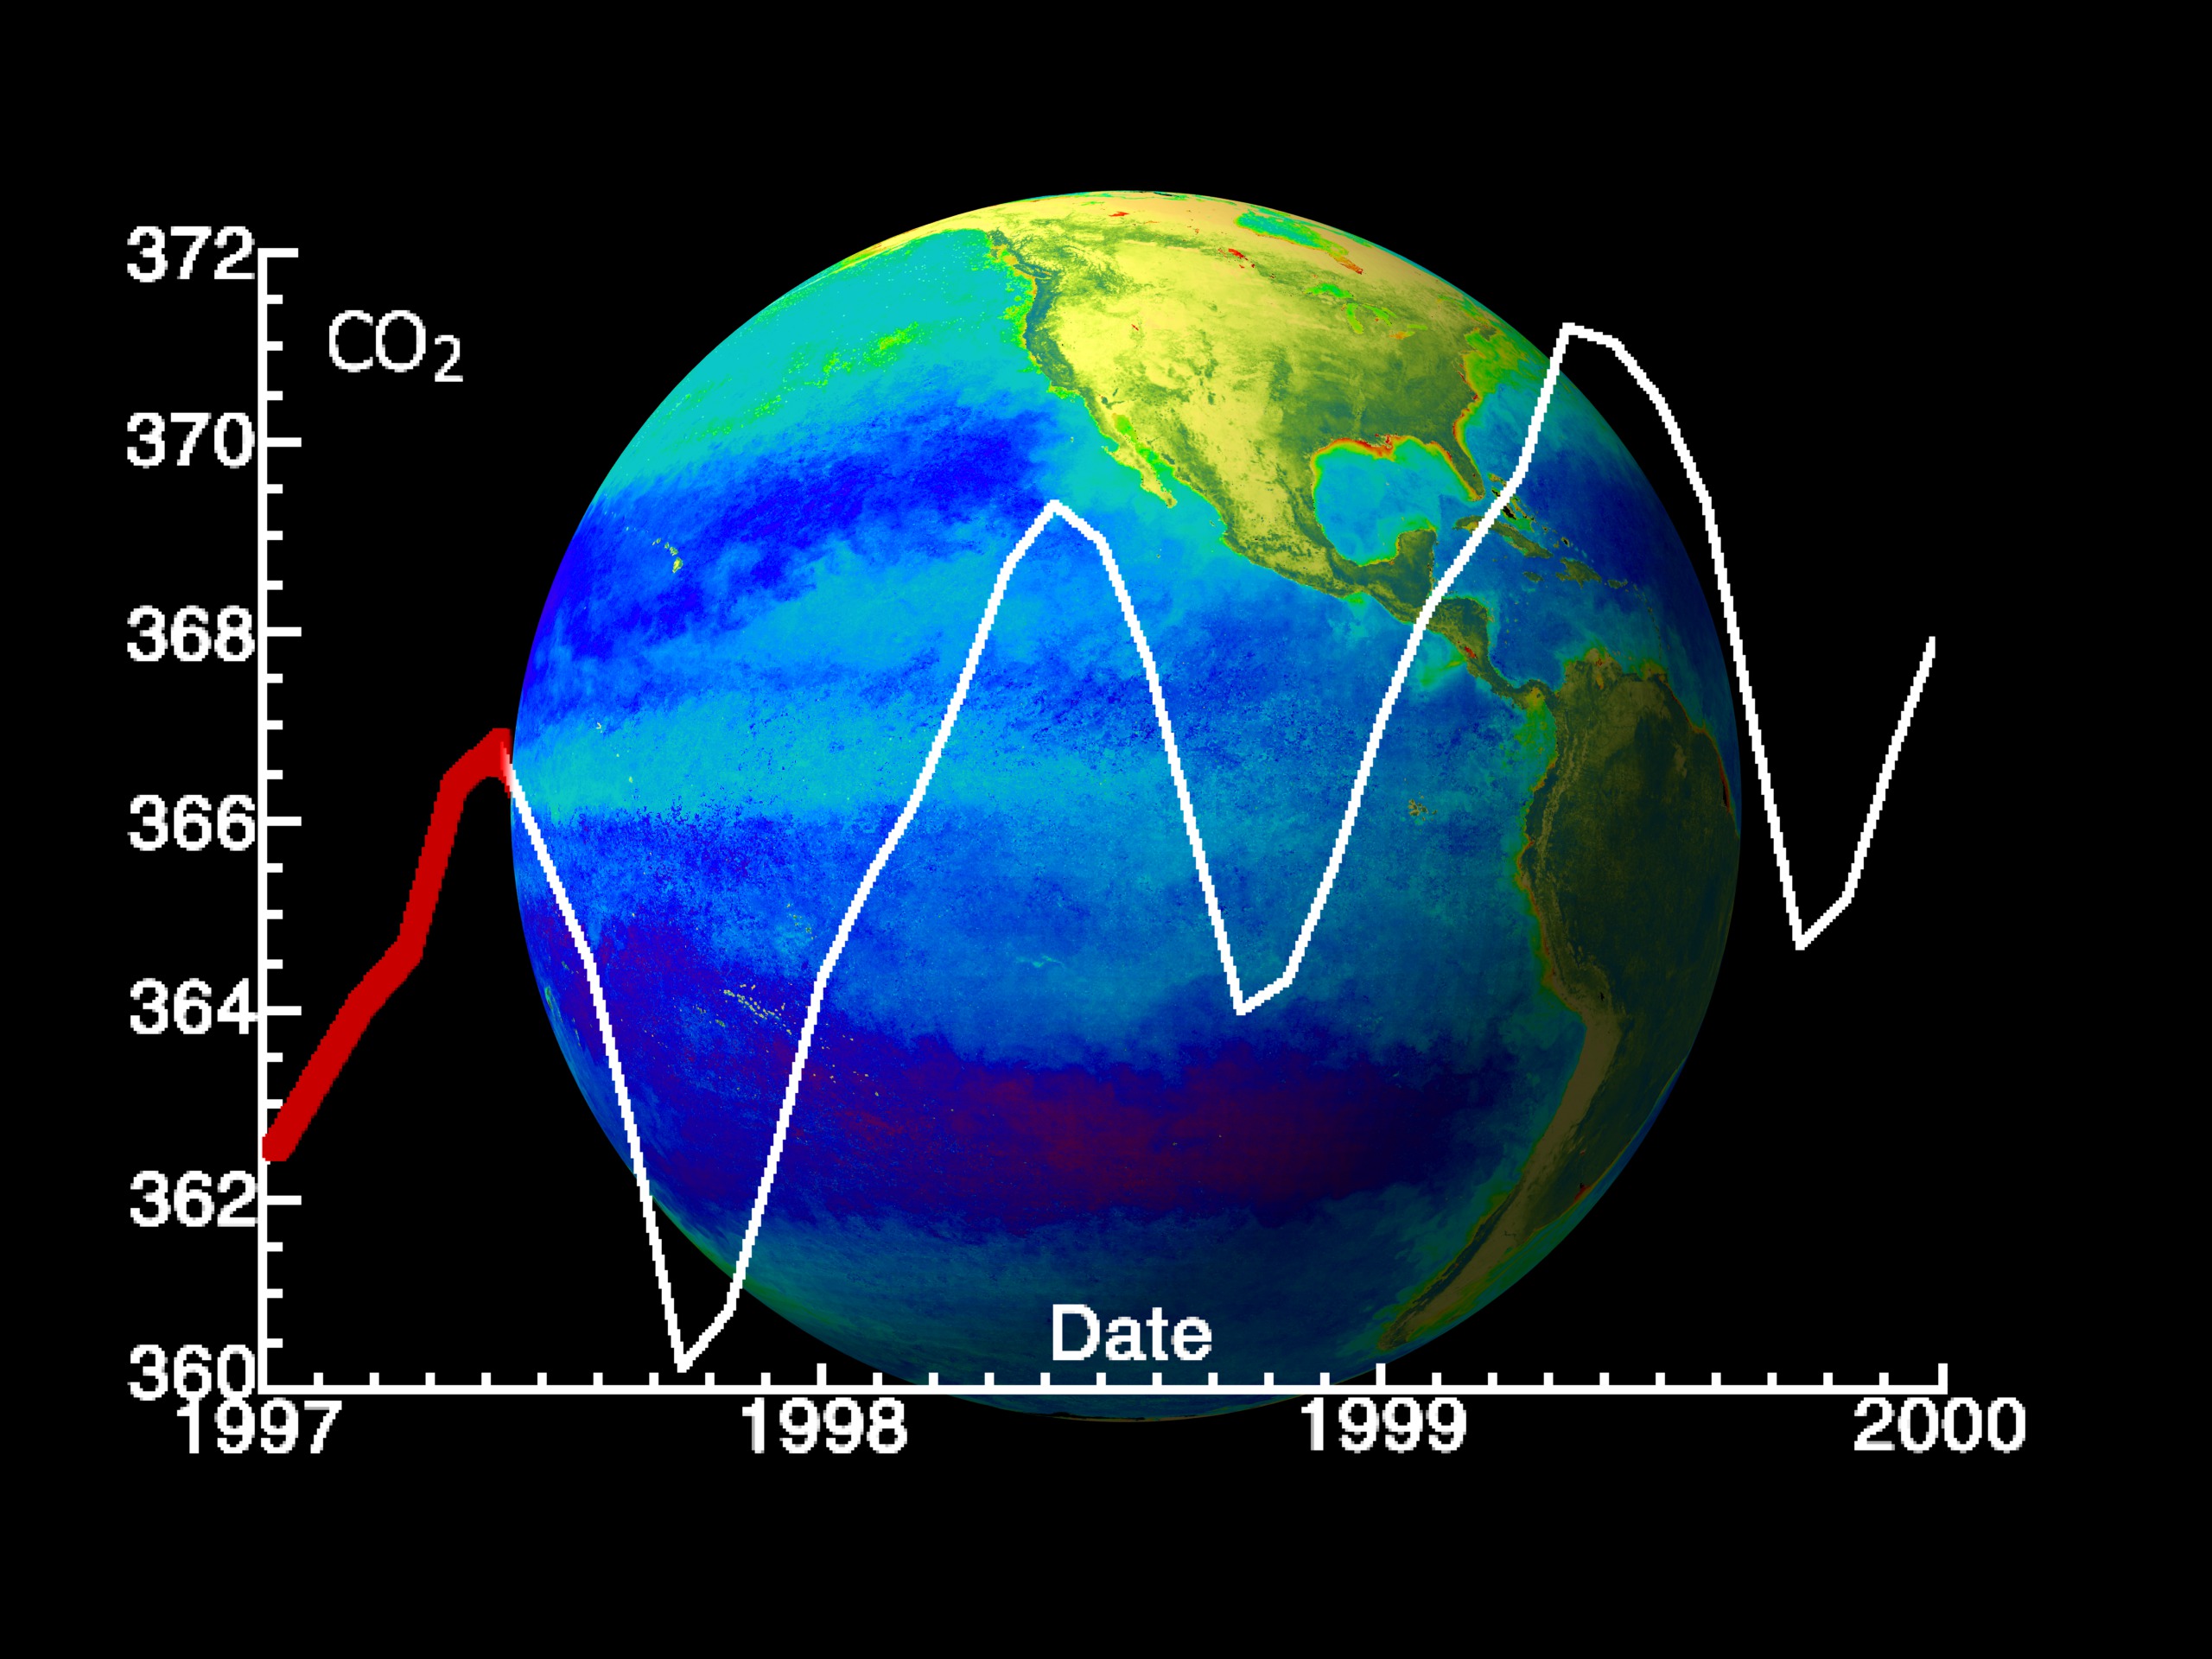

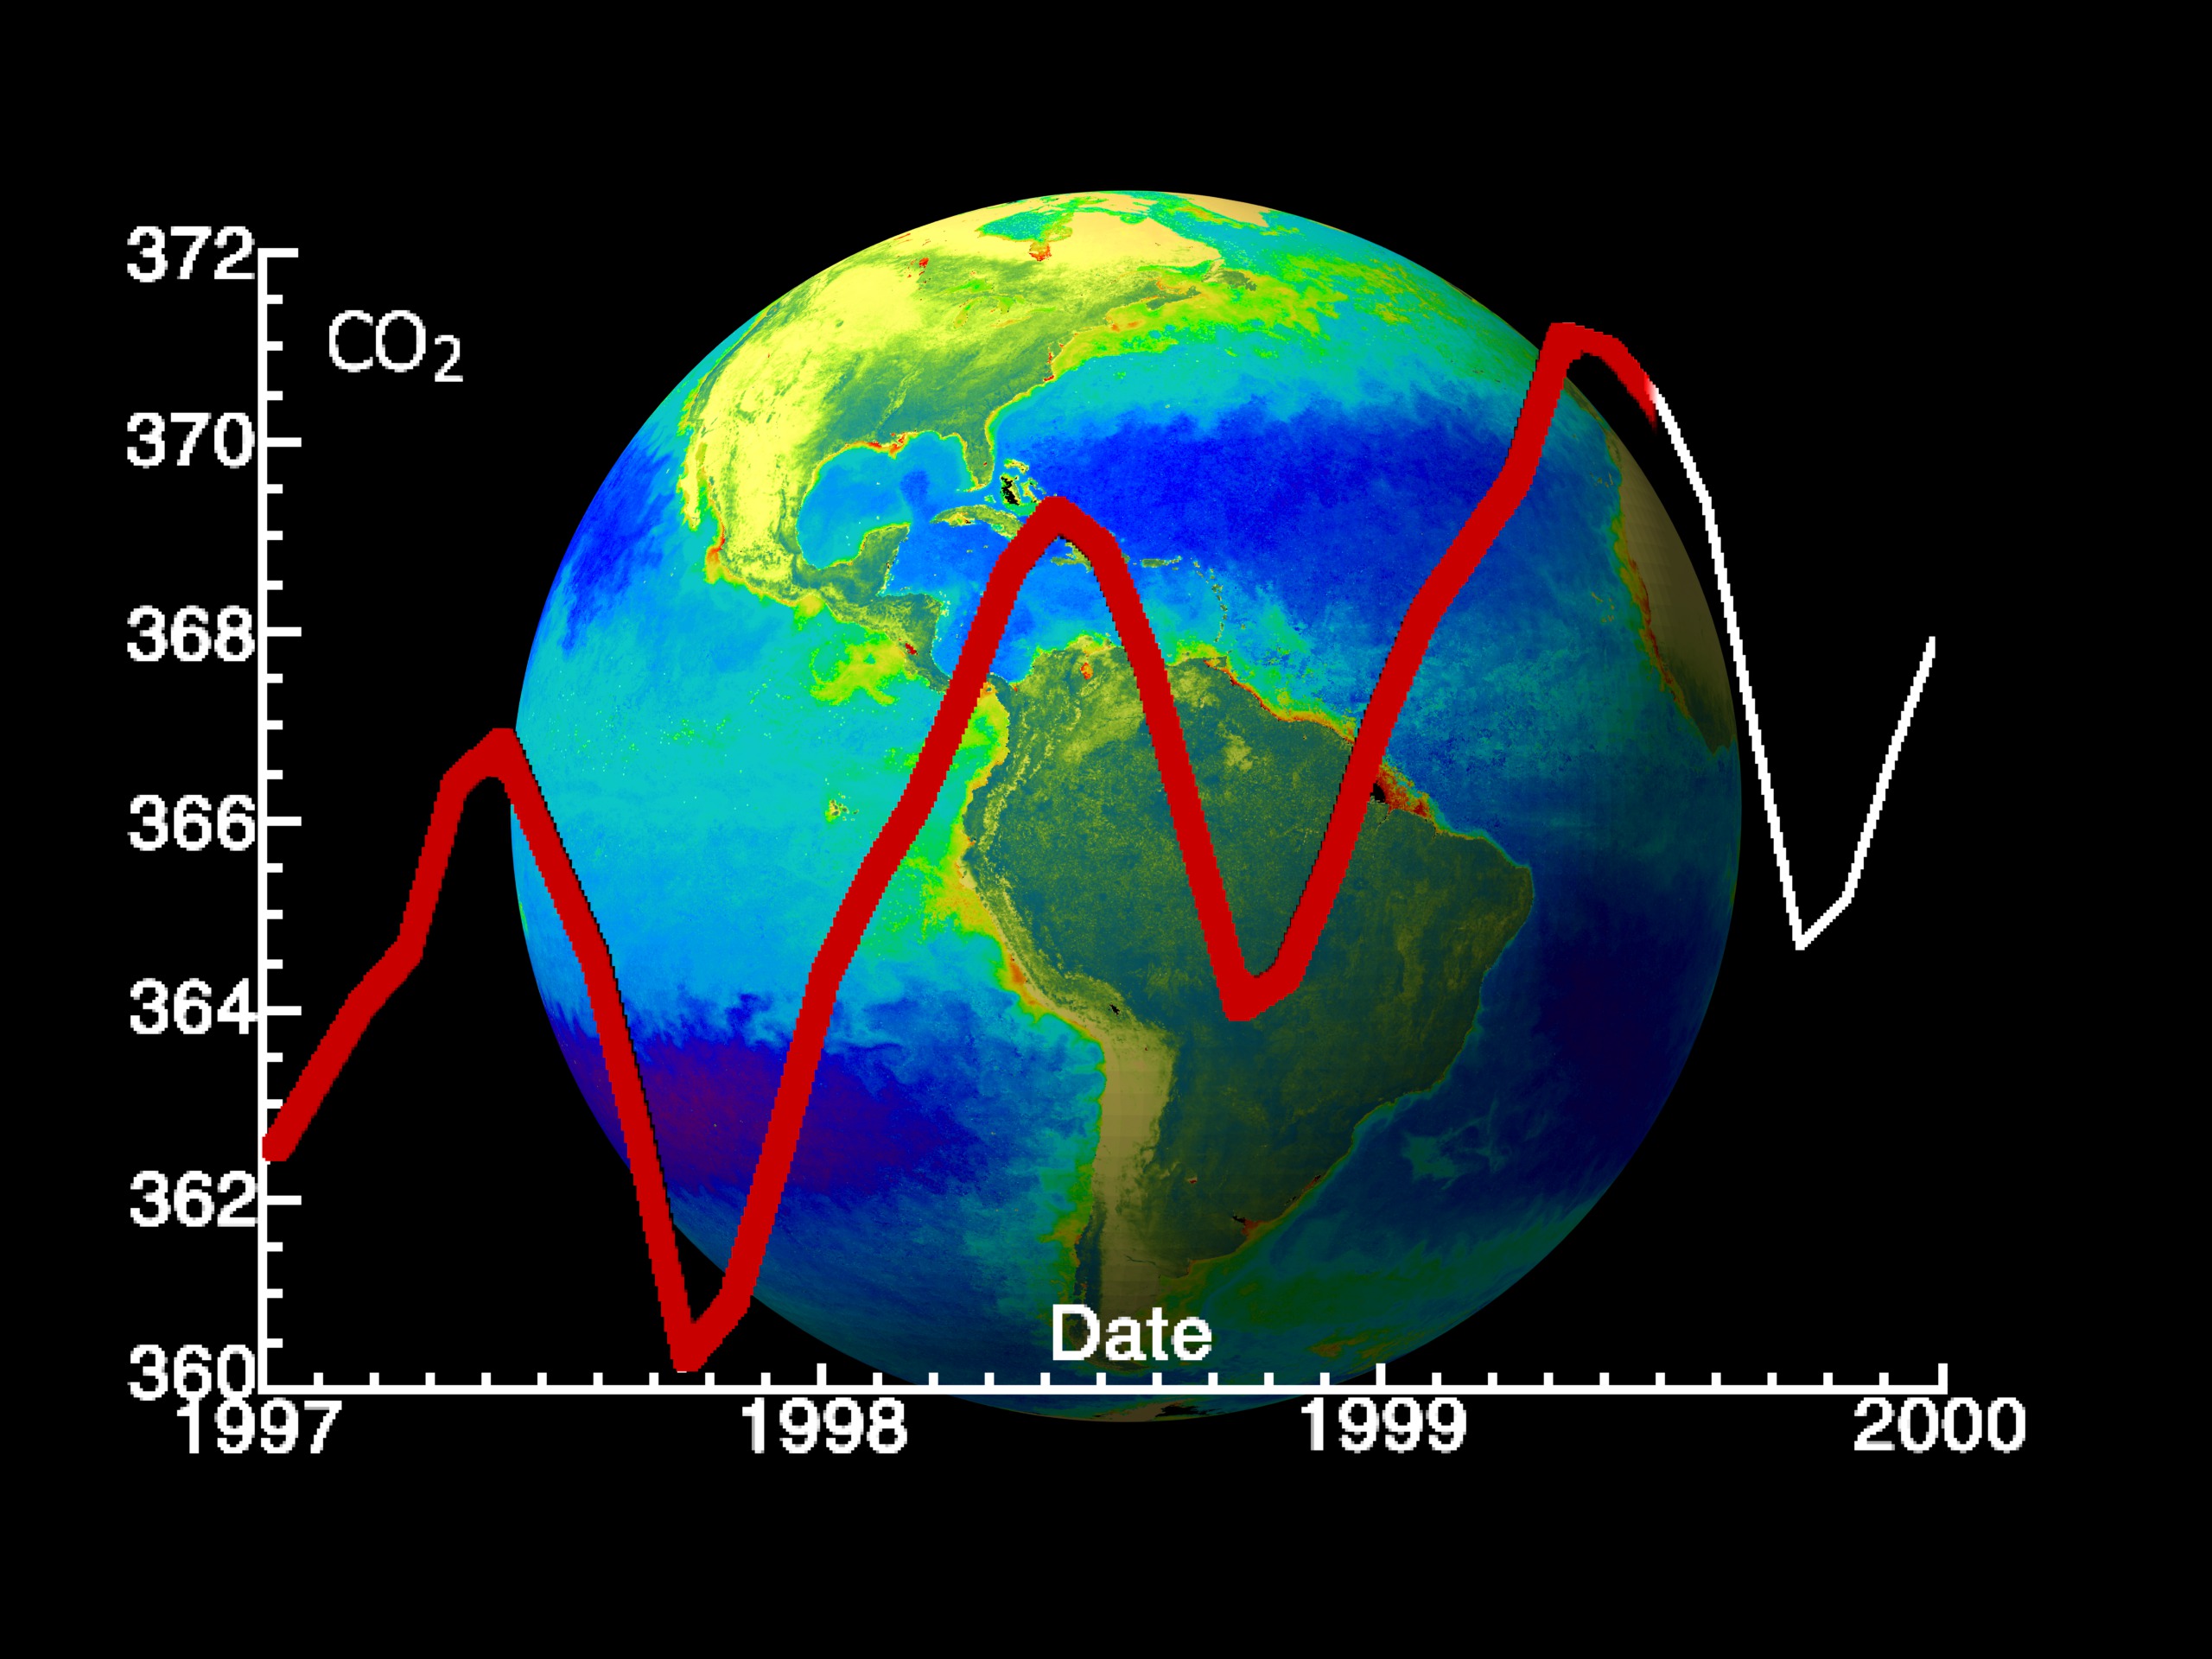


SeaWiFS: NASA Carbon Cycle Initiative
For More Information
Visualization Credits
Stuart A. Snodgrass (GST): Lead Animator
Marte Newcombe (GST): Animator
Gene Feldman (NASA/GSFC): Scientist
Marte Newcombe (GST): Animator
Gene Feldman (NASA/GSFC): Scientist
Please give credit for this item to:
NASA/Goddard Space Flight Center, The SeaWiFS Project and GeoEye, Scientific Visualization Studio. NOTE: All SeaWiFS images and data presented on this web site are for research and educational use only. All commercial use of SeaWiFS data must be coordinated with GeoEye (NOTE: In January 2013, DigitalGlobe and GeoEye combined to become DigitalGlobe).
NASA/Goddard Space Flight Center, The SeaWiFS Project and GeoEye, Scientific Visualization Studio. NOTE: All SeaWiFS images and data presented on this web site are for research and educational use only. All commercial use of SeaWiFS data must be coordinated with GeoEye (NOTE: In January 2013, DigitalGlobe and GeoEye combined to become DigitalGlobe).
Short URL to share this page:
https://svs.gsfc.nasa.gov/2195
Data Used:
Note: While we identify the data sets used in these visualizations, we do not store any further details nor the data sets themselves on our site.
This item is part of this series:
SeaWiFS Biosphere
Keywords:
SVS >> CO2
SVS >> Carbon Cycle
DLESE >> Environmental science
NASA Science >> Earth
https://svs.gsfc.nasa.gov/2195
Data Used:
SeaStar/SeaWiFS
1997/09/20 - 2000/09/20
NOTE: All SeaWiFS images and data presented on this web site are for research and educational use only. All commercial use of SeaWiFS data must be coordinated with GeoEye
Credit:
NASA/Goddard Space Flight Center, The SeaWiFS Project and GeoEye, Scientific Visualization Studio. NOTE: All SeaWiFS images and data presented on this web site are for research and educational use only. All commercial use of SeaWiFS data must be coordinated with GeoEye (NOTE: In January 2013, DigitalGlobe and GeoEye combined to become one DigitalGlobe.).
NASA/Goddard Space Flight Center, The SeaWiFS Project and GeoEye, Scientific Visualization Studio. NOTE: All SeaWiFS images and data presented on this web site are for research and educational use only. All commercial use of SeaWiFS data must be coordinated with GeoEye (NOTE: In January 2013, DigitalGlobe and GeoEye combined to become one DigitalGlobe.).
This item is part of this series:
SeaWiFS Biosphere
Keywords:
SVS >> CO2
SVS >> Carbon Cycle
DLESE >> Environmental science
NASA Science >> Earth


