Earth
ID: 2032
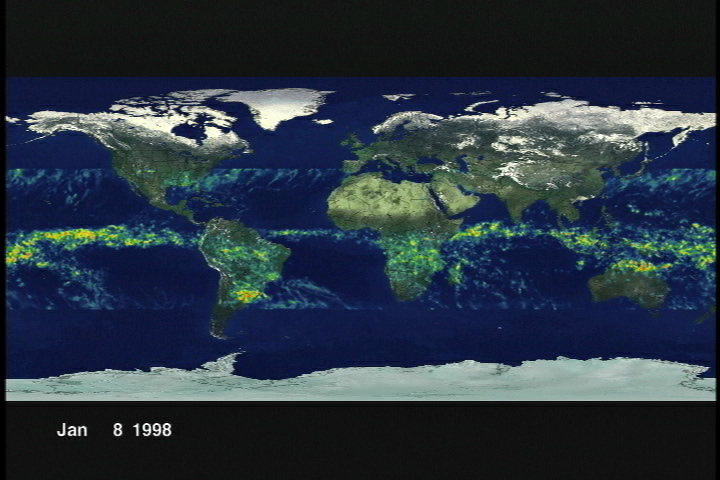
Daily global rainfall measurements from 1/8/98 to 10/21/00 as measured by TRMM. Red indicates areas of high rainfall. Blue indicates areas of low rainfall. Map is in a Plate Carrée projection.
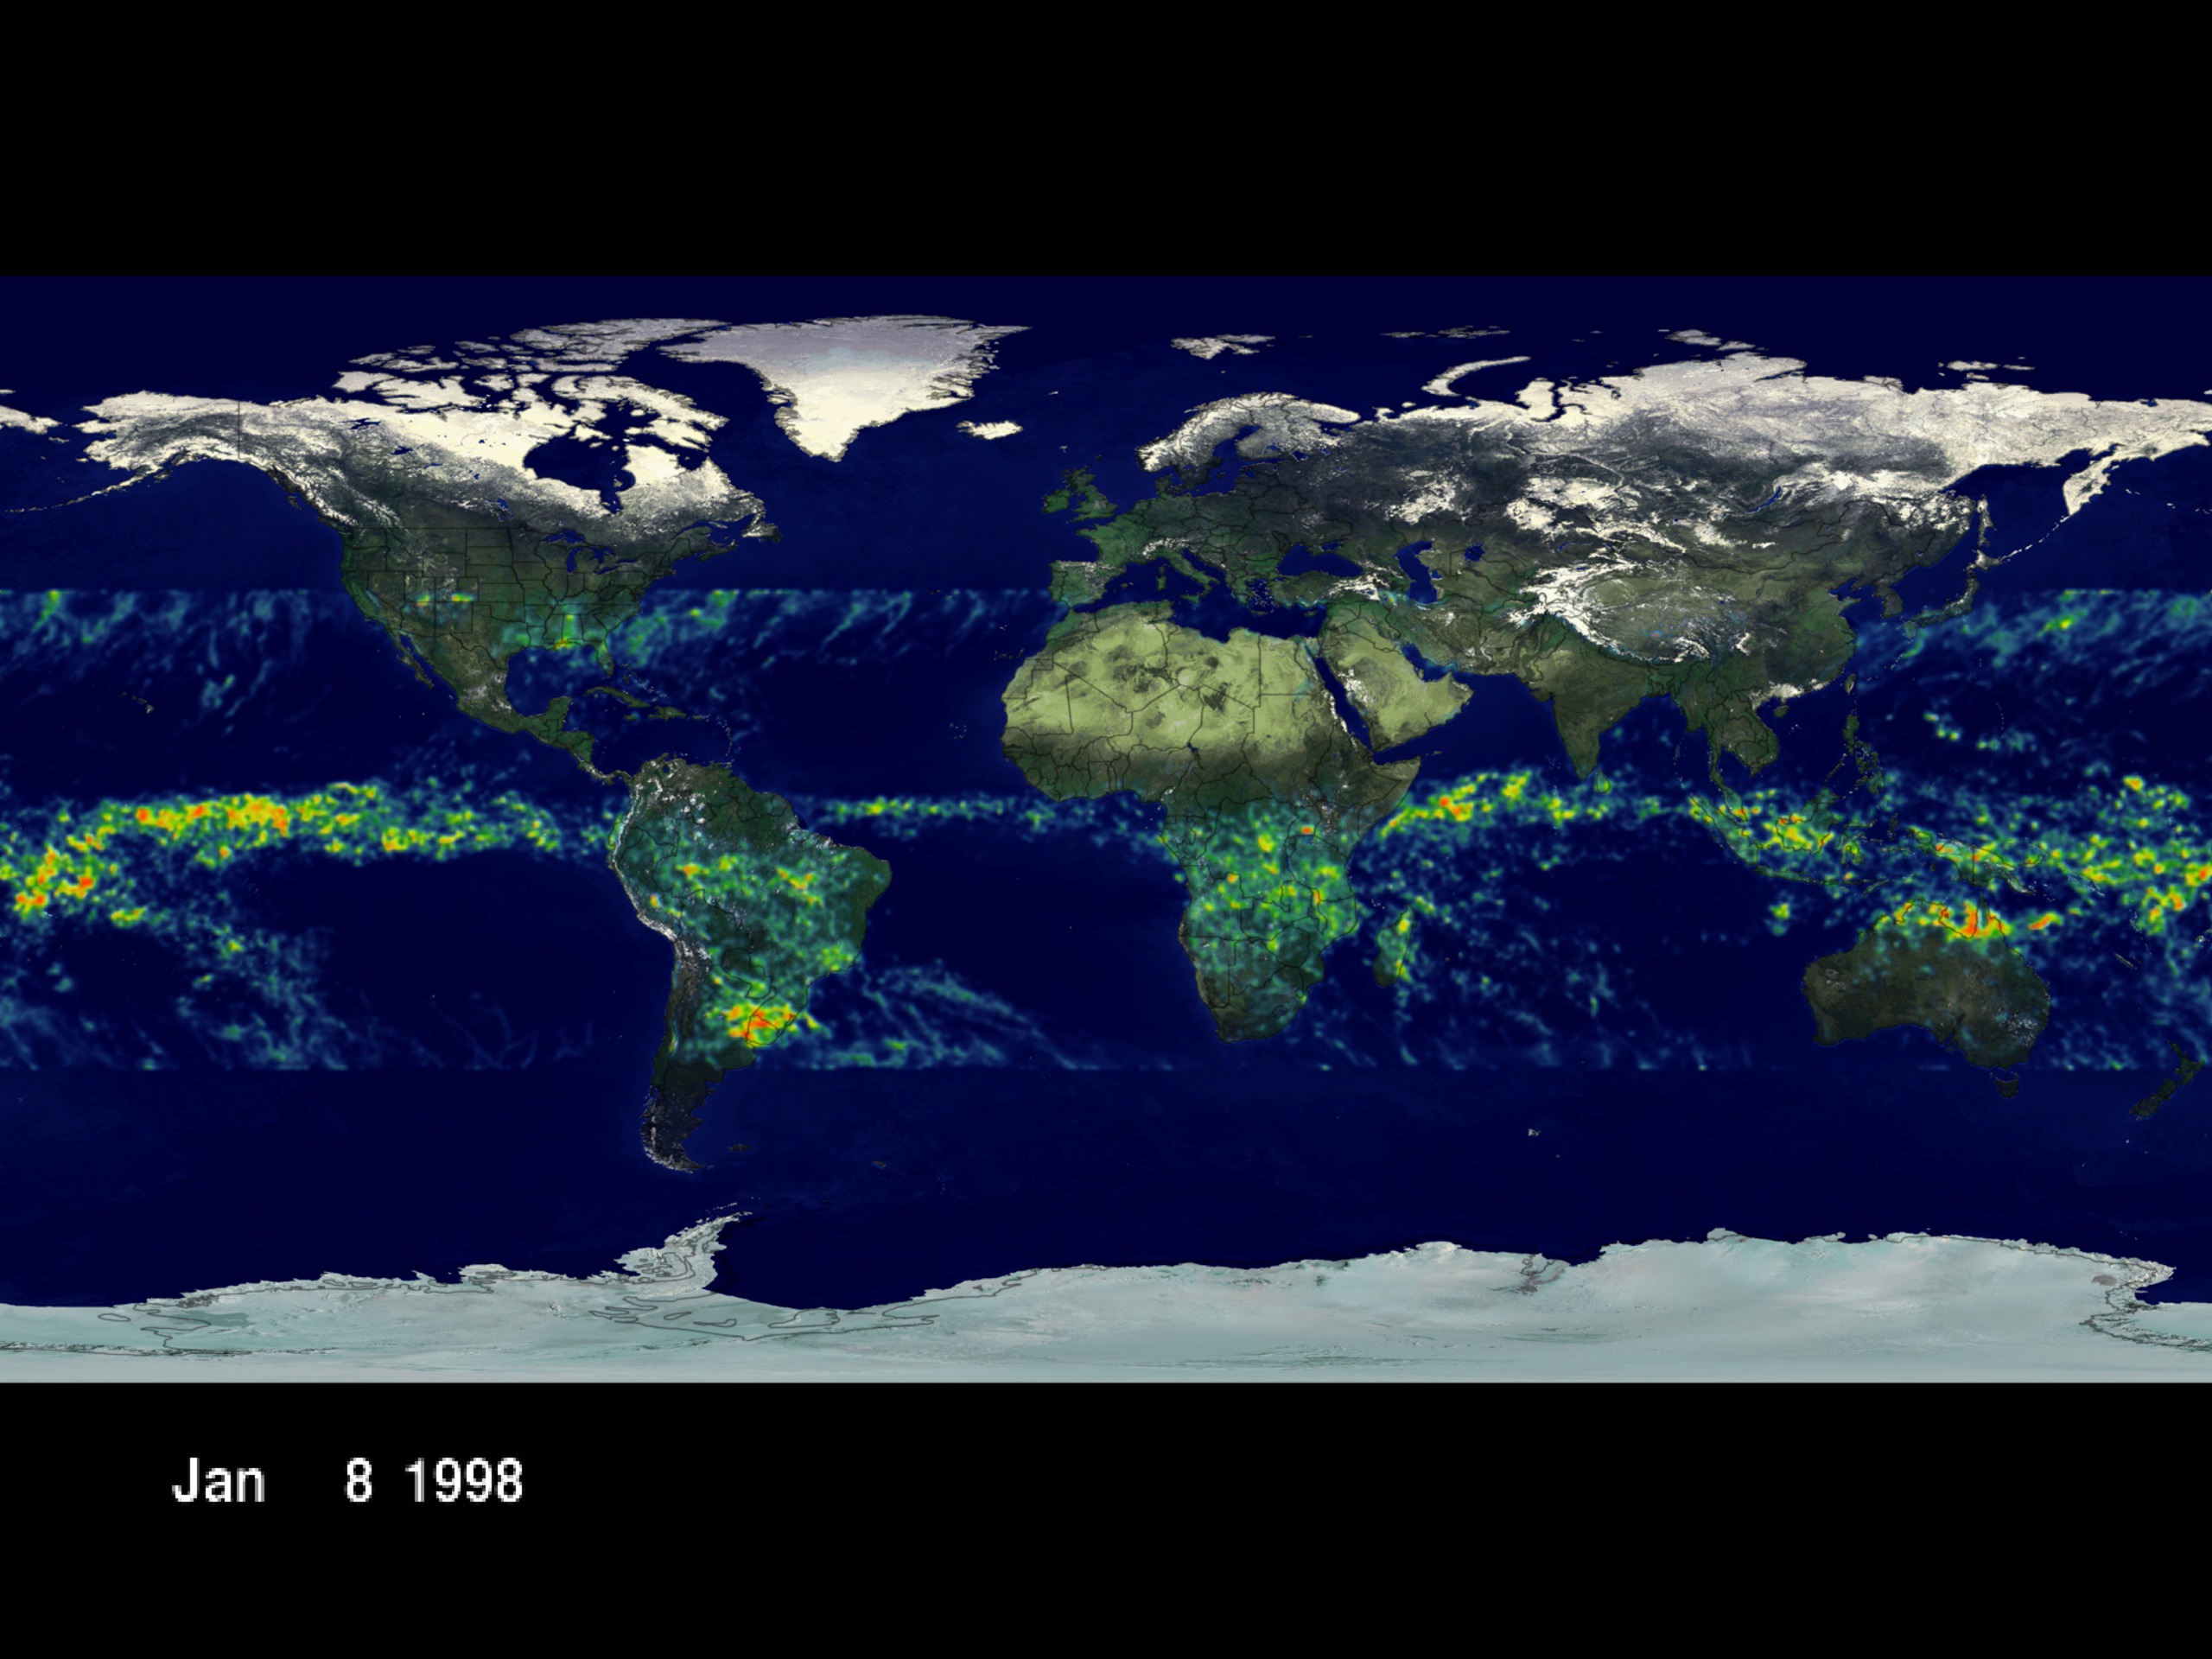
TRMM: Global Daily Rainmaps from January 8, 1998 through October 21, 2000
Visualization Credits
Alex Kekesi (Global Science and Technology, Inc.): Lead Animator
Stuart A. Snodgrass (GST): Animator
Greg Shirah (NASA/GSFC): Animator
Robert Adler (NASA/GSFC): Scientist
Stuart A. Snodgrass (GST): Animator
Greg Shirah (NASA/GSFC): Animator
Robert Adler (NASA/GSFC): Scientist
Please give credit for this item to:
NASA/Goddard Space Flight Center Scientific Visualization Studio
NASA/Goddard Space Flight Center Scientific Visualization Studio
Short URL to share this page:
https://svs.gsfc.nasa.gov/2032
Mission:
Tropical Rainfall Measuring Mission - TRMM
Data Used:
Note: While we identify the data sets used in these visualizations, we do not store any further details nor the data sets themselves on our site.
Dates of Data Used:
1998/01/08-2000/10/21
This item is part of this series:
TRMM Rainmaps
Keywords:
NASA Science >> Earth
GCMD >> Earth Science >> Atmosphere >> Precipitation >> Rain
GCMD keywords can be found on the Internet with the following citation: Olsen, L.M., G. Major, K. Shein, J. Scialdone, S. Ritz, T. Stevens, M. Morahan, A. Aleman, R. Vogel, S. Leicester, H. Weir, M. Meaux, S. Grebas, C.Solomon, M. Holland, T. Northcutt, R. A. Restrepo, R. Bilodeau, 2013. NASA/Global Change Master Directory (GCMD) Earth Science Keywords. Version 8.0.0.0.0
https://svs.gsfc.nasa.gov/2032
Mission:
Tropical Rainfall Measuring Mission - TRMM
Data Used:
TRMM/TMI/Daily Rainfall
1998/01/08-2000/10/21Dates of Data Used:
1998/01/08-2000/10/21
This item is part of this series:
TRMM Rainmaps
Keywords:
NASA Science >> Earth
GCMD >> Earth Science >> Atmosphere >> Precipitation >> Rain
GCMD keywords can be found on the Internet with the following citation: Olsen, L.M., G. Major, K. Shein, J. Scialdone, S. Ritz, T. Stevens, M. Morahan, A. Aleman, R. Vogel, S. Leicester, H. Weir, M. Meaux, S. Grebas, C.Solomon, M. Holland, T. Northcutt, R. A. Restrepo, R. Bilodeau, 2013. NASA/Global Change Master Directory (GCMD) Earth Science Keywords. Version 8.0.0.0.0


