Earth
ID: 2023
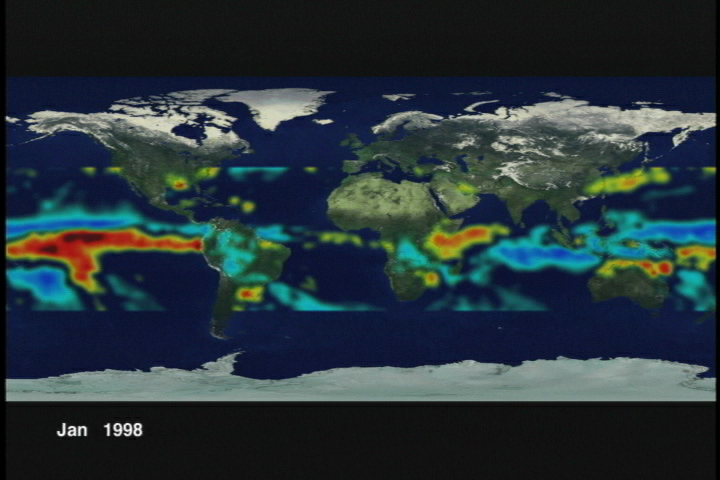
Rainmaps derived from nearly three years of TRMM operations.
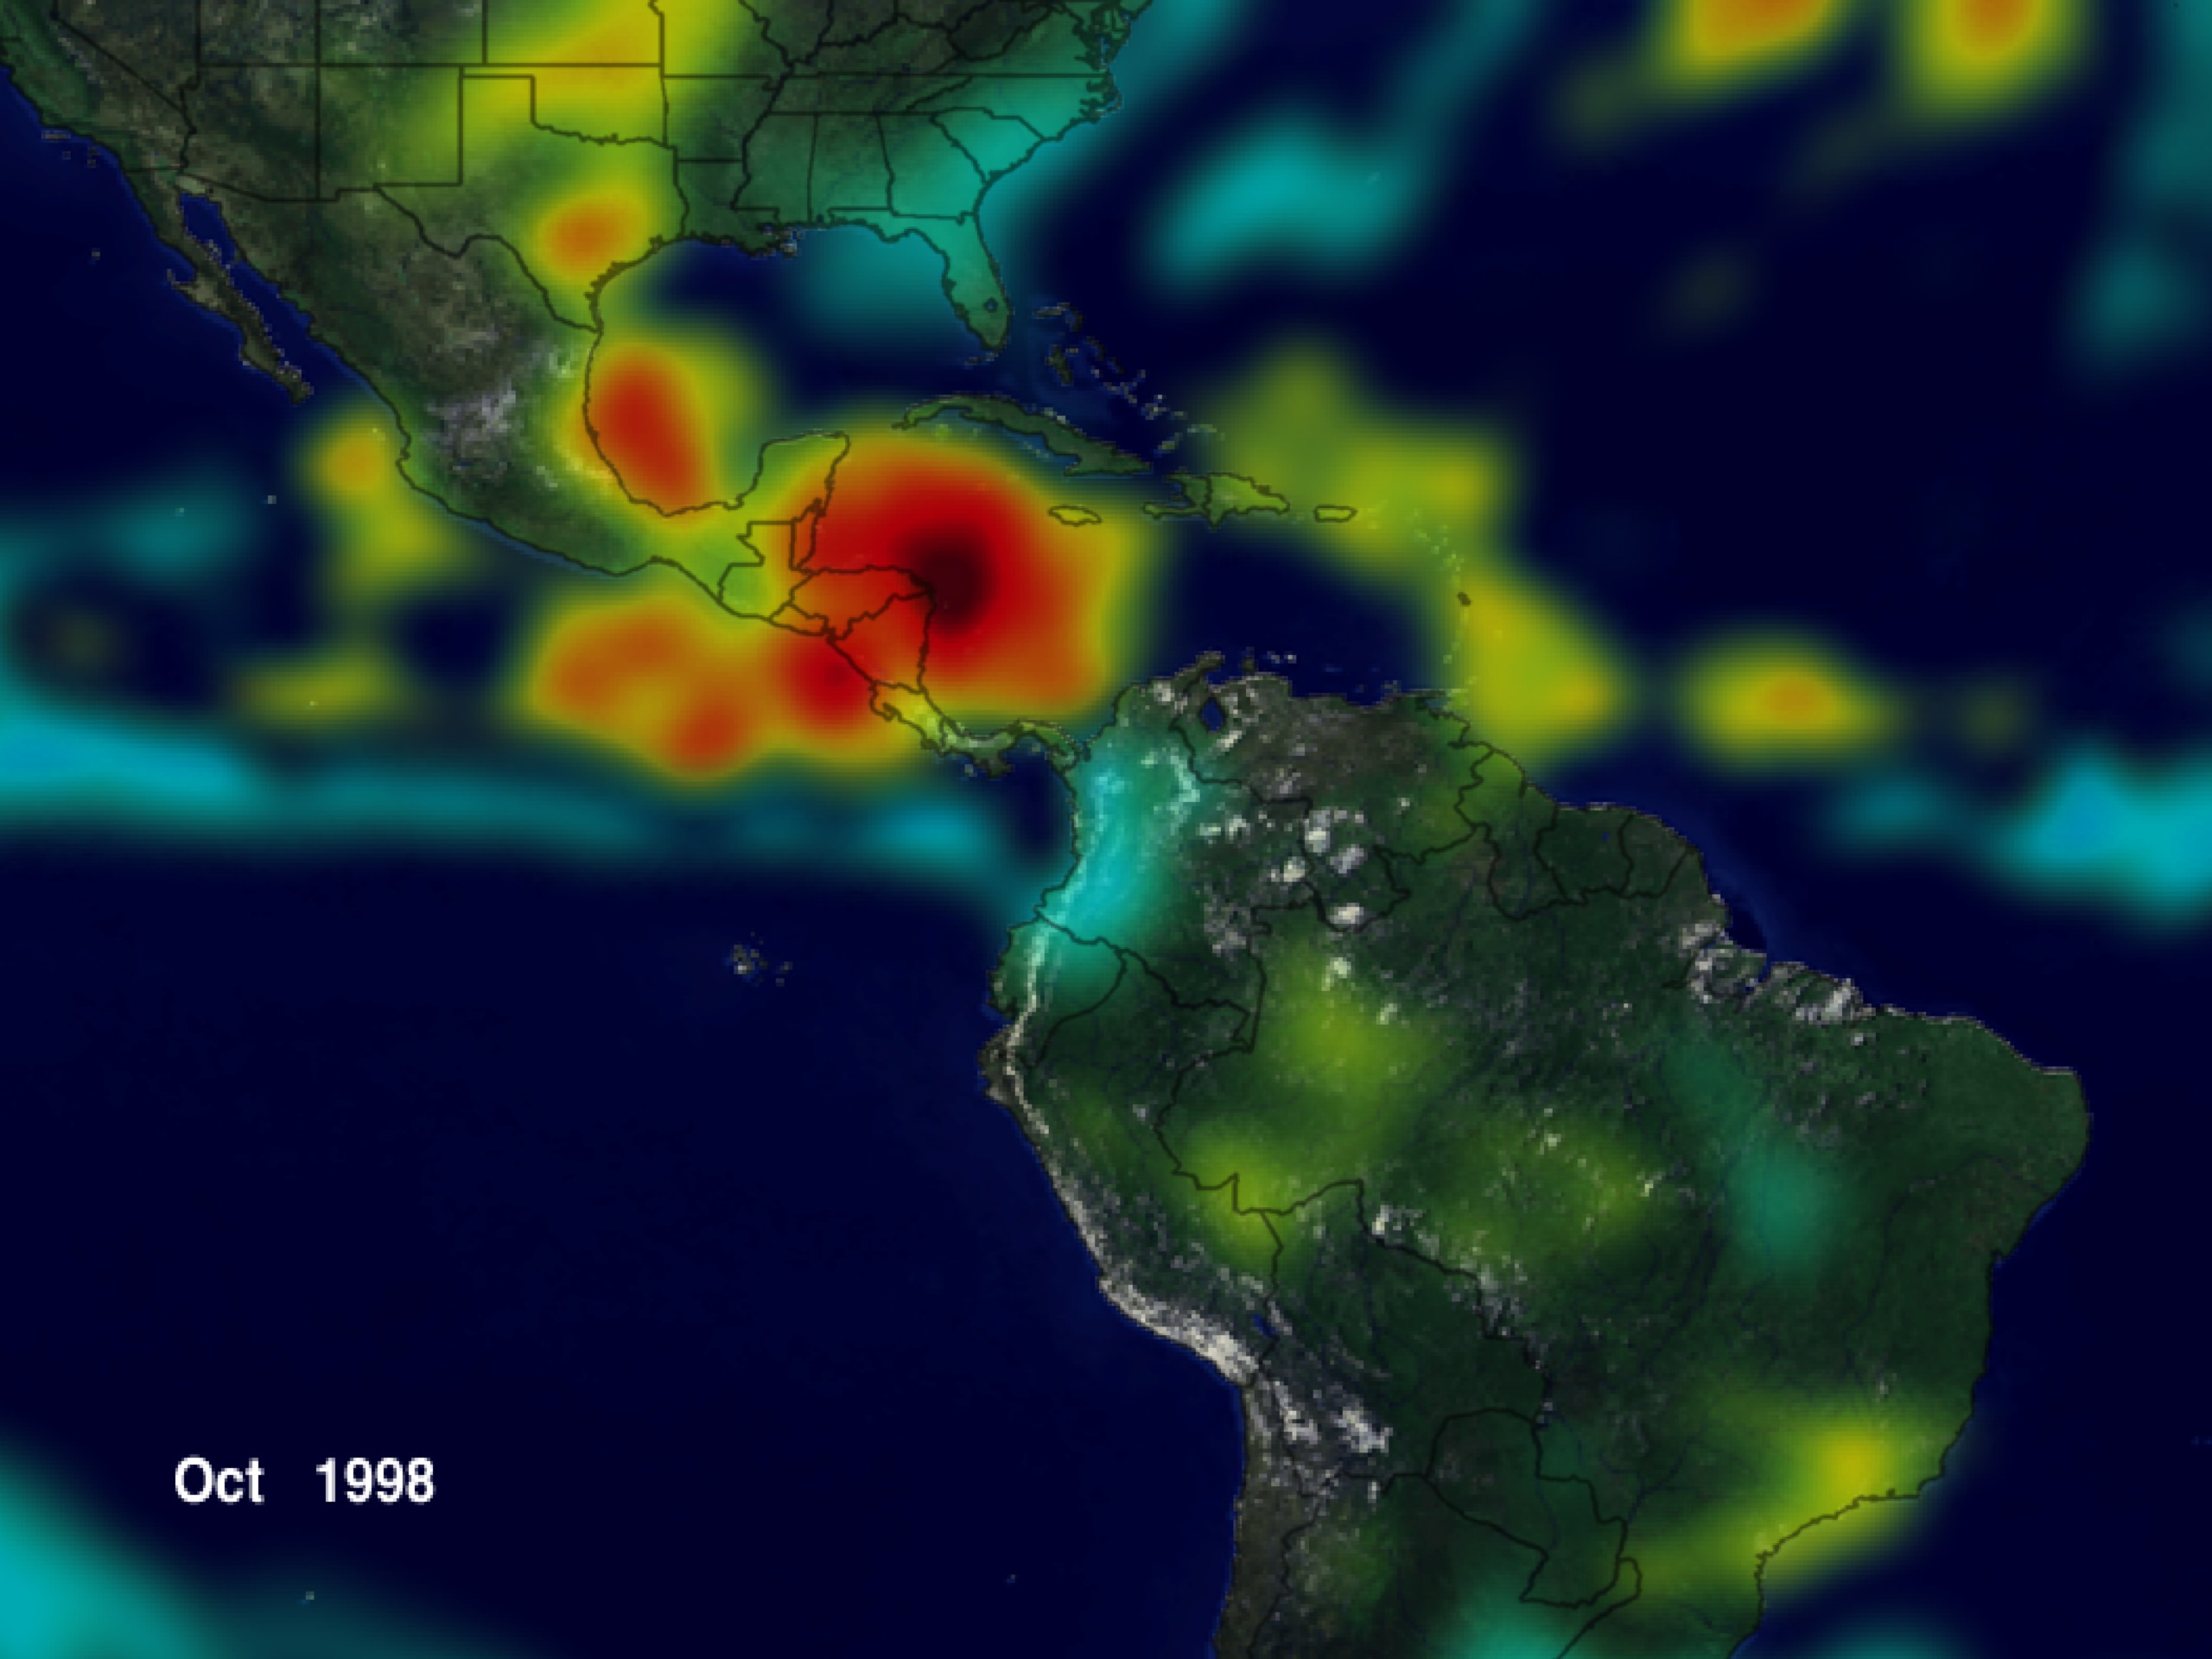
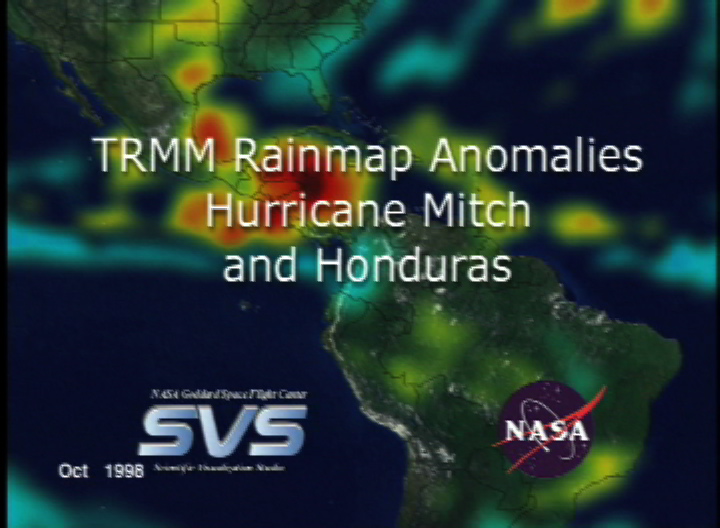
TRMM Rainmap Anomalies: Hurricane Mitch and Honduras
Visualization Credits
Tom Bridgman (Global Science and Technology, Inc.): Lead Animator
Robert Adler (NASA/GSFC): Scientist
Robert Adler (NASA/GSFC): Scientist
Please give credit for this item to:
NASA/Goddard Space Flight Center Scientific Visualization Studio
NASA/Goddard Space Flight Center Scientific Visualization Studio
Short URL to share this page:
https://svs.gsfc.nasa.gov/2023
Mission:
Tropical Rainfall Measuring Mission - TRMM
Data Used:
Note: While we identify the data sets used in these visualizations, we do not store any further details nor the data sets themselves on our site.
This item is part of this series:
TRMM Rainmaps
Keywords:
DLESE >> Atmospheric science
DLESE >> Hydrology
SVS >> Rainfall
NASA Science >> Earth
https://svs.gsfc.nasa.gov/2023
Mission:
Tropical Rainfall Measuring Mission - TRMM
Data Used:
TRMM/PR and TMI/Monthly Average Precipitation Anomaly
1998/01/01-1998/10/31This item is part of this series:
TRMM Rainmaps
Keywords:
DLESE >> Atmospheric science
DLESE >> Hydrology
SVS >> Rainfall
NASA Science >> Earth


