Earth
ID: 155
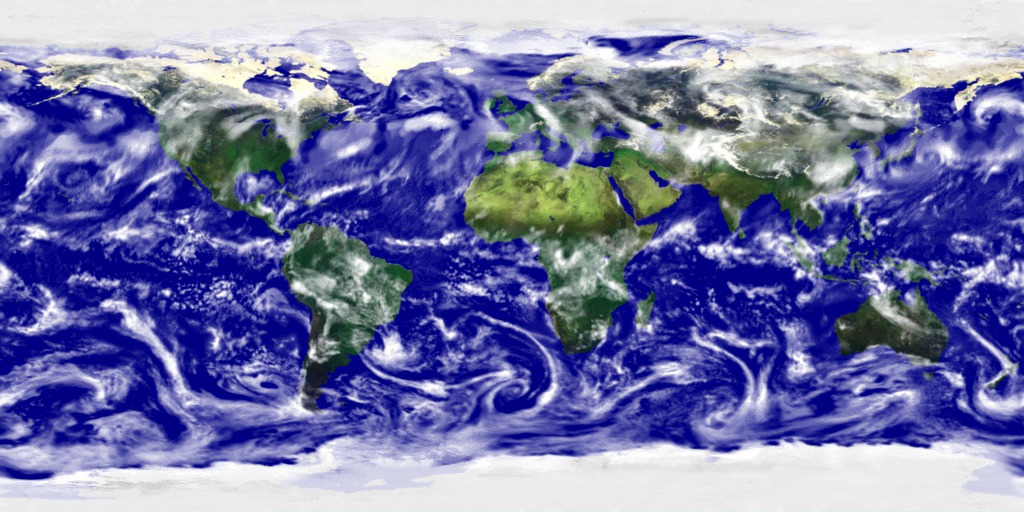
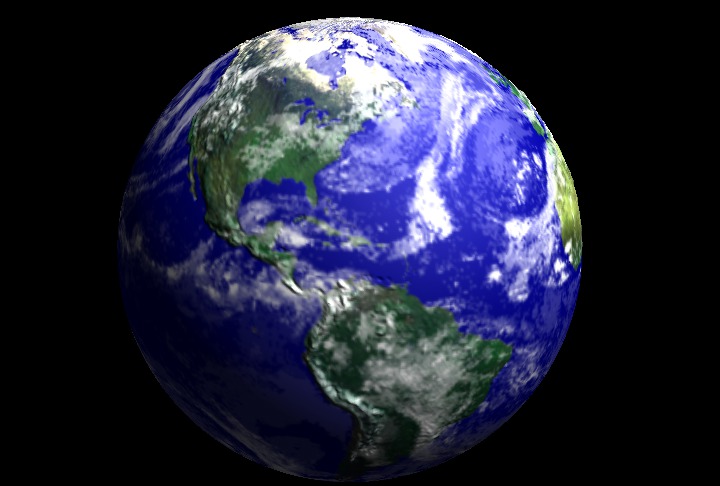
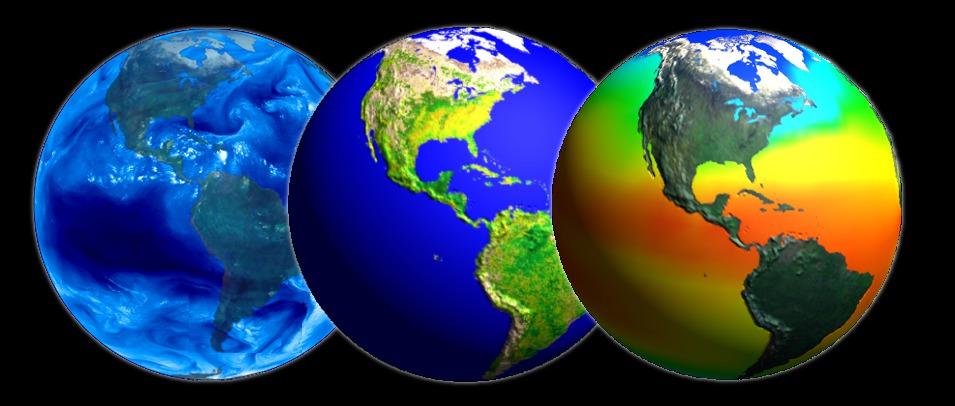
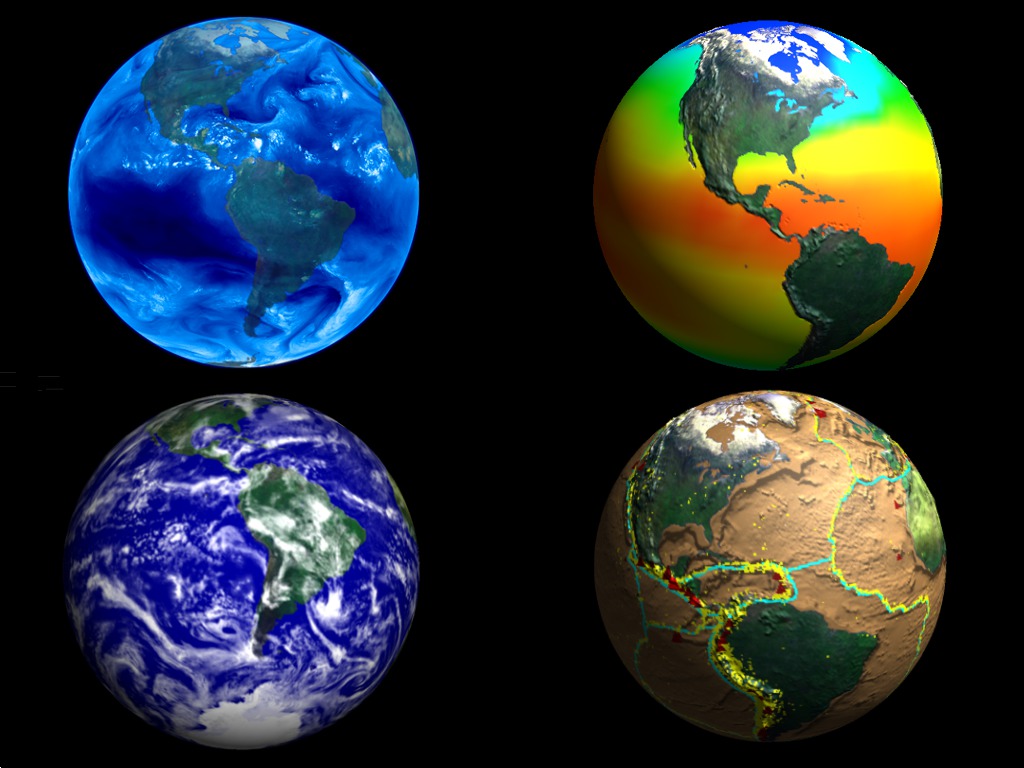
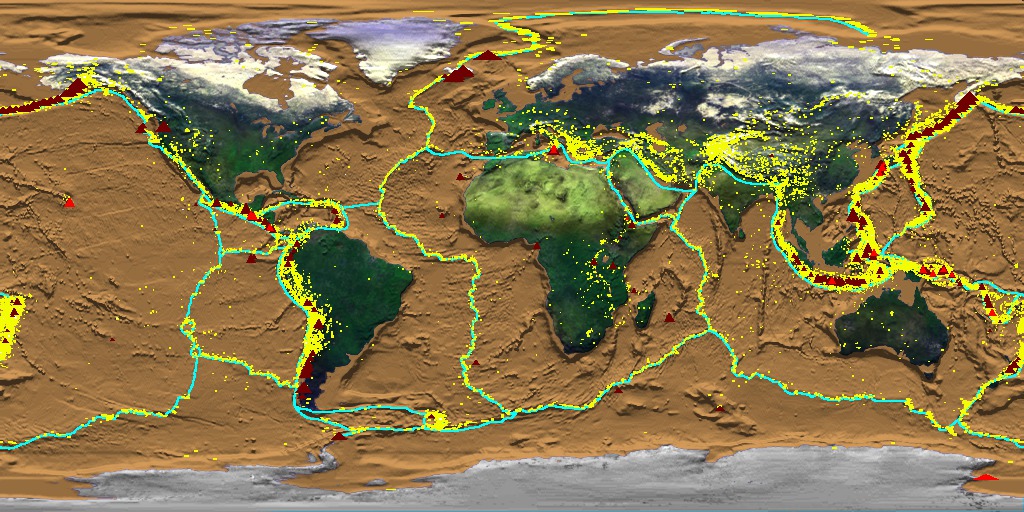
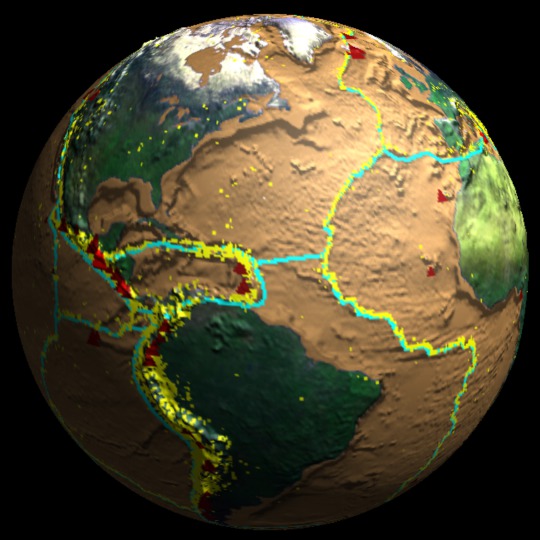
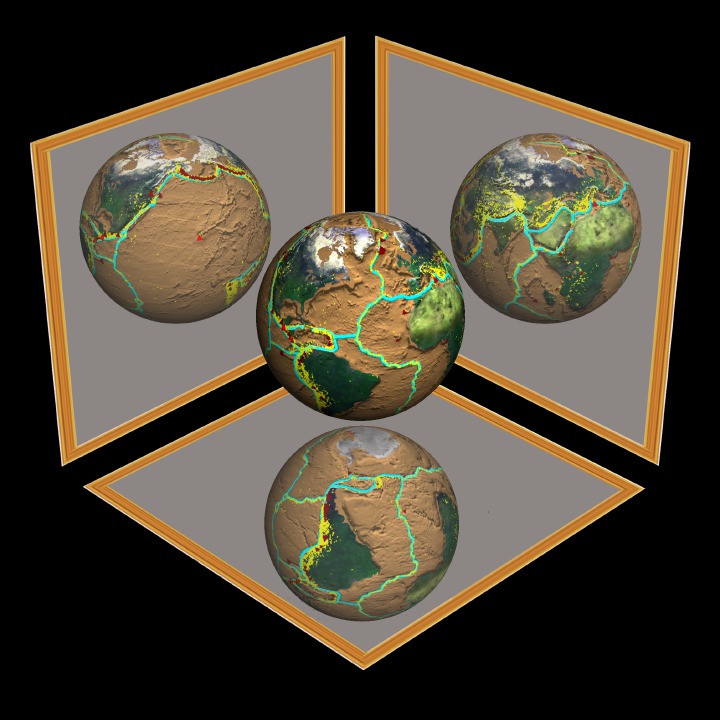
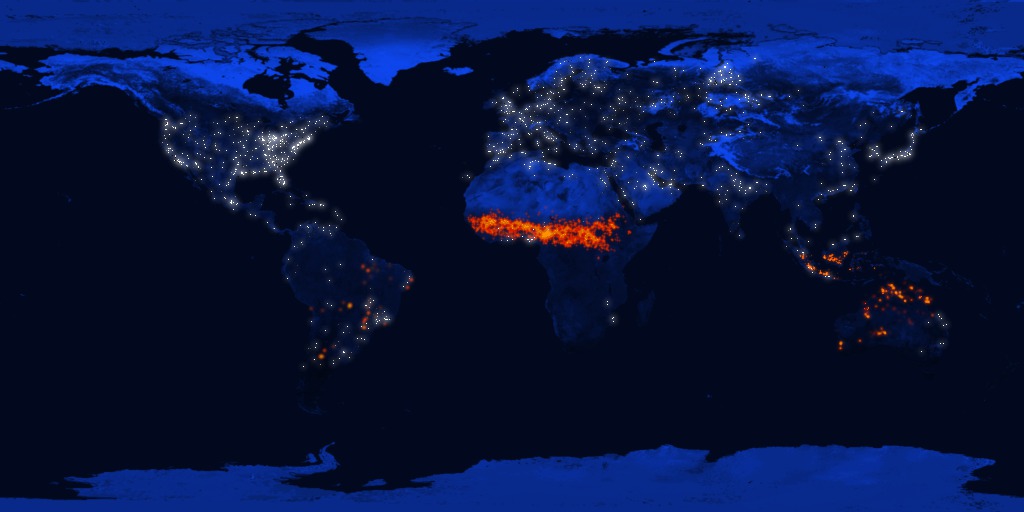
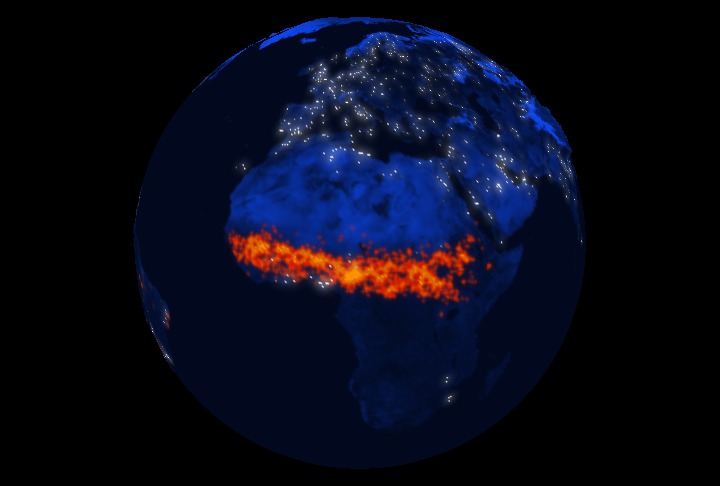
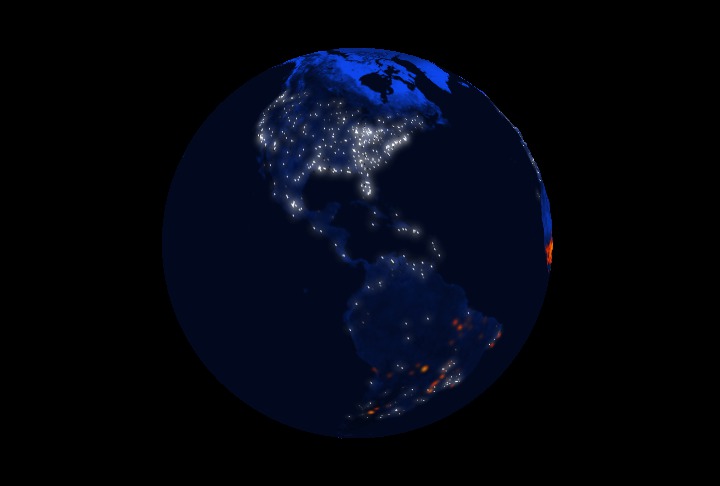
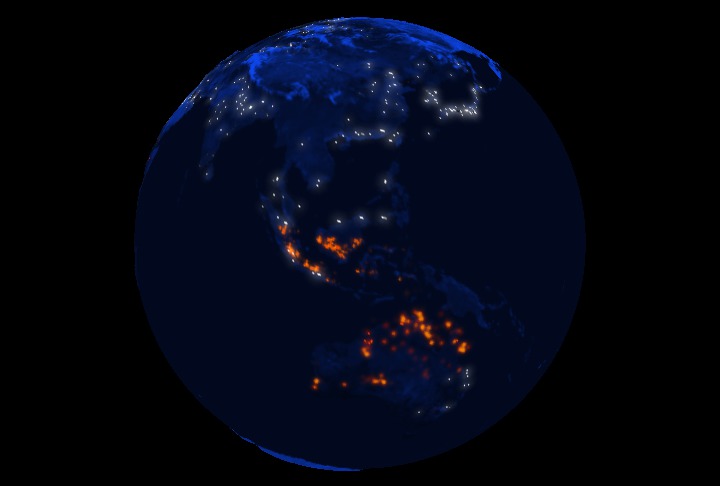
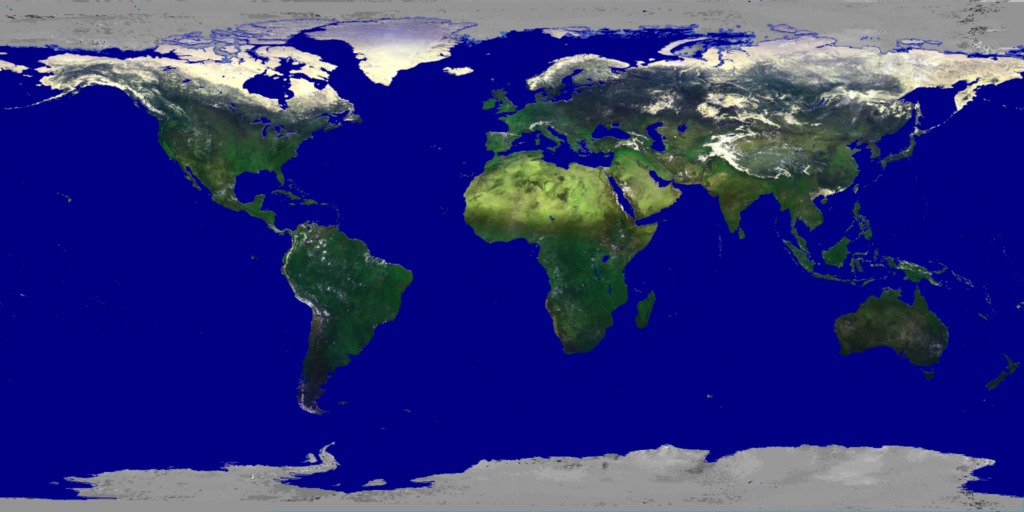
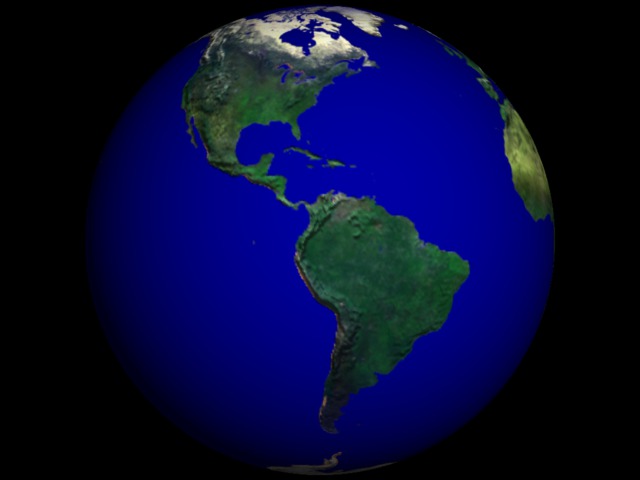
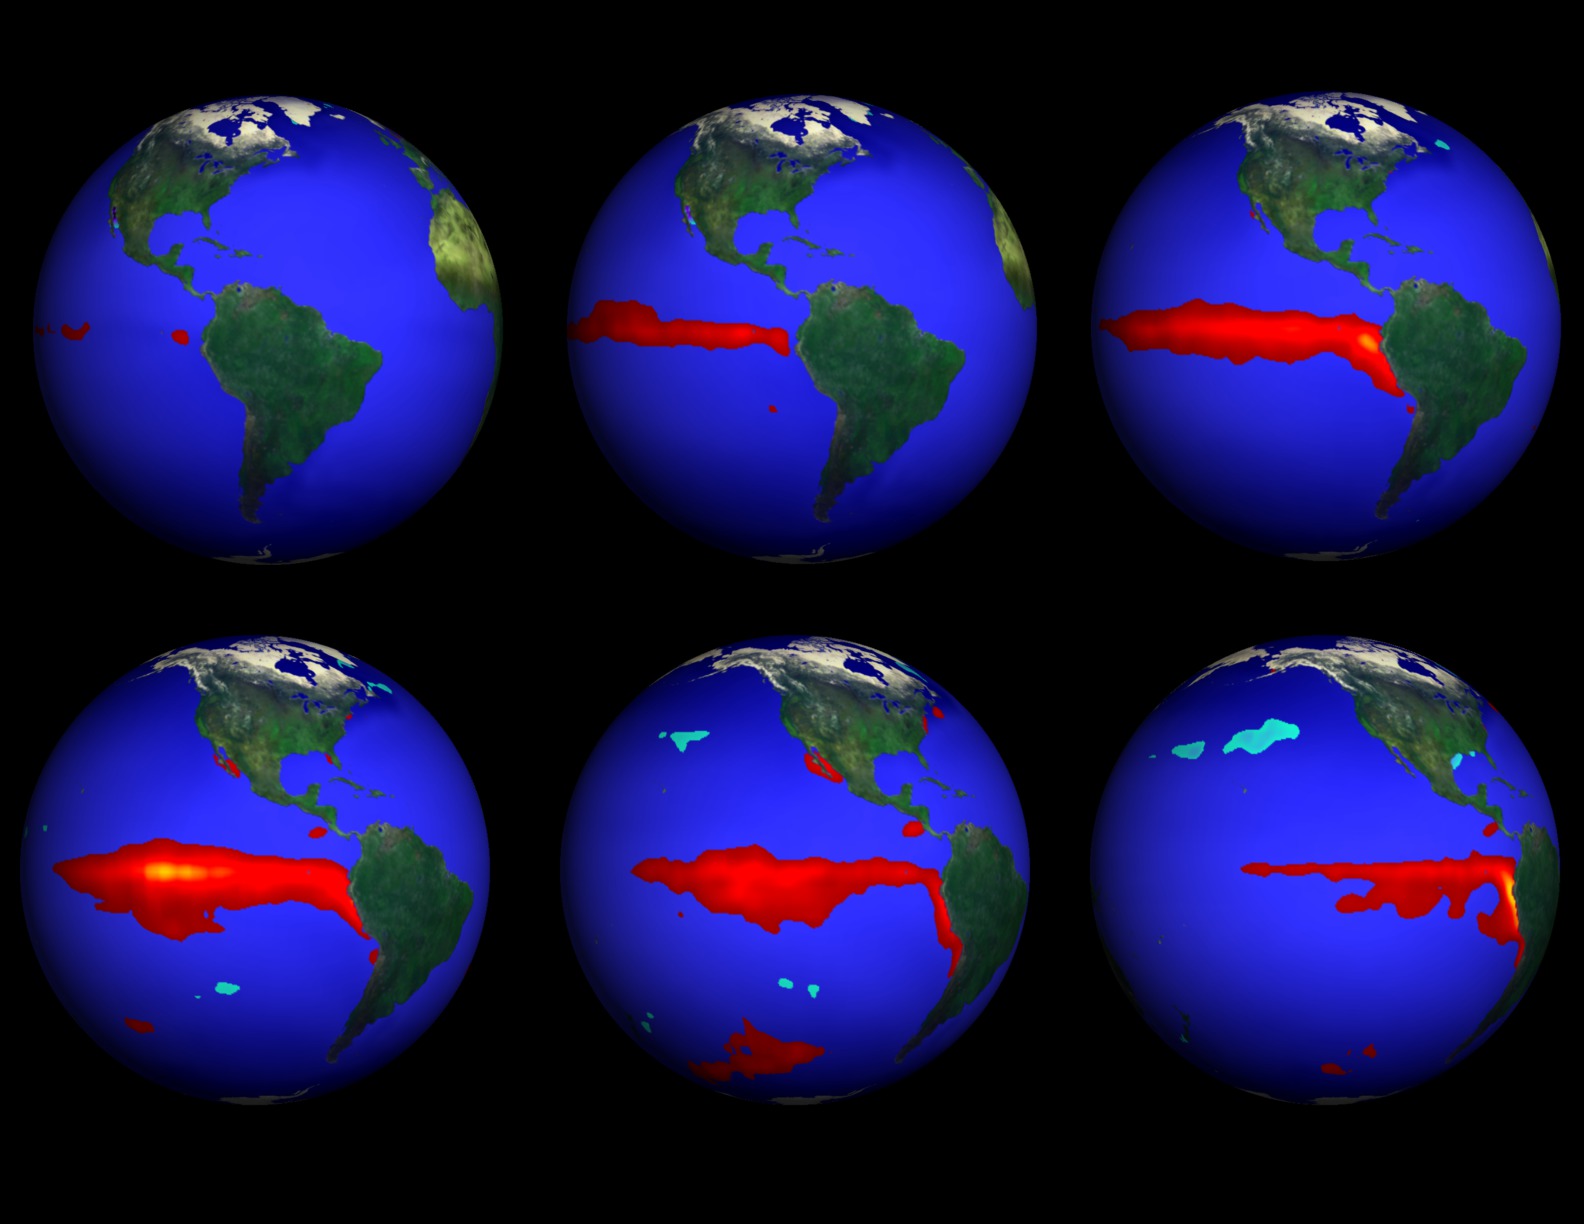
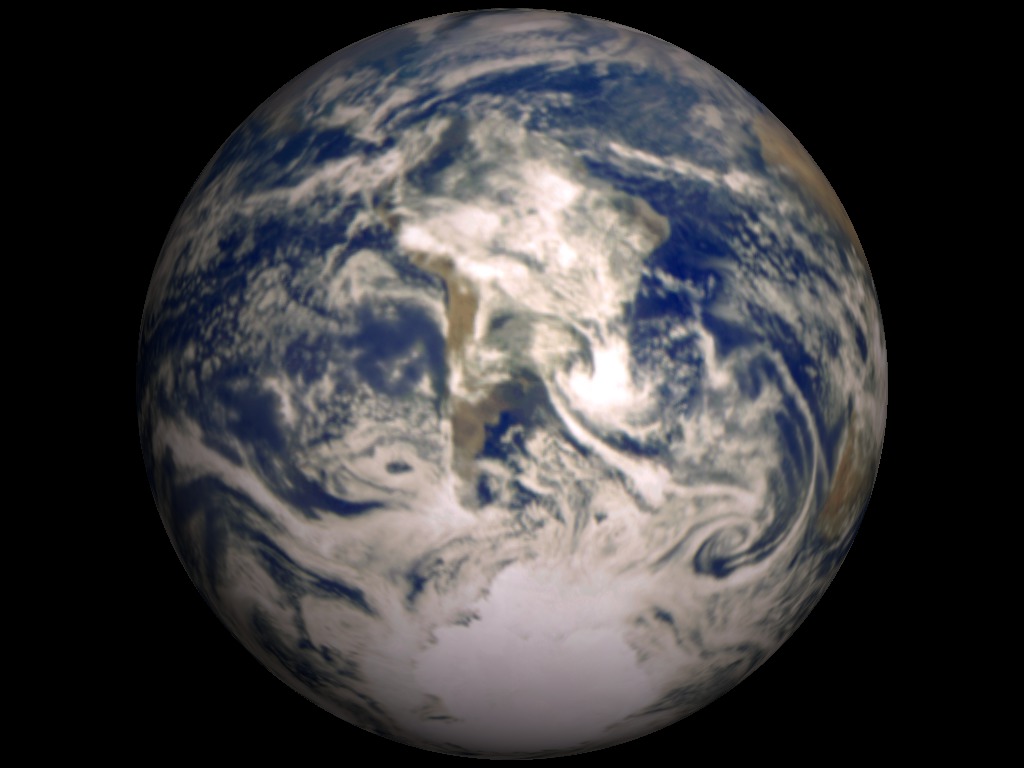
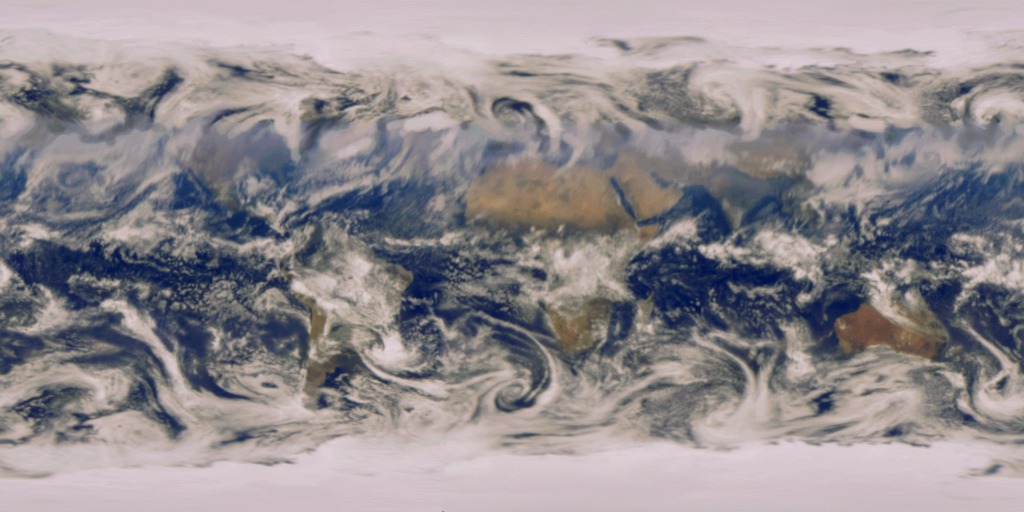
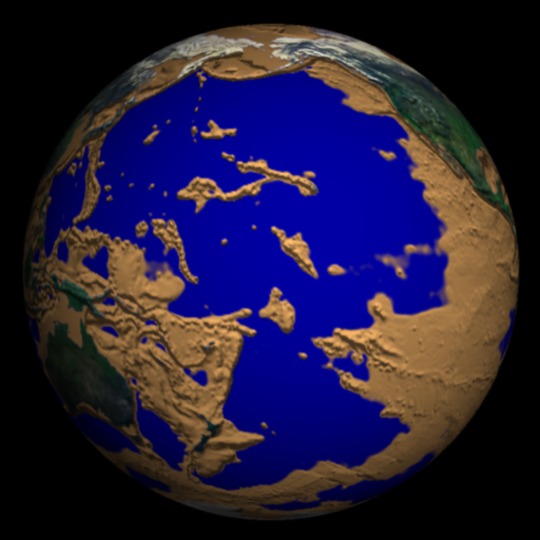
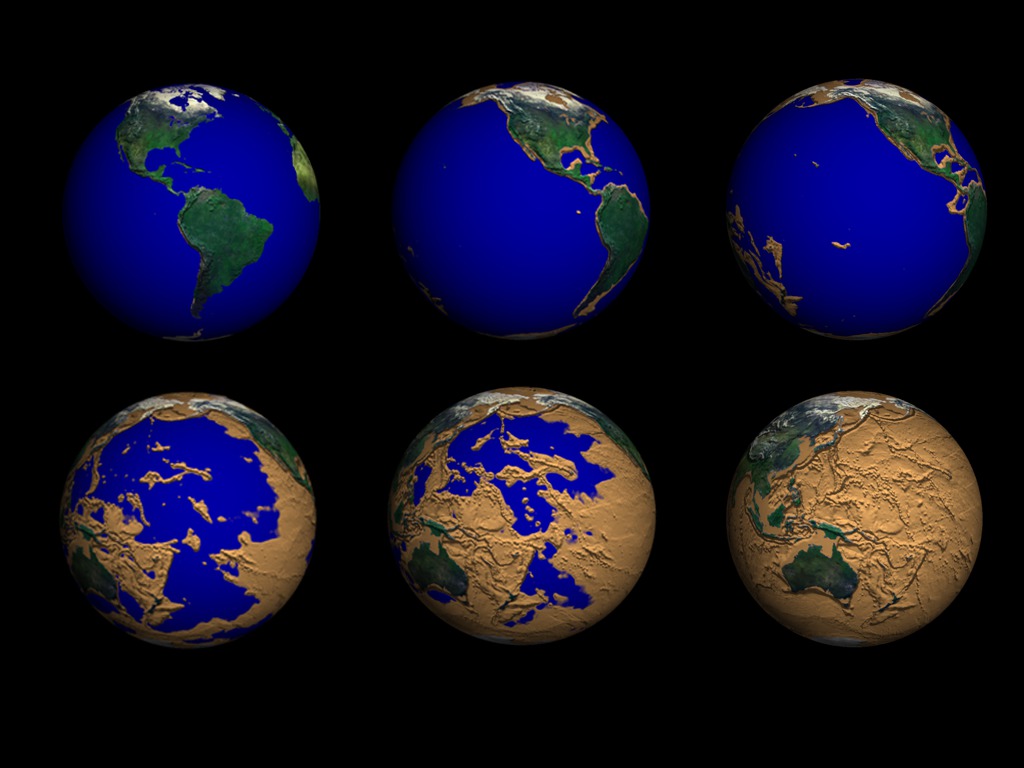
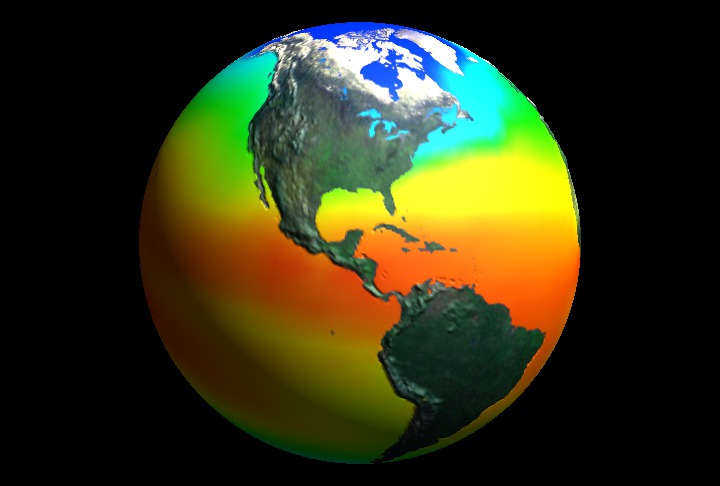
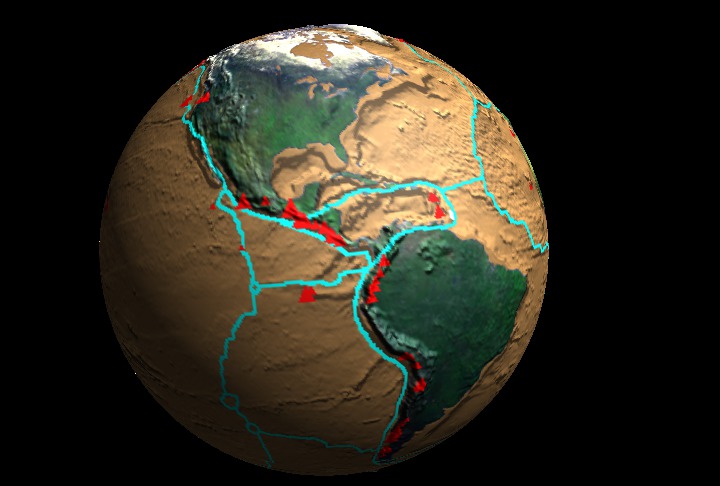
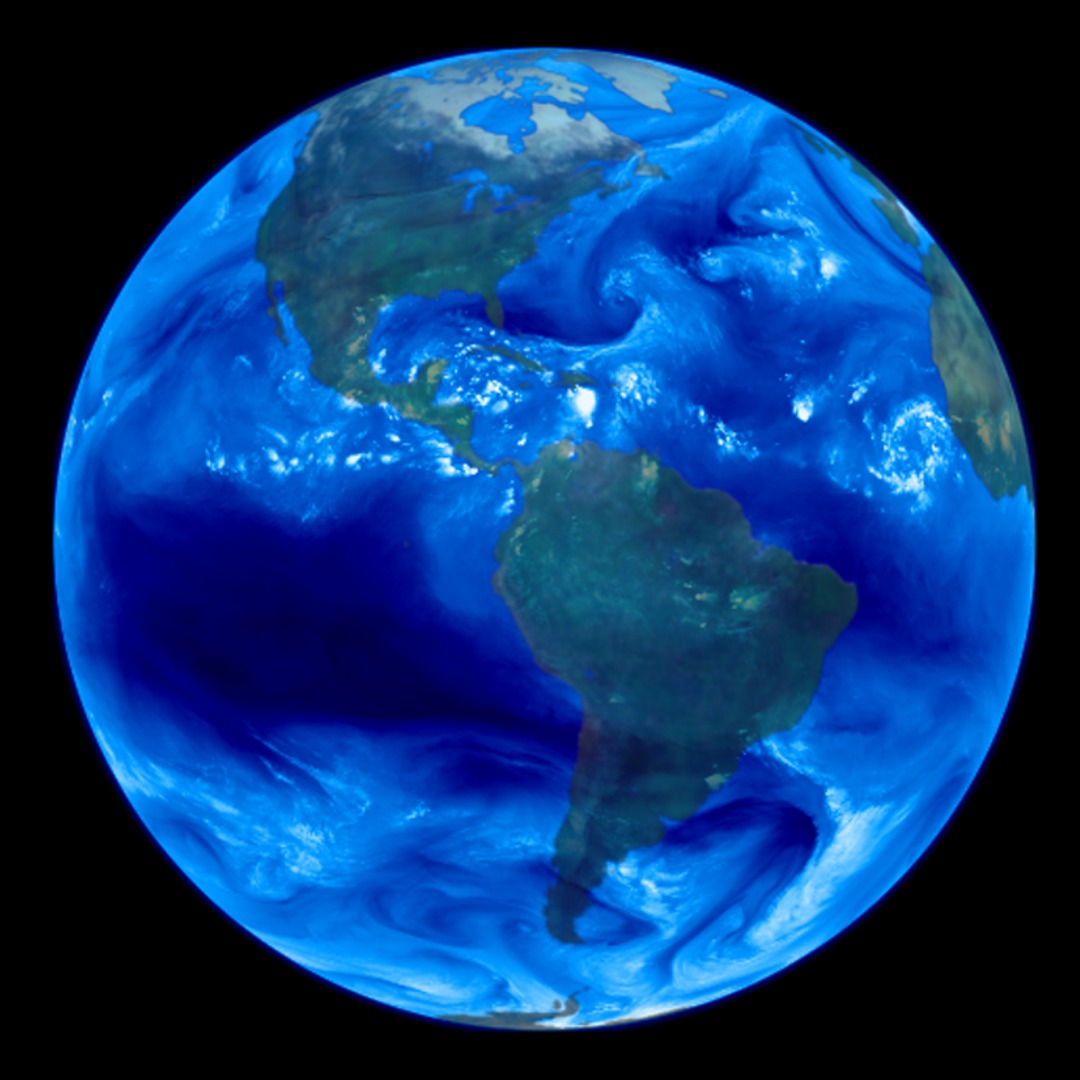
These animations were produced for the Smithsonian Institution's HoloGlobe Exhibit which opened to the public on August 10, 1996 at the Museum of Natural History in Washington, DC. The various data sets show progressive global change mapped onto a rotating globe and projected into space to create a holographic image of the Earth. The exhibit shows that Earth's atmosphere, hydrosphere, geosphere, and biosphere are dynamic, changing on timescales of days, minutes, or even seconds. The exhibit has since been relocated to the west coast. This is a revised version from Animation #116 [The HoloGlobe Project (version 2)].
The HoloGlobe Project (Version 3)
Alternate Versions

Visualization Credits
Horace Mitchell (NASA/GSFC): Lead Animator
Andy Acuna (Hughes STX): Animator
John Cavallo (Hughes STX): Animator
Liam Krauss (Hughes STX): Animator
Jim Strong (NASA/GSFC): Animator
Barbara Summey (Raytheon): Animator
Brian Tighe (NASA): Animator
Marit Jentoft-Nilsen (RSIS): Animator
Kannappan Palaniappan (NASA/GSFC): Animator
Alex Kekesi (Global Science and Technology, Inc.): Animator
James Earl Jones: Narrator
Jim Strong (NASA/GSFC): Scientist
Fritz Hasler (NASA/GSFC): Scientist
Horace Mitchell (NASA/GSFC): Scientist
Tom Watters (Smithsonian/Air and Space): Scientist
Tom Watters (Smithsonian/Air and Space): Writer
Please give credit for this item to:
NASA/Goddard Space Flight Center - Scientific Visualization Studio, Smithsonian Institution, Global Change Research Project (GCRP), National Oceanic and Atmosphere Administration (NOAA), United States Geological Survey, National Science Foundation (NSF), Defense Advanced Research Projects Agency (DARPA), Dynamic Media Associates (DMA), New York Film and Animation Company, Silicon Graphics, Inc. (SGI), Hughes STX Corporation
NASA/Goddard Space Flight Center - Scientific Visualization Studio, Smithsonian Institution, Global Change Research Project (GCRP), National Oceanic and Atmosphere Administration (NOAA), United States Geological Survey, National Science Foundation (NSF), Defense Advanced Research Projects Agency (DARPA), Dynamic Media Associates (DMA), New York Film and Animation Company, Silicon Graphics, Inc. (SGI), Hughes STX Corporation
Short URL to share this page:
https://svs.gsfc.nasa.gov/155
Mission:
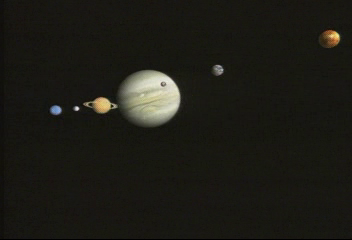
Galileo
Data Used:
Note: While we identify the data sets used in these visualizations, we do not store any further details nor the data sets themselves on our site.
Dates of Data Used:
Various
This item is part of these series:
HoloGlobe and Earth Today
Narrated Movies
Keywords:
DLESE >> Atmospheric science
SVS >> Cloud Cover
SVS >> Earthquake
SVS >> El Nino
DLESE >> Geology
SVS >> HoloGlobe
DLESE >> Human geography
SVS >> NDVI
DLESE >> Natural hazards
SVS >> Night lights
DLESE >> Physical geography
DLESE >> Physical oceanography
SVS >> SST
SVS >> SST Anomaly
GCMD >> Earth Science >> Land Surface >> Topography
GCMD >> Earth Science >> Oceans >> Ocean Temperature >> Sea Surface Temperature
GCMD >> Earth Science >> Solid Earth >> Tectonics >> Plate Boundaries
SVS >> GOES
DLESE >> Narrated
SVS >> Voice Over Talent
NASA Science >> Earth
GCMD keywords can be found on the Internet with the following citation: Olsen, L.M., G. Major, K. Shein, J. Scialdone, S. Ritz, T. Stevens, M. Morahan, A. Aleman, R. Vogel, S. Leicester, H. Weir, M. Meaux, S. Grebas, C.Solomon, M. Holland, T. Northcutt, R. A. Restrepo, R. Bilodeau, 2013. NASA/Global Change Master Directory (GCMD) Earth Science Keywords. Version 8.0.0.0.0
https://svs.gsfc.nasa.gov/155
Mission:
Galileo
Data Used:
ETOPO5
NOAA NGDCNOAA/AVHRR/Sea Surface Temperature Anomaly
NOAA/AVHRR/Sea Surface Temperature
NOAA/AVHRR/NDVI
ISCCP/D2/Cloud Cover
Galileo/Solid-State Imaging Camera
NASA/JPLDMSP/OLS
Defense Meteorological Satellite Program Operational Linescan System
TAO/TRITON
USGS/NEIC/Earthquake Activity
National Earthquake Information Center
Seismic Recording Networks
Dates of Data Used:
Various
This item is part of these series:
HoloGlobe and Earth Today
Narrated Movies
Keywords:
DLESE >> Atmospheric science
SVS >> Cloud Cover
SVS >> Earthquake
SVS >> El Nino
DLESE >> Geology
SVS >> HoloGlobe
DLESE >> Human geography
SVS >> NDVI
DLESE >> Natural hazards
SVS >> Night lights
DLESE >> Physical geography
DLESE >> Physical oceanography
SVS >> SST
SVS >> SST Anomaly
GCMD >> Earth Science >> Land Surface >> Topography
GCMD >> Earth Science >> Oceans >> Ocean Temperature >> Sea Surface Temperature
GCMD >> Earth Science >> Solid Earth >> Tectonics >> Plate Boundaries
SVS >> GOES
DLESE >> Narrated
SVS >> Voice Over Talent
NASA Science >> Earth
GCMD keywords can be found on the Internet with the following citation: Olsen, L.M., G. Major, K. Shein, J. Scialdone, S. Ritz, T. Stevens, M. Morahan, A. Aleman, R. Vogel, S. Leicester, H. Weir, M. Meaux, S. Grebas, C.Solomon, M. Holland, T. Northcutt, R. A. Restrepo, R. Bilodeau, 2013. NASA/Global Change Master Directory (GCMD) Earth Science Keywords. Version 8.0.0.0.0


