Planets and Moons
ID: 1335
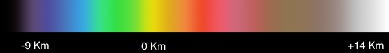
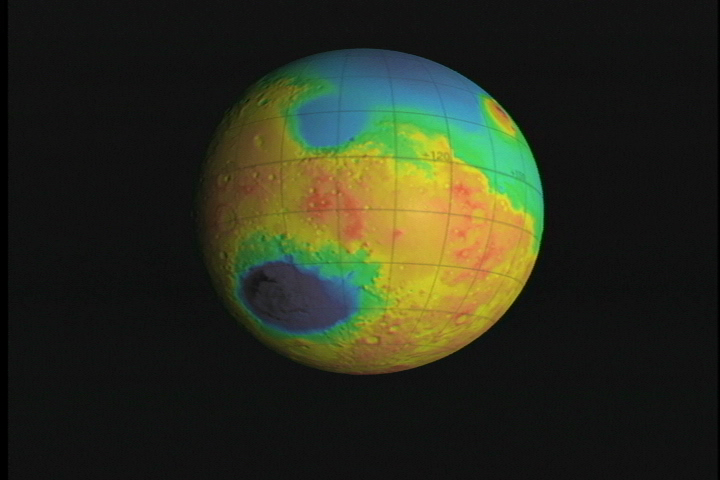
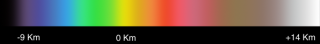
This visualization of the topography of Mars was created for Maria Zuber's Carl Sagan Lecture. The camera flies over several areas of interest. The south pole, Tharsis Rise, the north pole, and Valles Marineris. This animation was created using Maya and Renderman, using MOLA Topography data. The colors represent height - dark blue is about 8km deep and white is over 14km high (as measured from an arbitrary location picked as 'sea-level').
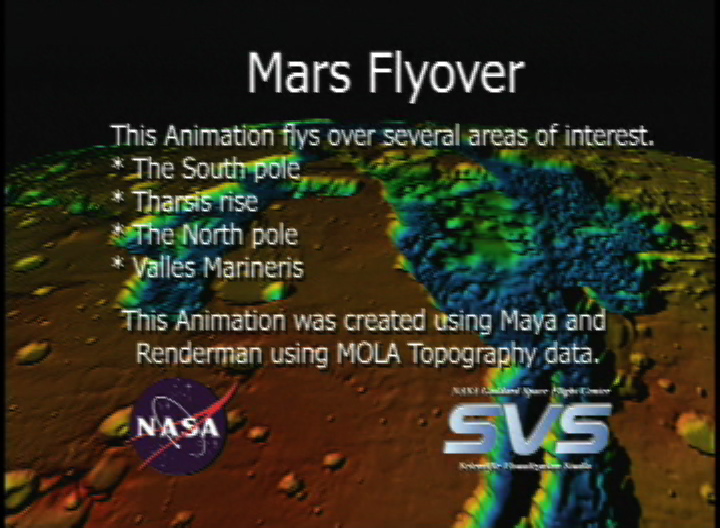
Mars Flyover Based on MOLA Data for the Carl Sagan Lecture
Visualization Credits
Greg Shirah (NASA/GSFC): Lead Animator
Lori Perkins (NASA/GSFC): Animator
Maria Zuber (Massachusetts Institute of Technology): Scientist
Lori Perkins (NASA/GSFC): Animator
Maria Zuber (Massachusetts Institute of Technology): Scientist
Please give credit for this item to:
NASA/Goddard Space Flight Center Scientific Visualization Studio
NASA/Goddard Space Flight Center Scientific Visualization Studio
Short URL to share this page:
https://svs.gsfc.nasa.gov/1335
Dates of Data Used:
1997/09/15-2000/08/07
Keywords:
SVS >> HDTV
SVS >> Mars
DLESE >> Physical geography
DLESE >> Space science
SVS >> Tharsis Rise
SVS >> Valles Marineris
GCMD >> Earth Science >> Land Surface >> Topography
SVS >> Hyperwall
NASA Science >> Planets and Moons
GCMD keywords can be found on the Internet with the following citation: Olsen, L.M., G. Major, K. Shein, J. Scialdone, S. Ritz, T. Stevens, M. Morahan, A. Aleman, R. Vogel, S. Leicester, H. Weir, M. Meaux, S. Grebas, C.Solomon, M. Holland, T. Northcutt, R. A. Restrepo, R. Bilodeau, 2013. NASA/Global Change Master Directory (GCMD) Earth Science Keywords. Version 8.0.0.0.0


