Earth
ID: 1283
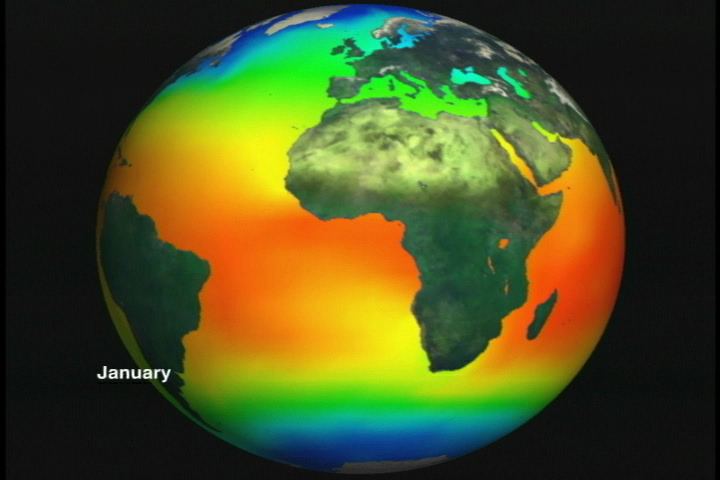
This is one of a series of animations that were produced to be part of the narrated video shown in the HoloGlobe exhibit at the Smithsonian Museum of Natural History and the Earth Today exhibit at the Smithsonian Air and Space Museum. In this animation, colors represent sea surface temperatures in degrees centigrade, with blue representing temperatures less than 4 degrees, cyan representing temperatures between 4 and 11 degrees, green representing temperatures between 11 and 18 degrees, yellow representing temperatures between 18 and 25 degrees, orange representing temperatures between 25 and 32 degrees, and deep red representing temperatures greater than 32 degrees.

HoloGlobe: Sea Surface Temperature Climatology on a Globe (with Dates)
For More Information
Visualization Credits
Jim Strong (NASA/GSFC): Lead Animator
Horace Mitchell (NASA/GSFC): Animator
Tom Watters (Smithsonian/Air and Space): Scientist
Horace Mitchell (NASA/GSFC): Animator
Tom Watters (Smithsonian/Air and Space): Scientist
Please give credit for this item to:
NASA/Goddard Space Flight Center Scientific Visualization Studio
NASA/Goddard Space Flight Center Scientific Visualization Studio
Short URL to share this page:
https://svs.gsfc.nasa.gov/1283
Data Used:
Note: While we identify the data sets used in these visualizations, we do not store any further details nor the data sets themselves on our site.
This item is part of this series:
HoloGlobe and Earth Today
Goddard TV Tape:
G1997-045
Keywords:
DLESE >> Climatology
DLESE >> Physical oceanography
NASA Science >> Earth
https://svs.gsfc.nasa.gov/1283
Data Used:
NOAA-7, 9/AVHRR/AVHRR Multi-Channel Sea Surface Temperature Climatology
1982/01/01-1988/12/31This item is part of this series:
HoloGlobe and Earth Today
Goddard TV Tape:
G1997-045
Keywords:
DLESE >> Climatology
DLESE >> Physical oceanography
NASA Science >> Earth


