Earth
ID: 1246
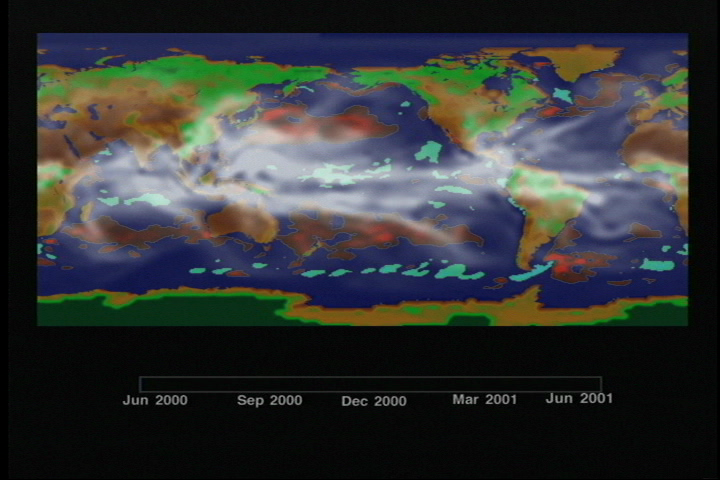
NSIPP Global Water Vapor, Soil Moisture, and Sea Surface Temperature Anomaly
Visualization Credits
Please give credit for this item to:
NASA/Goddard Space Flight Center Scientific Visualization Studio
NASA/Goddard Space Flight Center Scientific Visualization Studio
Short URL to share this page:
https://svs.gsfc.nasa.gov/1246
Data Used:
Note: While we identify the data sets used in these visualizations, we do not store any further details nor the data sets themselves on our site.
This item is part of this series:
Climate
Keywords:
DLESE >> Atmospheric science
DLESE >> Hydrology
SVS >> NSIPP
DLESE >> Physical oceanography
NASA Science >> Earth
https://svs.gsfc.nasa.gov/1246
Data Used:
GEMS/Sea Surface Temperature Anomaly
Model - NASA NSIPP - 2000/06-2001/06
GEMS stands for Goddard Earth Modeling System. It is also known as the NSIPP Global Climate Model.
GEMS/Soil Moisture
Model - NASA NSIPP - 2000/06-2001/06
GEMS stands for Goddard Earth Modeling System. It is also known as the NSIPP Global Climate Model.
GEMS/Water Vapor
Model - NASA NSIPP - 2000/06-2001/06
GEMS stands for Goddard Earth Modeling System. It is also known as the NSIPP Global Climate Model.
This item is part of this series:
Climate
Keywords:
DLESE >> Atmospheric science
DLESE >> Hydrology
SVS >> NSIPP
DLESE >> Physical oceanography
NASA Science >> Earth


