Earth
ID: 1043
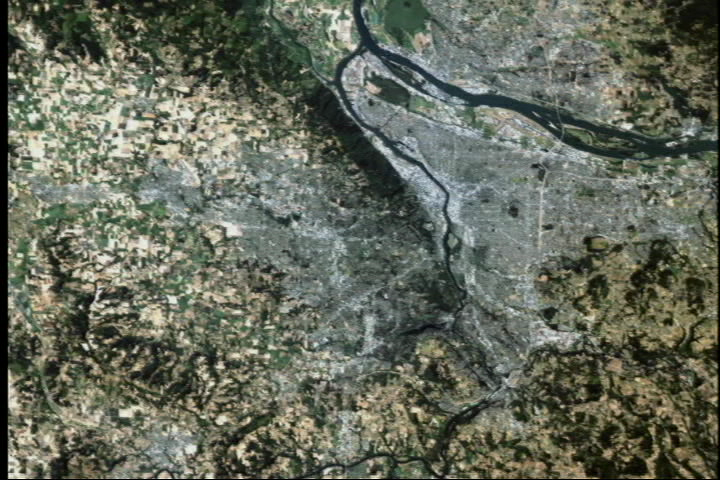
Using the Landsat satellite, scientists are able to study the urban sprawl of major cities. Red dots in these images indicate areas of growth between 1986 and 1996.

Urban Growth: Portland, Oregon
For More Information
Visualization Credits
Please give credit for this item to:
NASA/Goddard Space Flight Center Scientific Visualization Studio
NASA/Goddard Space Flight Center Scientific Visualization Studio
Short URL to share this page:
https://svs.gsfc.nasa.gov/1043
Mission:
Landsat
Data Used:
Note: While we identify the data sets used in these visualizations, we do not store any further details nor the data sets themselves on our site.
This item is part of this series:
AAAS
Keywords:
DLESE >> Human geography
SVS >> Sprawl
SVS >> Urban
SVS >> Washington DC
NASA Science >> Earth
https://svs.gsfc.nasa.gov/1043
Mission:
Landsat
Data Used:
Landsat-7/ETM+
1986, 1996This item is part of this series:
AAAS
Keywords:
DLESE >> Human geography
SVS >> Sprawl
SVS >> Urban
SVS >> Washington DC
NASA Science >> Earth


