Notable CMEs of Solar Cycle 24
Overview
Simulations & visualizations of some of the big solar events of Solar Cycle 24.
These visualizations were developed to present a more public-friendly view in a way that the major events of space weather, such as coronal mass ejections (CMEs) are more obvious even to the untrained observer. We use a fairly basic technique or 'trick' of using the three image color channels, red, green, and blue, to present different variables computed in the model run. The visual color-bars are also on the animation page.
In this case, red represents temperature (kind of obvious choice) so redder is hotter plasma. Green represents density of the plasma. Blue is a pressure gradient, or change in pressure over distance. More blue means a stronger shock wave moving through the plasma, which is more a characteristic of a CME. By combining the three color channels, intense values of these variables can show up as distinct colors. For example, a hot, dense shock combines red, green, and blue to form white. But you could also have a lower density hot shock combining red and blue to make magenta (or purple/violet).
The major visible feature is the 'Parker spiral'. As the solar wind flows out from the sun, the sun is rotating. Density enhancements (green in the visualization) in the wind get propagated outward to make this spiral shape - not too different from the spiral pattern created by a spinning lawn sprinkler. Coronal mass ejections get imprinted on this pattern.
CCMC Model Runs
- ID: 4392 Visualization
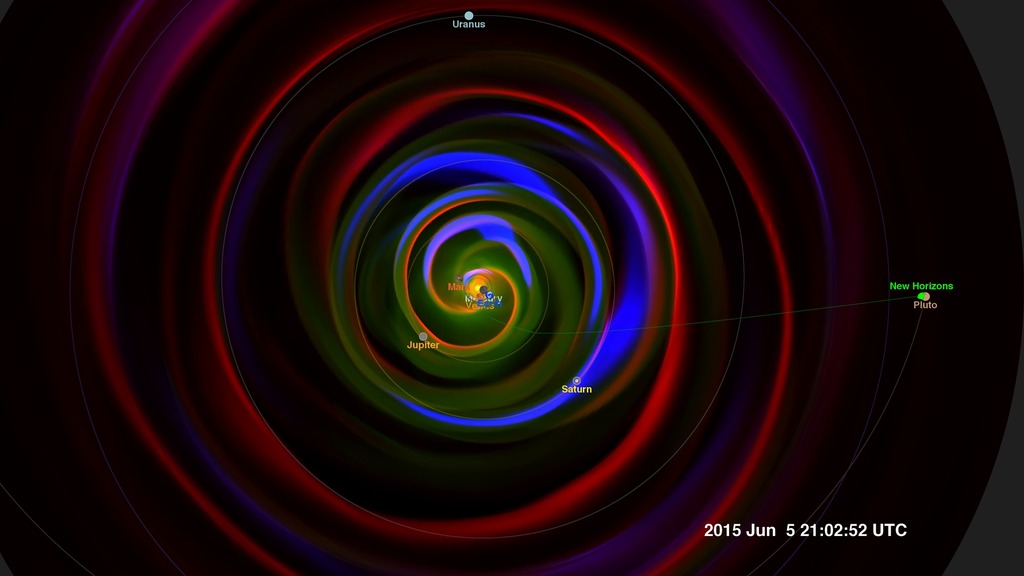
Space Weather to the Edge of the Solar System
Go to this pageCropped view of the Enlil model from early 2015 to just after the New Horizons flyby of Pluto. || NewHorizons2015_40AU.NoSTEREO_1080p30.01000_print.jpg (1024x576) [72.7 KB] || NewHorizons2015_40AU.NoSTEREO_1080p30.mp4 (1920x1080) [27.9 MB] || NewHorizons2015_40AU.NoSTEREO_1080p30.webm (1920x1080) [6.6 MB] || NewHorizons2015_40AU.NoSTEREO.3840x2160_p30.mp4 (3840x2160) [82.5 MB] || frames/5760x3240_16x9_30p/ (5760x3240) [128.0 KB] || frames/3840x2160_16x9_30p/NoSTEREO/ (3840x2160) [128.0 KB] ||
- ID: 4167 Visualization
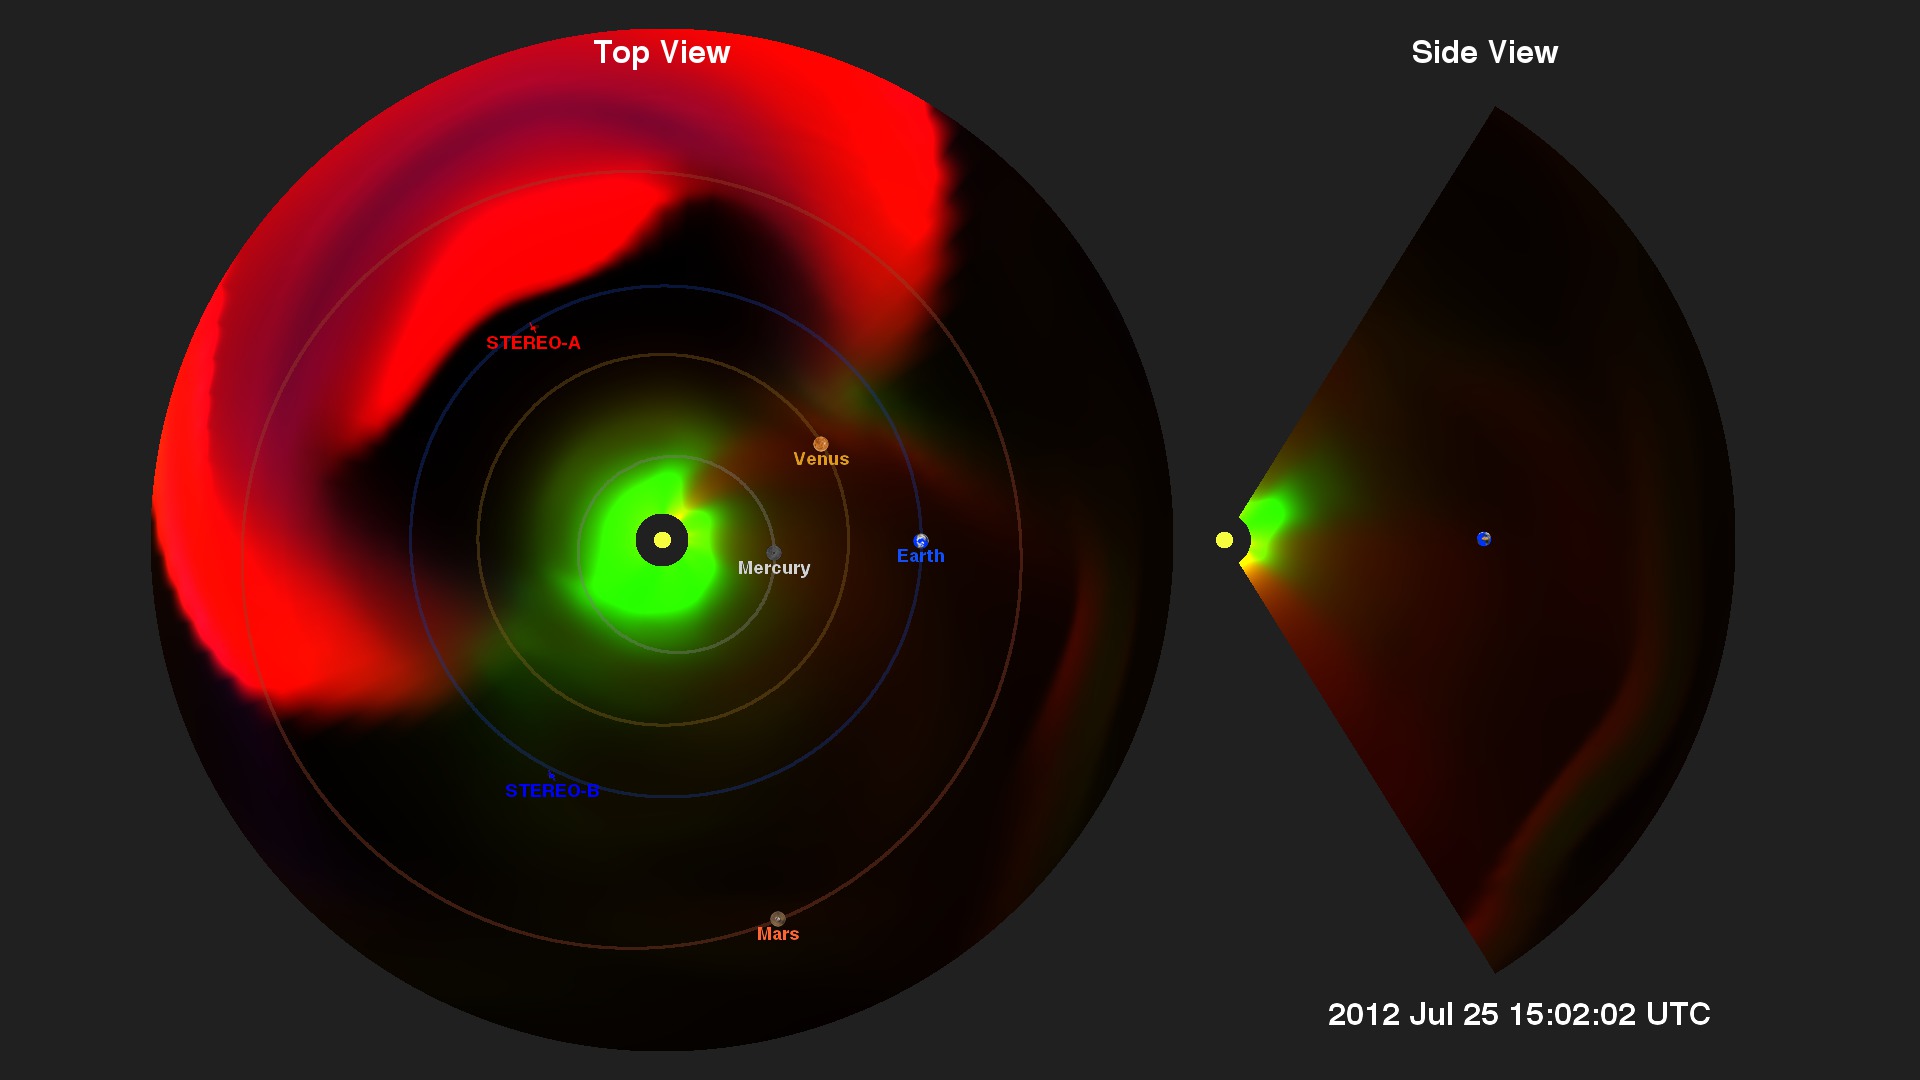
The Big CME that Missed Earth
Go to this pageJuly of 2012 witnessed the eruption of a very large and fast solar coronal mass ejection (CME) (see NASA STEREO Observes One of the Fastest CMEs On Record and Carrington-class CME Narrowly Misses Earth ). While not directed at Earth, it was sufficiently large that it could have seriously disrupted the global electrical infrastructure. The event did impact STEREO-A of NASA's heliophysics fleet which provided a host of measurements (see Sentinels of the Heliosphere).One of the conditions which contributed to the high speed of this event is that two smaller CMEs were launched a little earlier, and these events cleared out much of the solar wind material, leaving little to slow the outflow of the July 23 event (UTC).In the visualizations below, generated from the Enlil space weather model, green represents particle density, usually protons and other ions. In green, we see the Parker spiral moving out from the sun generated by the sun's current sheet (Wikipedia). Red represents particles at high temperatures and shows the CME is hotter than the usual solar wind flow. Large changes in density are represented in blue. These three colors sometimes combine to tell us more about the characteristics of the event (noted in the 3-color Venn diagram below).However, if this CME had struck Earth's magnetosphere, which has a much stronger magnetic field, the changing magnetic field would induce much larger voltages in systems with long electrical conductors, such as power lines that run over long distances. These significantly higher voltages can damage power transformers. ||
- ID: 4099 Visualization
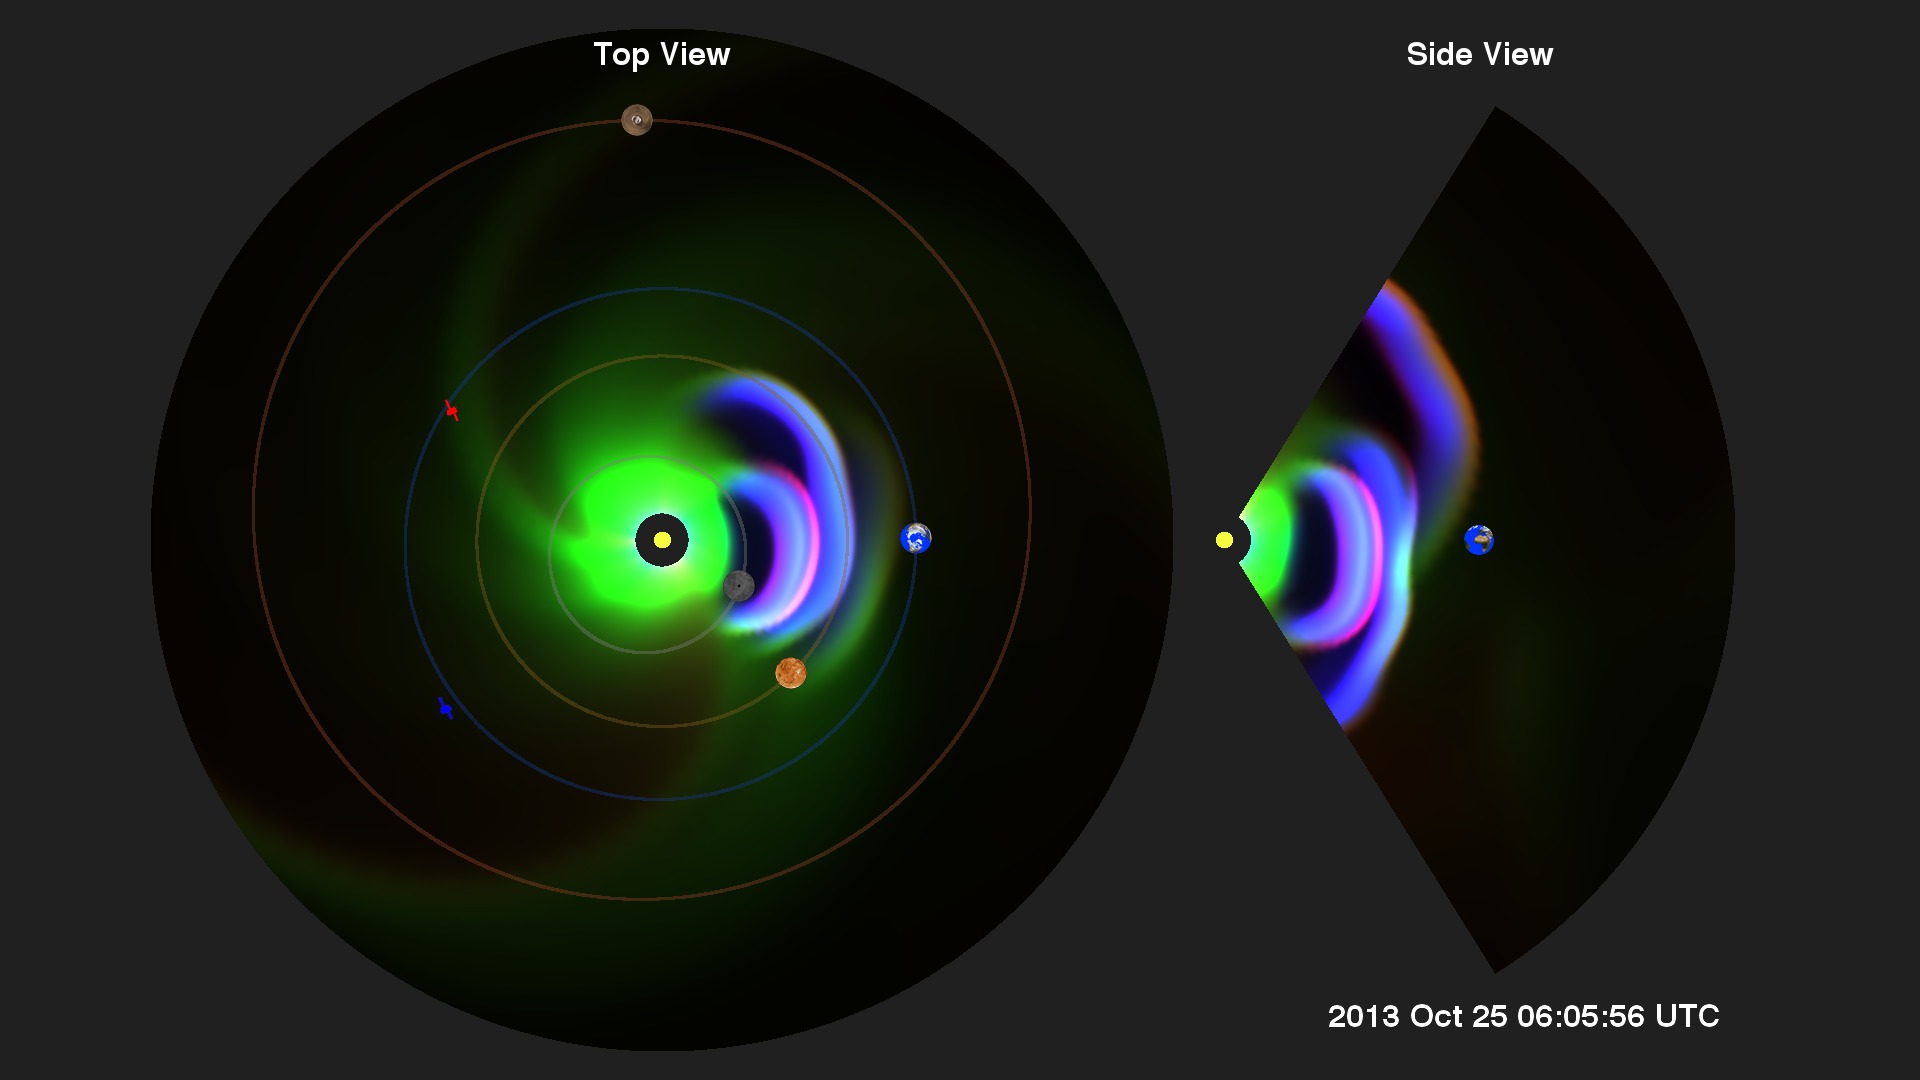
Multiple CMEs of October 2013
Go to this pageIn this research model run, the Sun has launched three coronal mass ejections (CMEs) which may merge into a single front as it expands into the solar system. These events are sometimes called 'cannibal' CMEs.This model run is based on estimated parameters from solar events of October 23-24, 2013 ||
- ID: 4058 Visualization
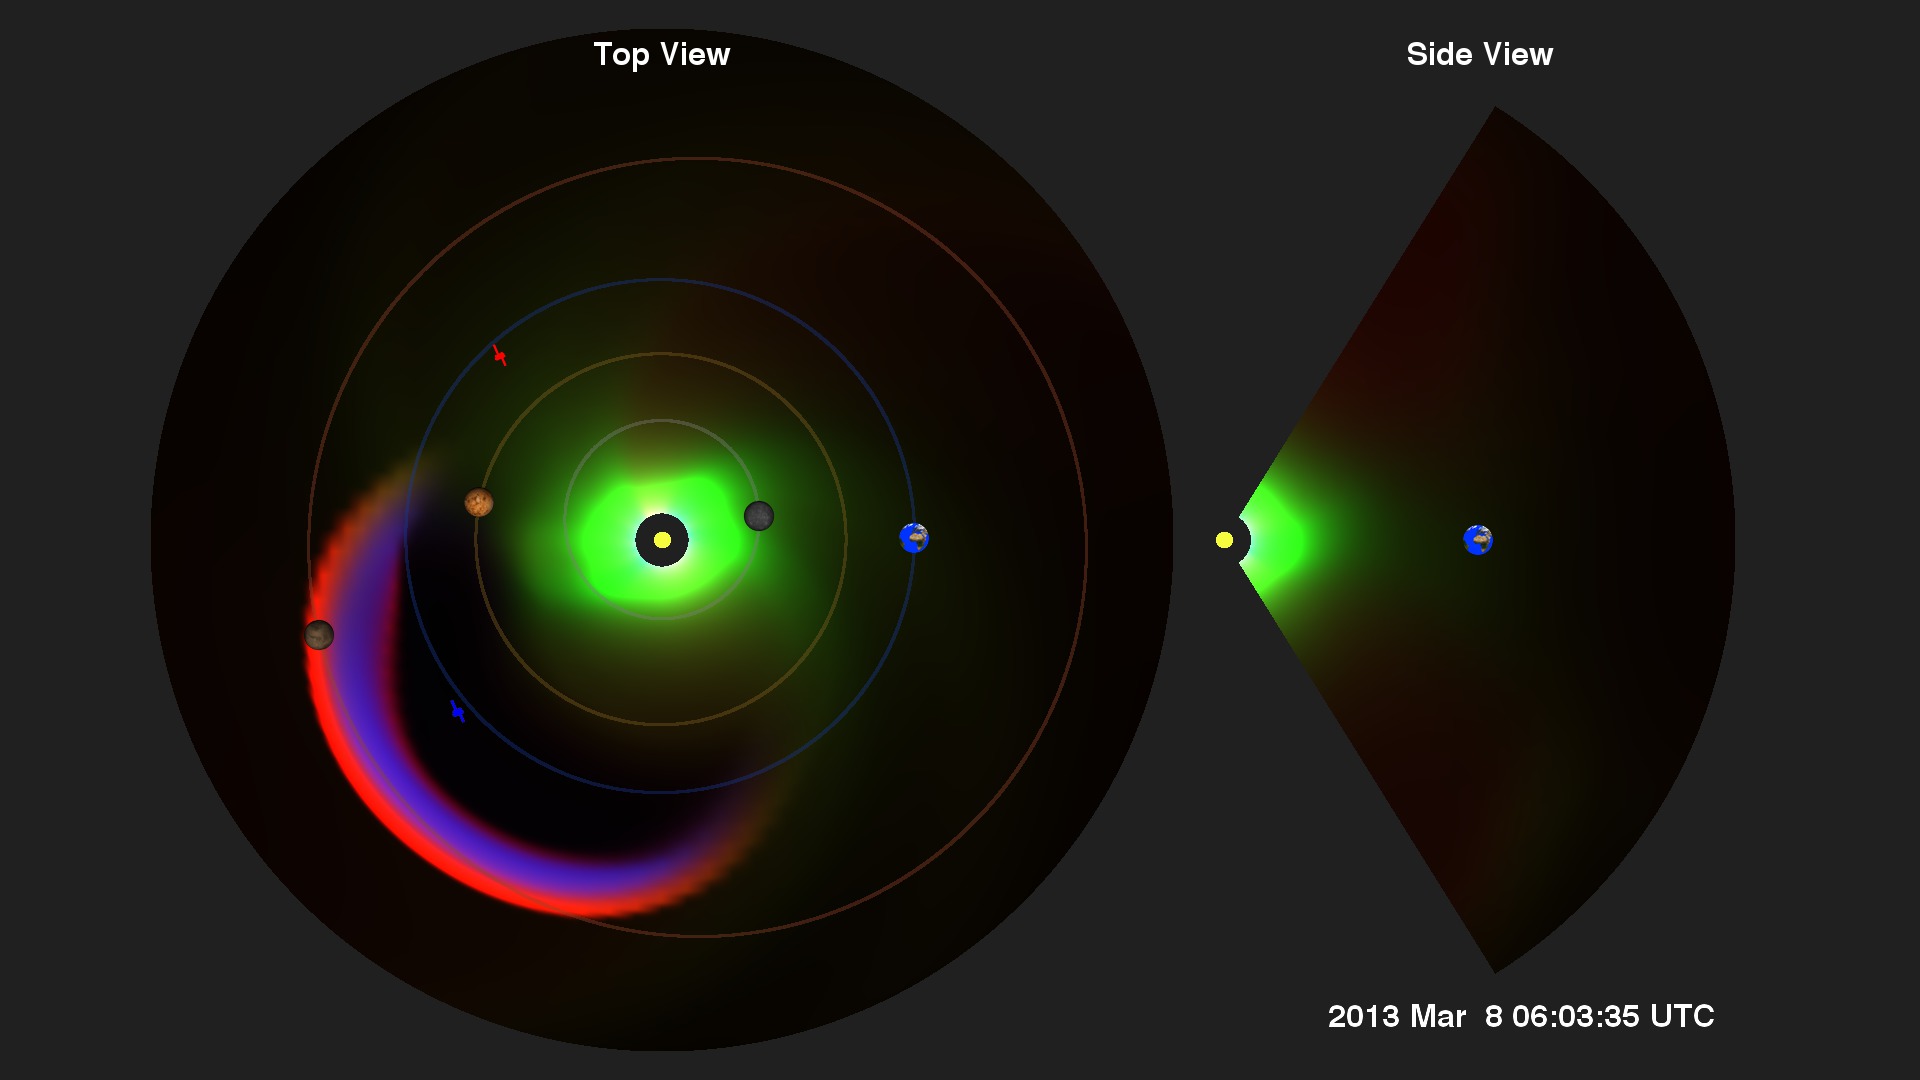
Space Weather @ Mars: The CME of March 5, 2013
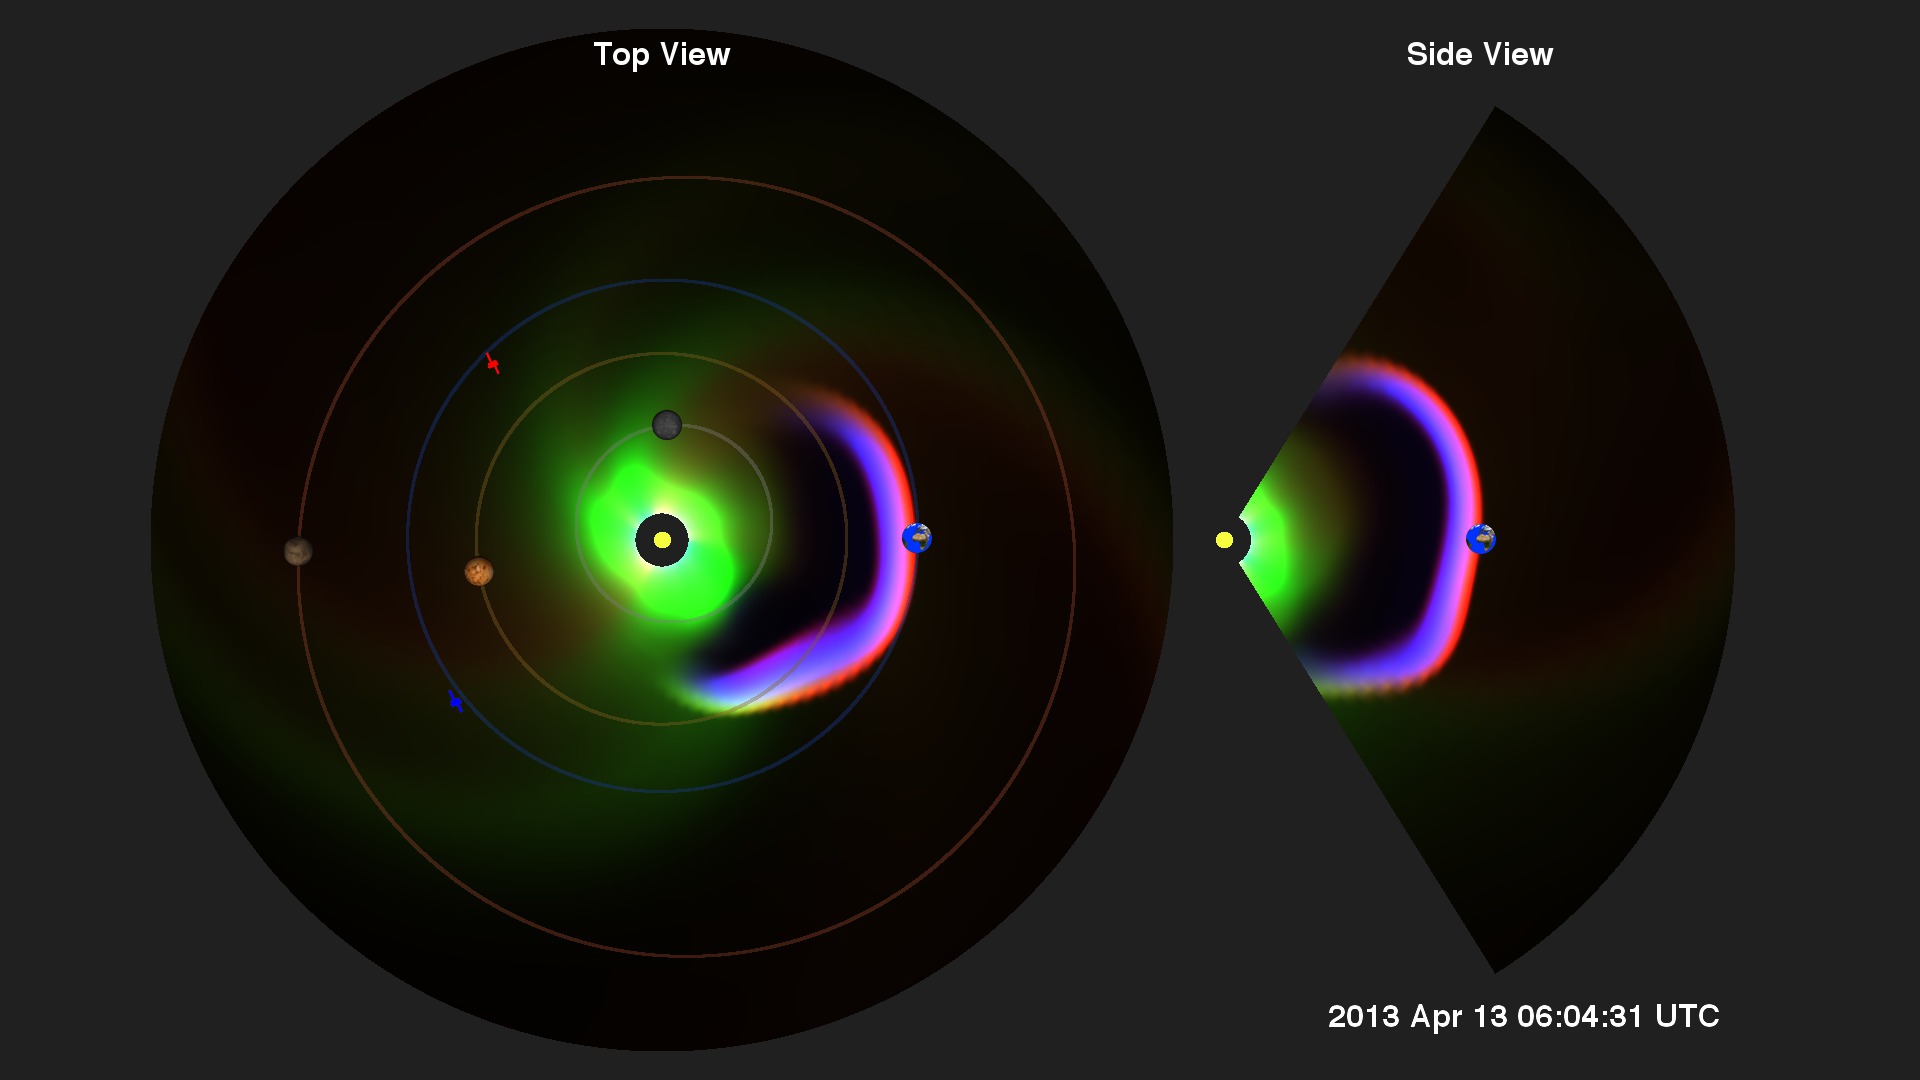
Go to this pageThese images were produced from a space weather model known as ENLIL named after the Sumerian storm god. It shows the way a coronal mass ejection (CME) on March 5, 2013, was expected to travel. The view on the left is top down, while the one on the right shows Earth from the side.To protect their space assets from excessive radiation, NASA and other organizations research the fundamental processes behind space weather such as CMEs, integrating them into research models, which are run continuously at the Community-Coordinated Modeling Center (CCMC) at NASA Goddard.When CMEs occur on the sun, models are generated with the best event information available at the time and propagated forward to estimate regions in the solar system that might be affected. The models take about an hour or two to run. The CMEs themselves usually take one or two days to reach other planets or spacecraft.The March 5 CME moved towards Mars and the STEREO-B spacecraft (blue spacecraft icon). This allowed mission operators to take steps to protect STEREO-B as well as spacecraft operating around and on Mars. ||
- ID: 4064 Visualization
The CME of April 11, 2013
Go to this pageThe CME launched from the Sun on April 11, 2013 was modelled at the Community-Coordinated Modeling Center (CCMC) at NASA's Goddard Space Flight Center. These model runs are used for testing various space weather models and for protecting NASA assets (spacecraft AND astronauts) throughout the Solar System.Different colors of a red, green, blue color palette are used to designate different physical variables from the simulation. When the three colors combine, they create a dramatic example of how the coronal mass ejection (CME) is different from the solar wind. ||
- ID: 4056 Visualization
The CME of March 15, 2013
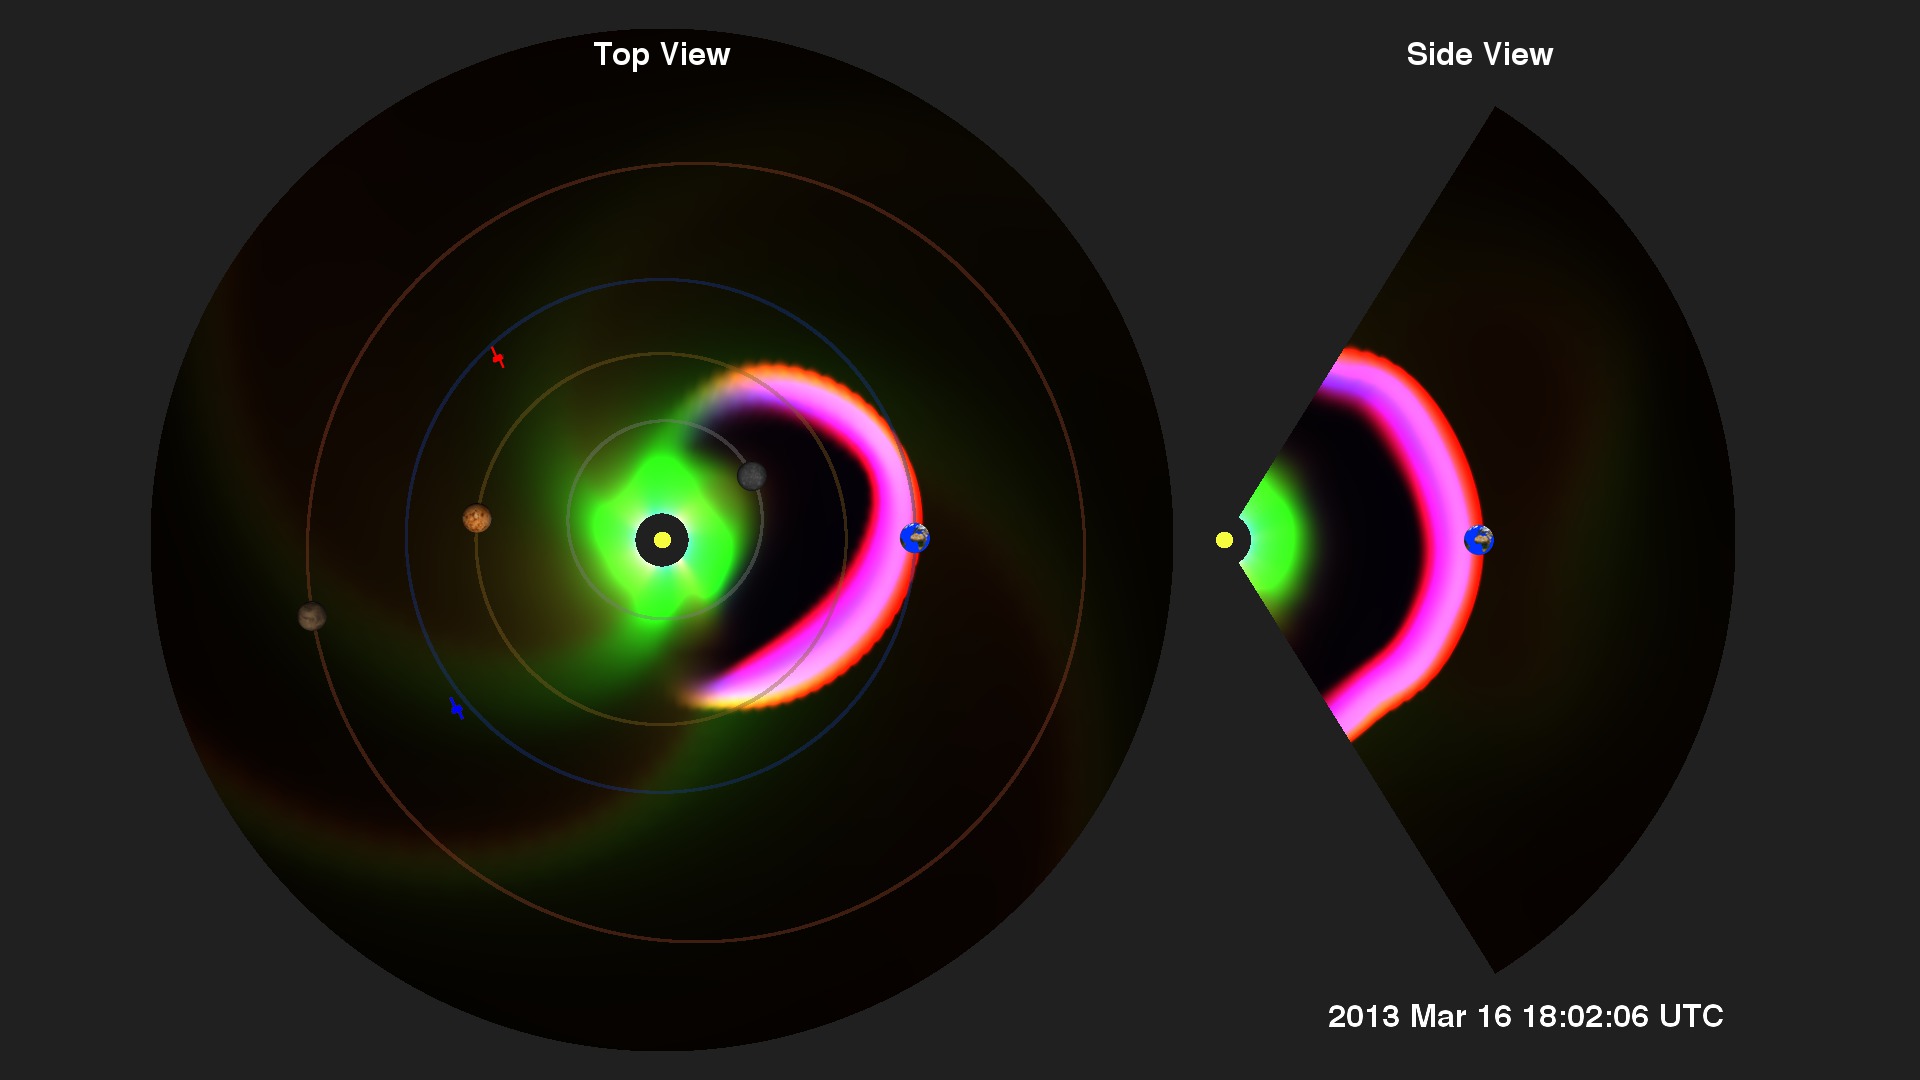
Go to this pageThe CME launched from the Sun on March 15, 2013 was modelled at the Community-Coordinated Modeling Center (CCMC) at NASA's Goddard Space Flight Center. These model runs are used for testing various space weather models and for protecting NASA assets (spacecraft AND astronauts) throughout the Solar System.Different colors of a red, green, blue color palette are used to designate different physical variables from the simulation. When the three colors combine, they create a dramatic example of how the coronal mass ejection (CME) is different from the solar wind. ||
- ID: 4031 Visualization
First Earth-Directed CME of 2013
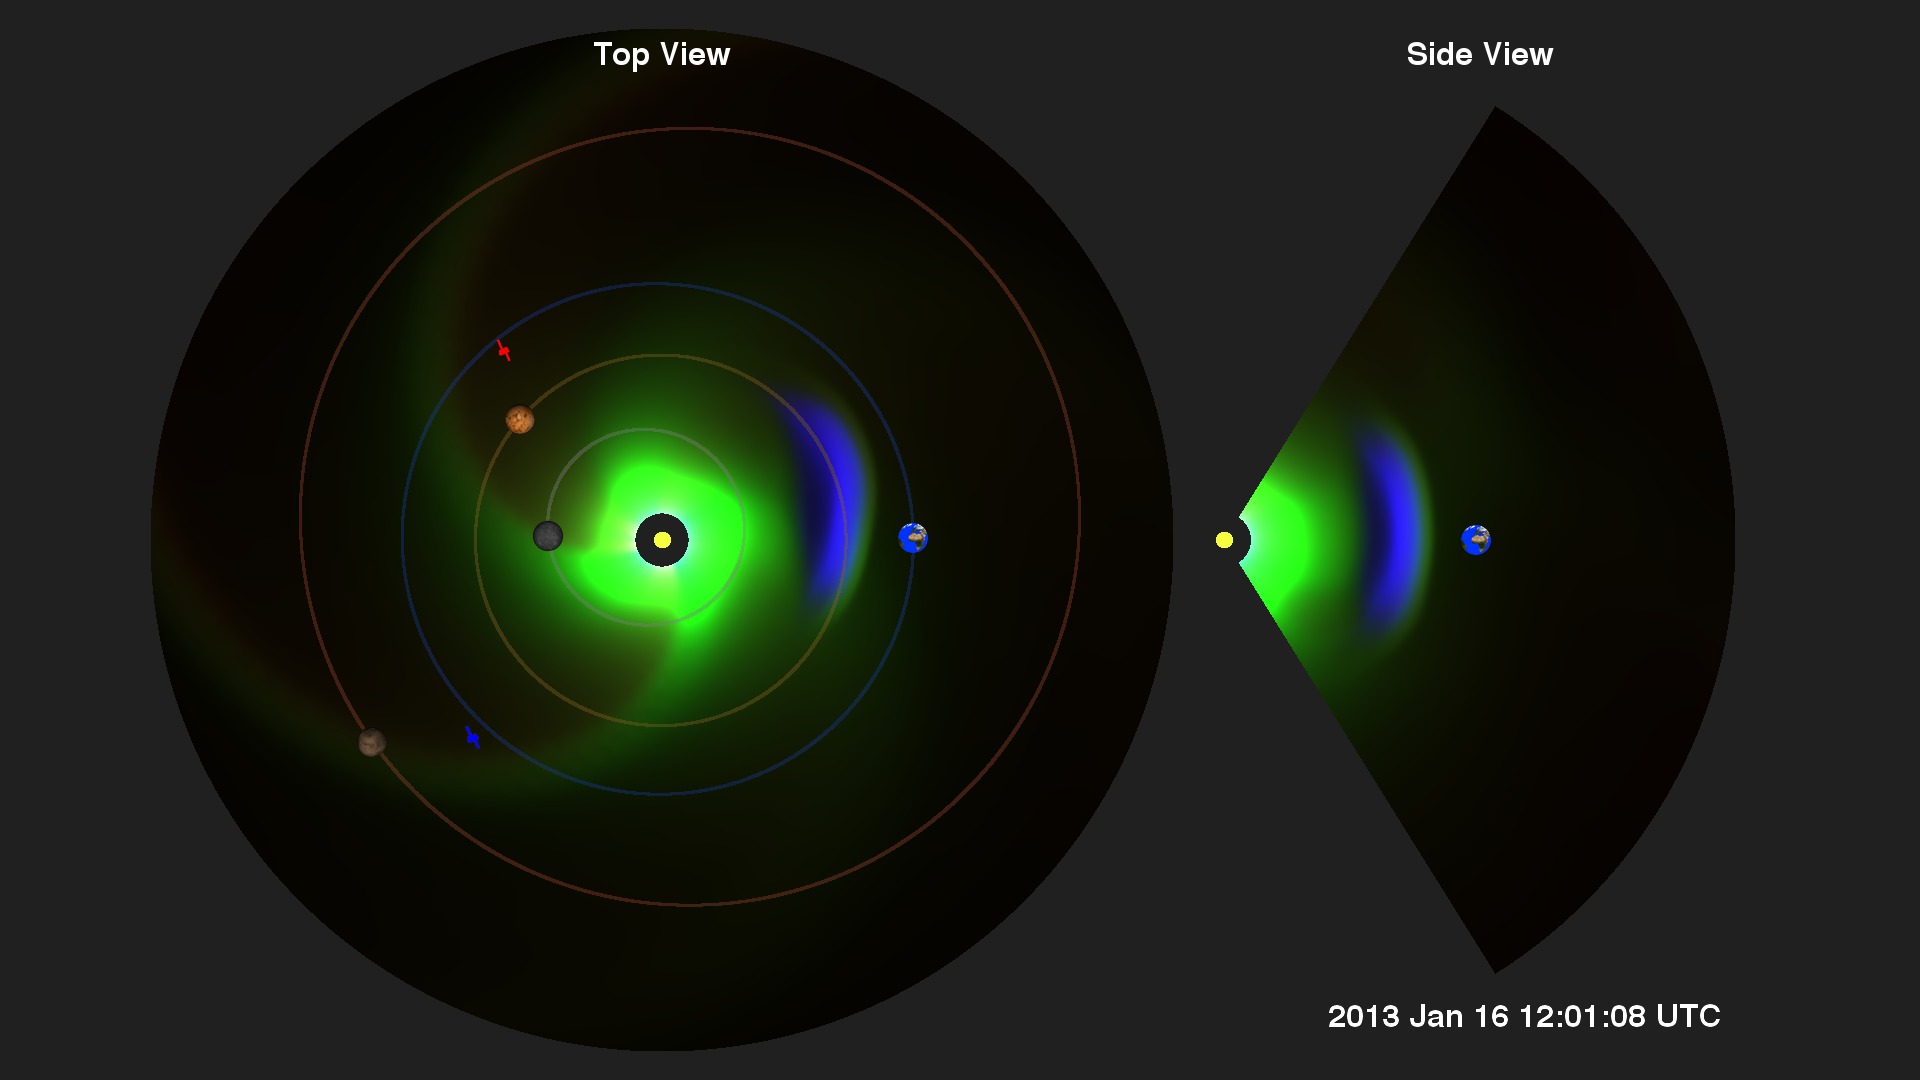
Go to this pageOn Jan. 13, 2013, at 2:24 a.m. EST, the sun erupted with an Earth-directed coronal mass ejection or CME. Not to be confused with a solar flare, a CME is a solar phenomenon that can send solar particles into space and reach Earth one to three days later.Experimental NASA research models, based on observations from the Solar Terrestrial Relations Observatory (STEREO) and the ESA/NASA mission the Solar and Heliospheric Observatory, show that the CME left the sun at speeds of 275 miles per second. This is a fairly typical speed for CMEs, though much slower than the fastest ones, which can be almost ten times that speed.This visualization is constructed from a computer model run of the January 13, 2013 CME. The preliminary CME parameters were measured from instruments on the STEREO (the red and blue satellite icons) and SDO (in Earth orbit) satellites. The Enlil model was used to propagate those parameters through the solar system. From this model, they can estimate the strength and time of arrival of the CME at various locations around the solar system. This allows other missions to either safe-mode their satellites for protection, or allow them to conduct measurements to test the accuracy of the model.When Earth-directed, CMEs can cause a space weather phenomenon called a geomagnetic storm, which occurs when they successfully connect up with the outside of the Earth's magnetic envelope, the magnetosphere, for an extended period of time. In the past, CMEs of this speed have not caused substantial geomagnetic storms. They have caused auroras near the poles but are unlikely to affect electrical systems on Earth or interfere with GPS or satellite-based communications systems.Two active regions — named AR 11652 and AR 11654 by the National Oceanic and Atmospheric Administration (NOAA) — have produced four low-level M-class flares since Jan. 11. Solar flares are powerful bursts of light and radiation. Harmful radiation from a flare cannot pass through Earth's atmosphere to physically affect humans on the ground, however, when intense enough, they can disturb the atmosphere in the layer where GPS and communications signals travel. M-class flares are the weakest flares that can still cause some space weather effects near Earth. The recent flares caused weak radio blackouts and their effects have already subsided.NOAA's Space Weather Prediction Center is the United States Government official source for space weather forecasts. ||
- ID: 4010 Visualization
Space Weather Research: The CME of March 2012
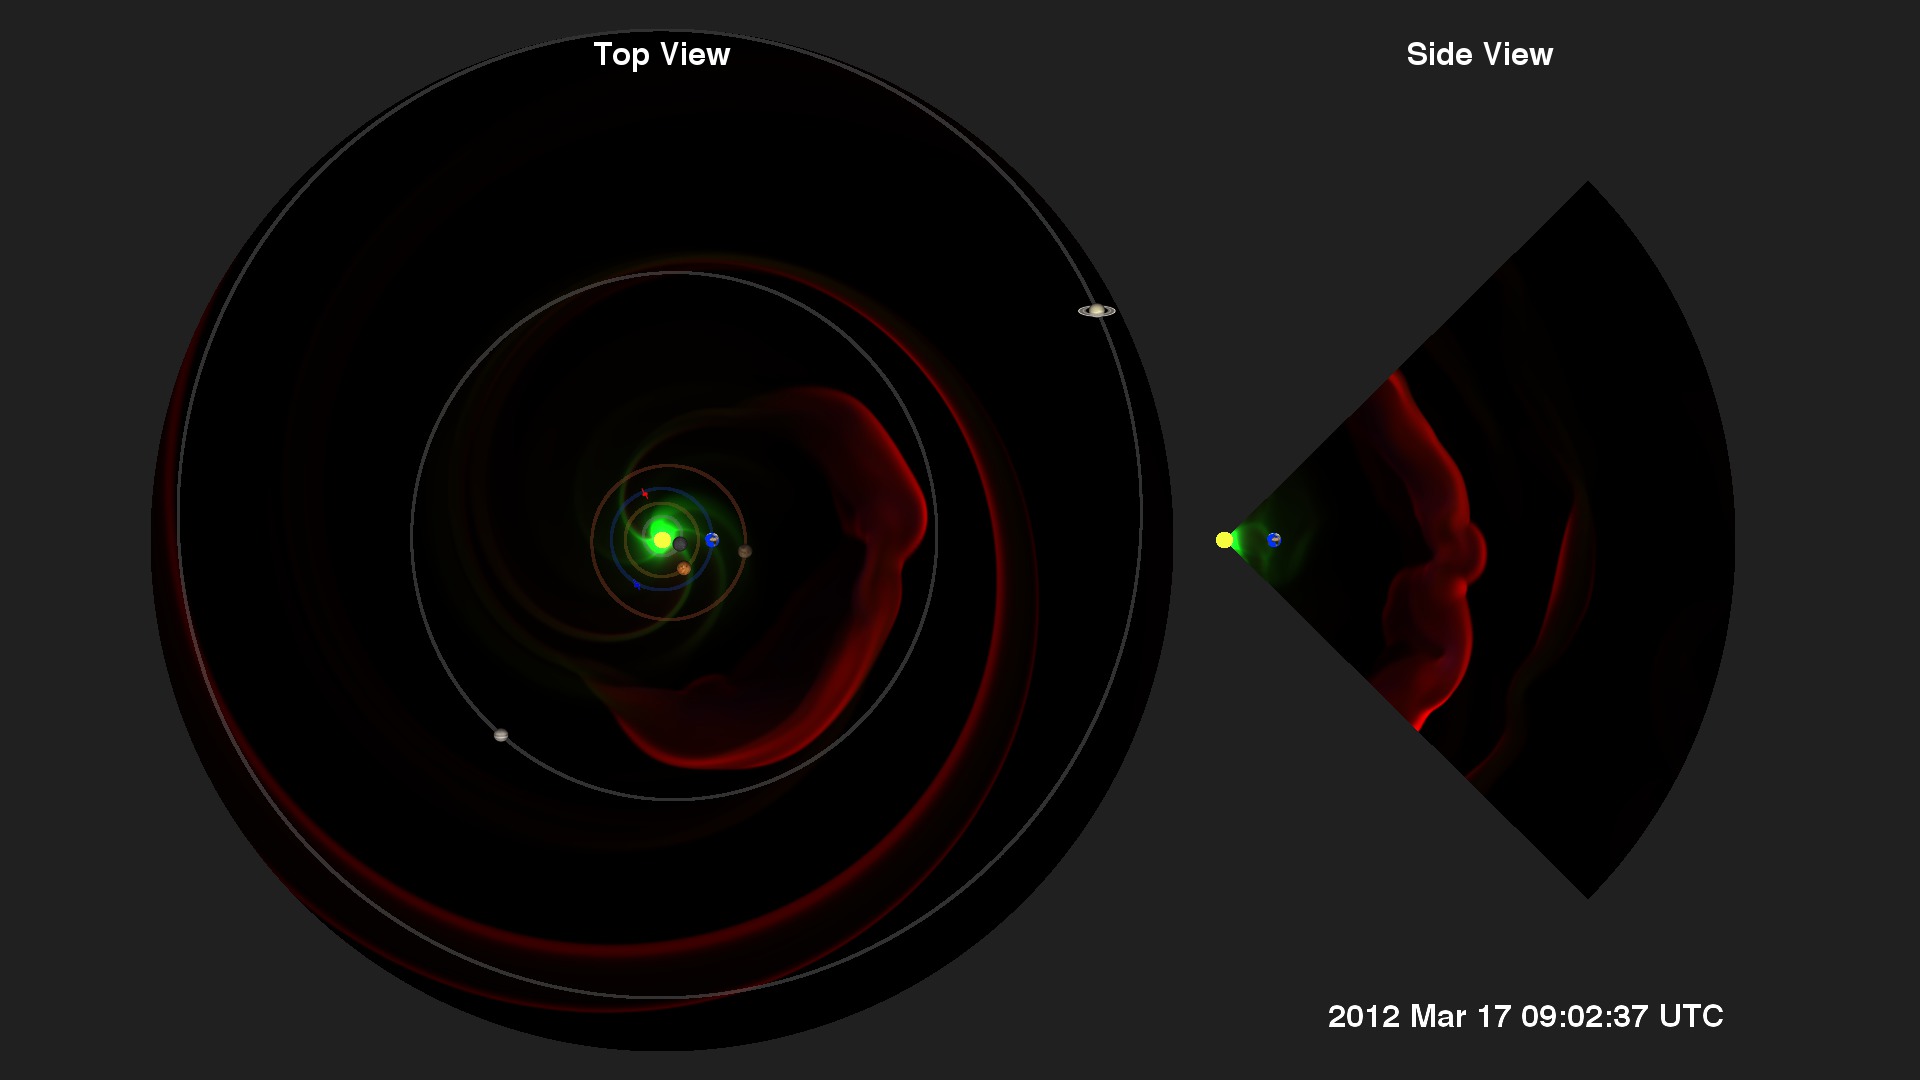
Go to this pageForecasting space weather is of vital importance in protecting NASA assets around the solar system. For this reason, NASA routinely tests various space weather models at the Community-Coordinated Modeling Center (CCMC).This visualization is constructed from a computer model run of a coronal mass ejection (CME) launched from the sun in early March, 2012. The preliminary CME parameters were measured from instruments on the STEREO (the red and blue satellite icons) and SDO (in Earth orbit) satellites. The Enlil model was used to propagate those parameters through the solar system. From this model, they can estimate the strength and time of arrival of the CME at various locations around the solar system. This allows other missions to either safe-mode their satellites for protection, or allow them to conduct measurements to test the accuracy of the model. ||
CMEpalooza: A Week of CMEs
In the middle of May, 2013, an active sunspot group launched a series of multiple CMEs almost daily. Here we've run the research model out to the orbit of Saturn!
- ID: 4083 Visualization
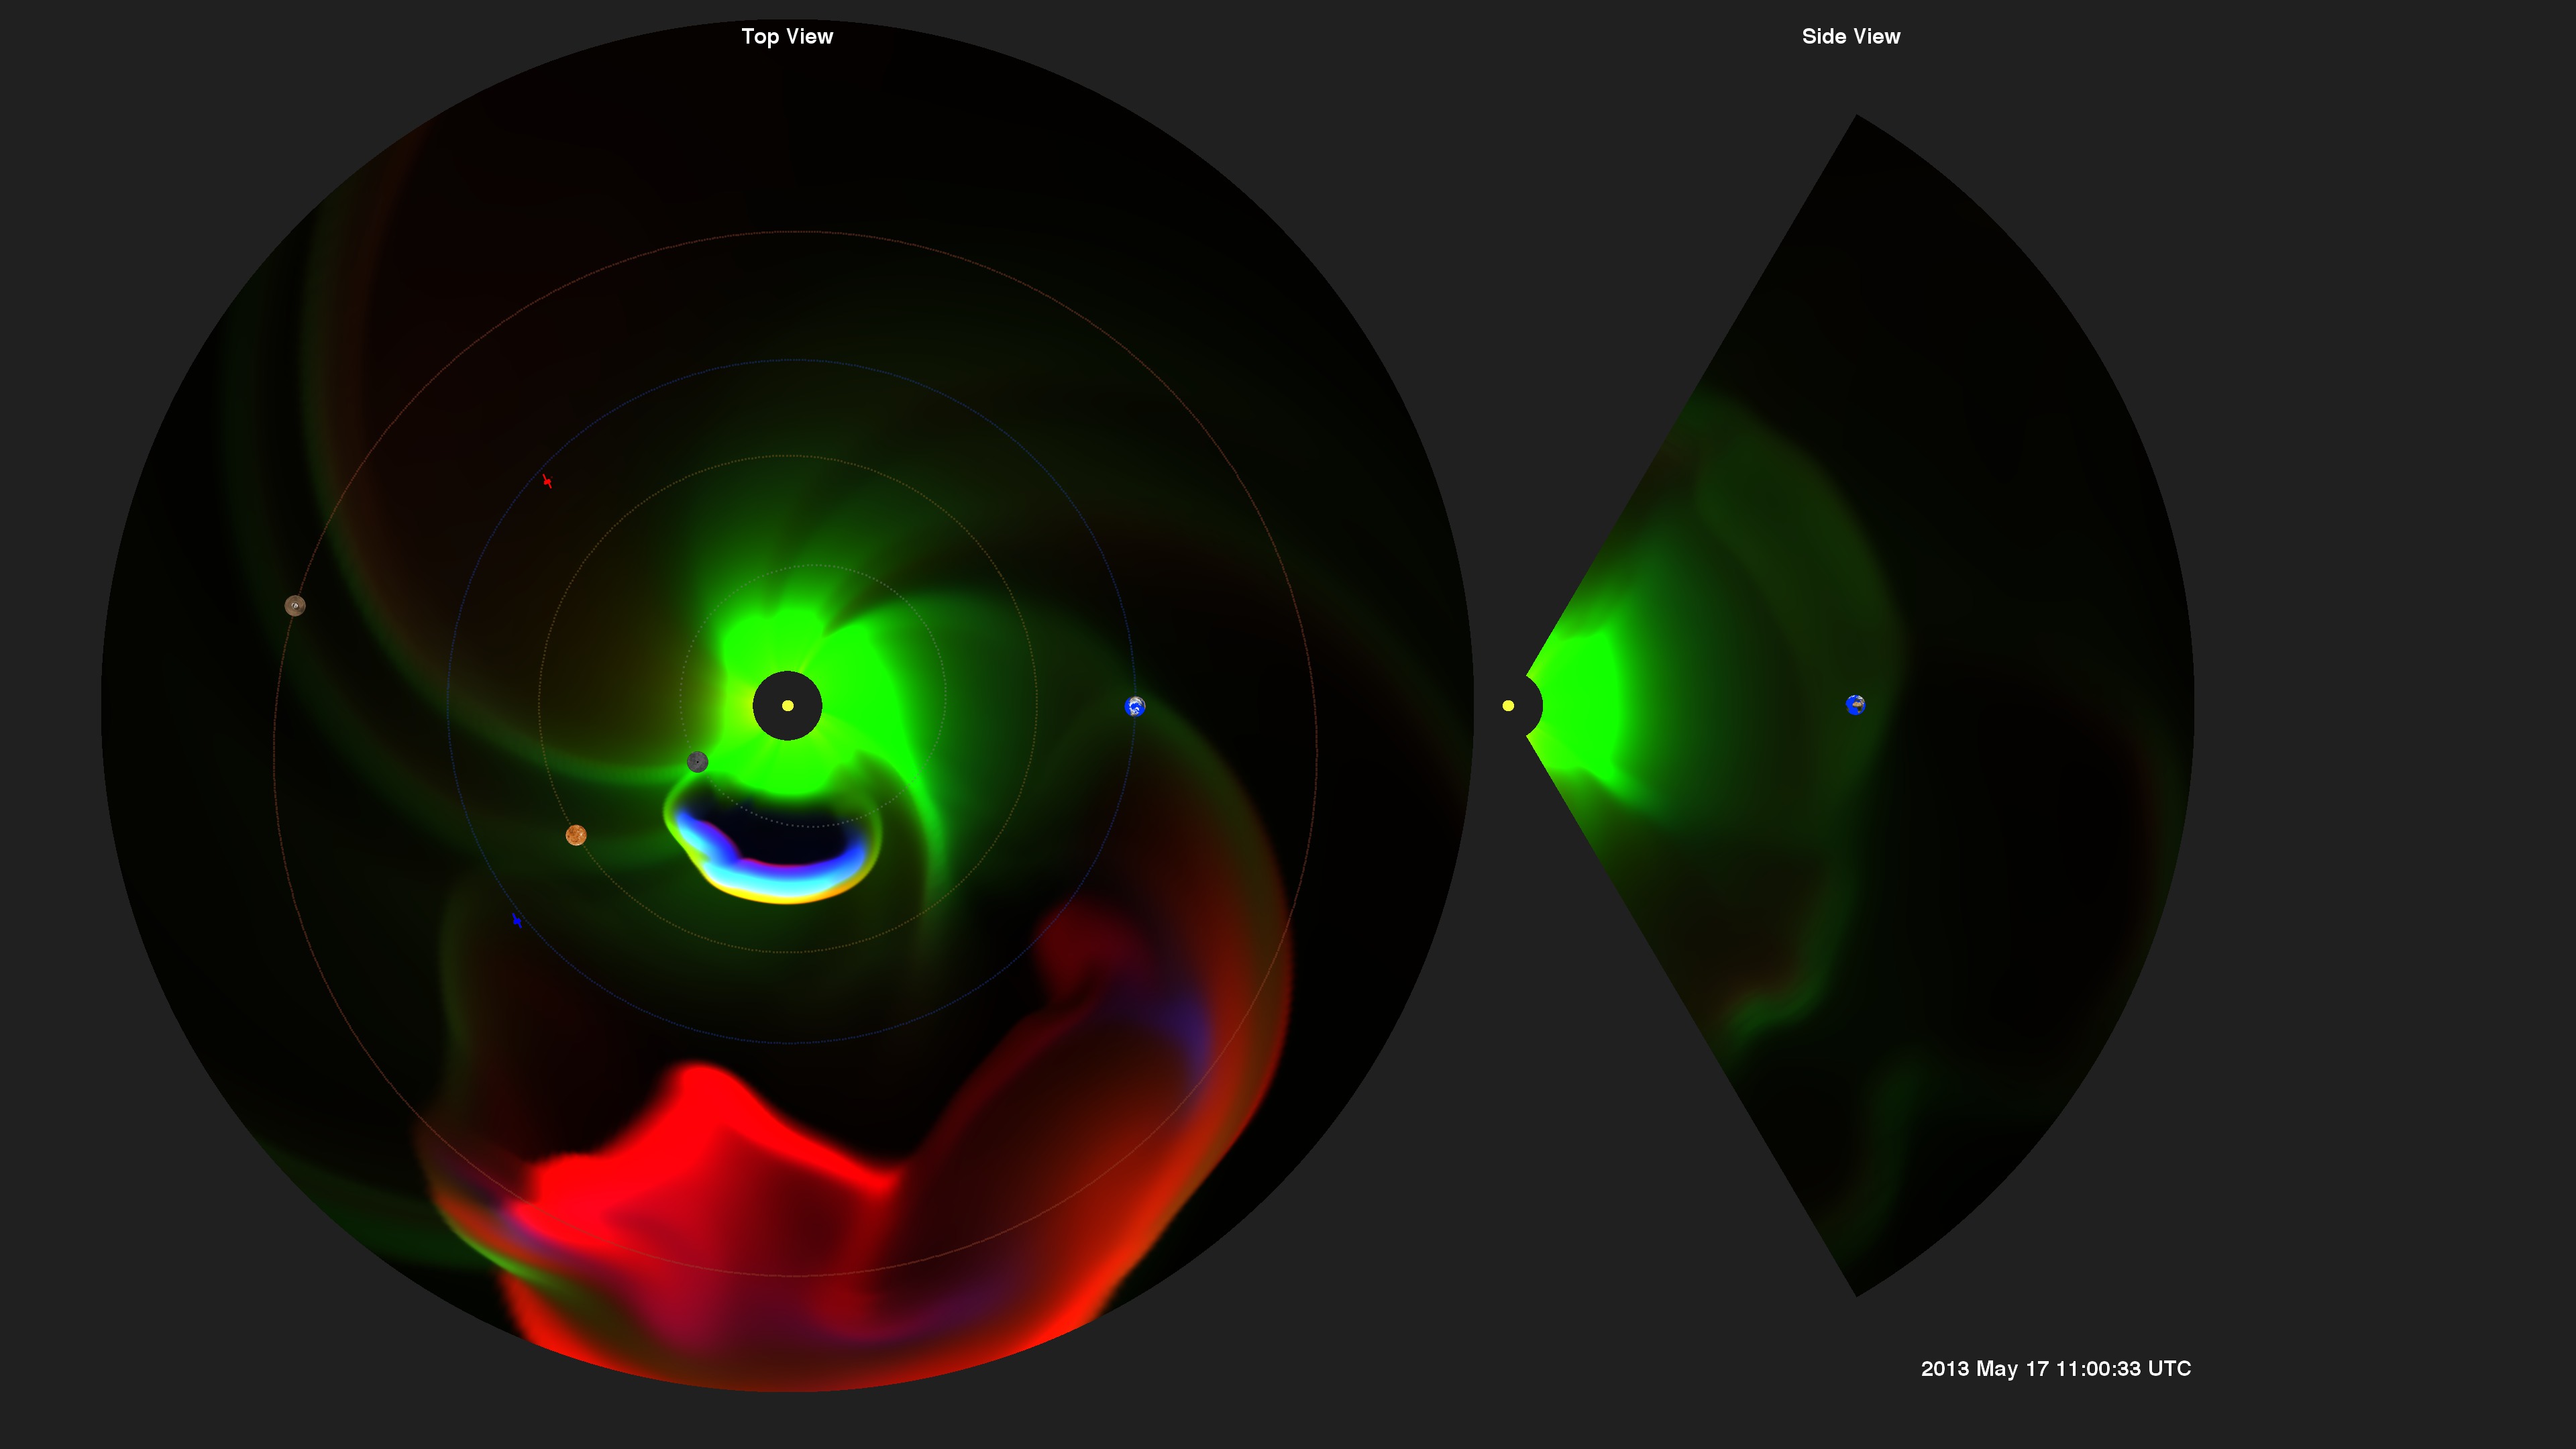
CMEpalooza: The Complete Series
Go to this pageMid-May 2013 marked a series of active solar events, the likes of which have not been seen since near the peak of solar cycle 23 in October-November of 2003 (see Looking Back at 2003s Spooky Halloween Solar Storms).Five distinct coronal mass ejections, or CMEs, were launched from the sun from Active Regions AR 1748 starting May 13, 2013, through May 20, 2013. Some of the CMEs were associated with preceding M- and X-class flares. The CMEs were not a major threat to Earth technologies as most of them missed Earth, but they did impact various NASA satellites around the solar system. The last of the series of CMEs brushed by Earth. ||
- ID: 4079 Visualization
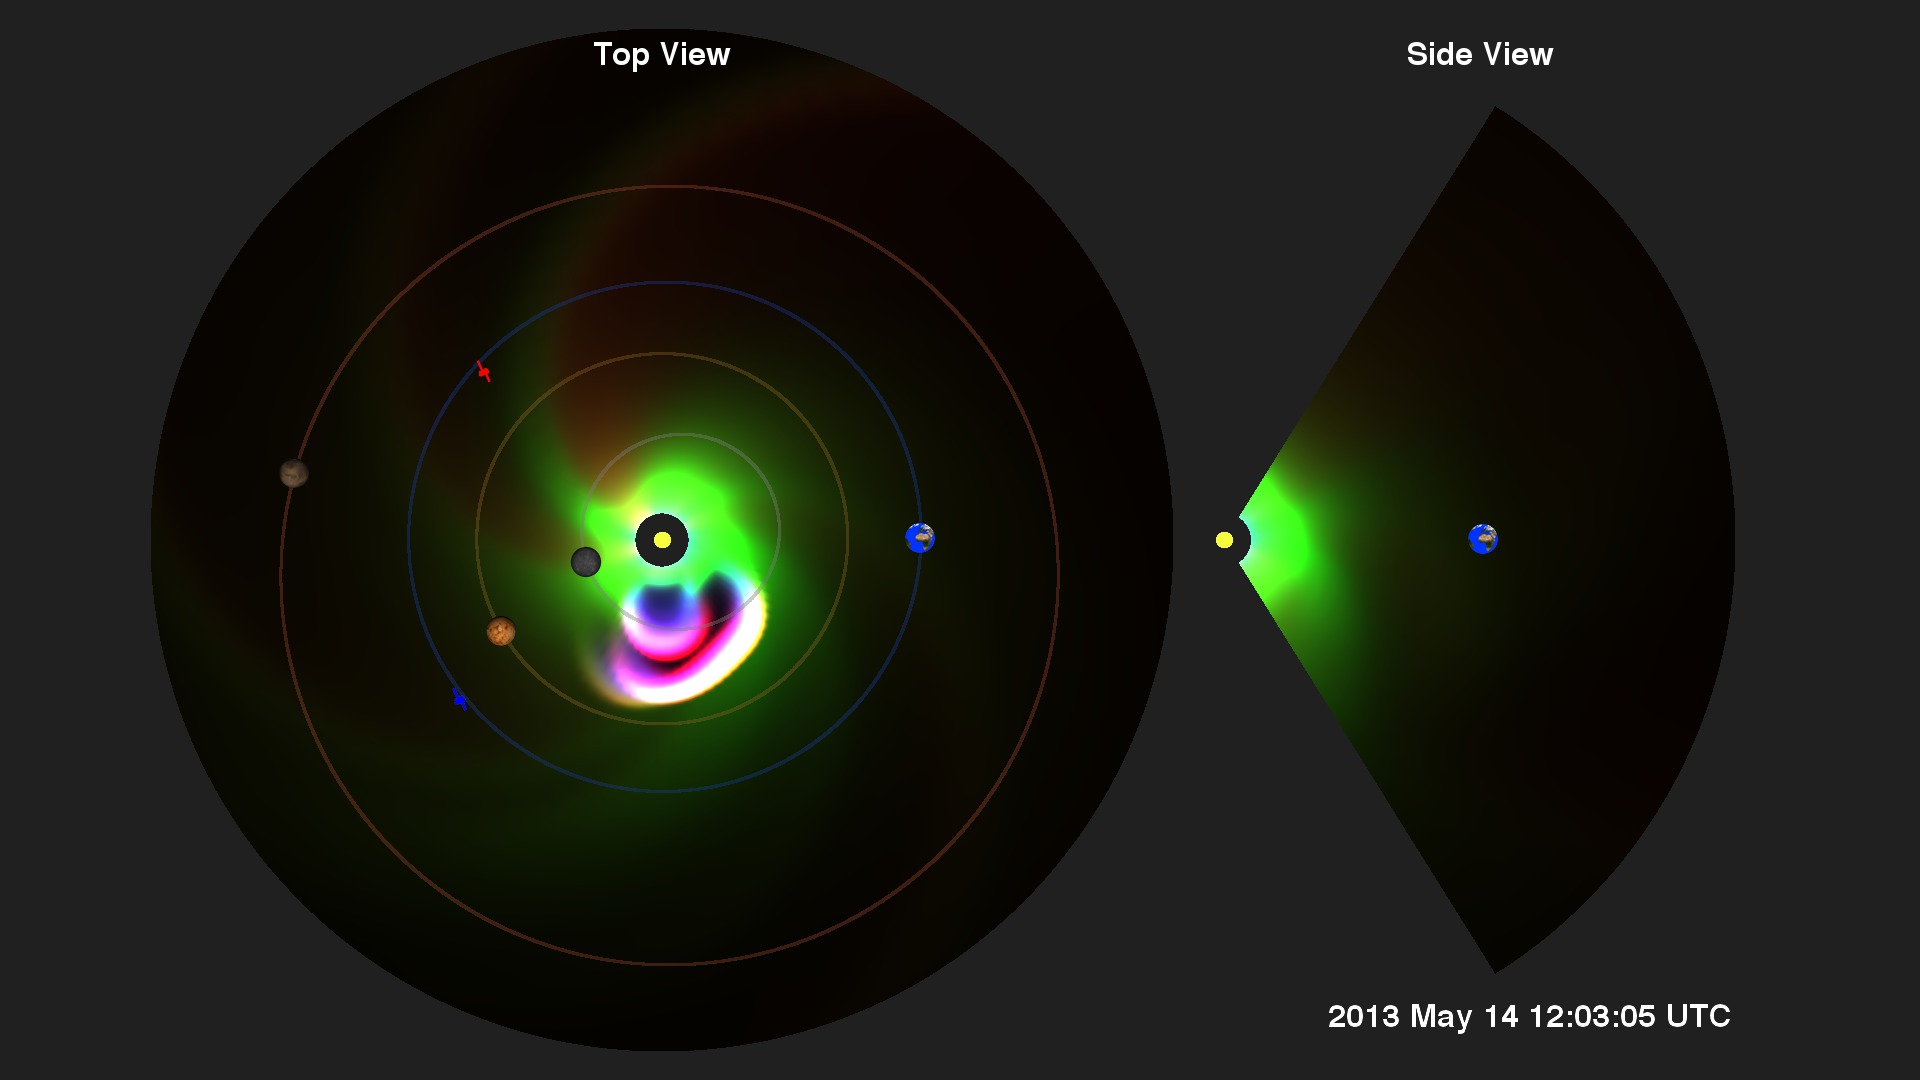
CMEpalooza - May 14, 2013
Go to this pageAs active Region 11748 rotated into Earth's view over the left limb of the sun it erupted with many large flares and coronal mass ejections (CMEs). Some of the flares were X-class.This event is of particular interest as it launched three CMEs that are expected to merge into a large plasma cloud and continue heading out into the solar system. A few NASA spacecraft were in the path of this event — their operators can put the spacecraft into safe mode for protection when required. ||
- ID: 4078 Visualization
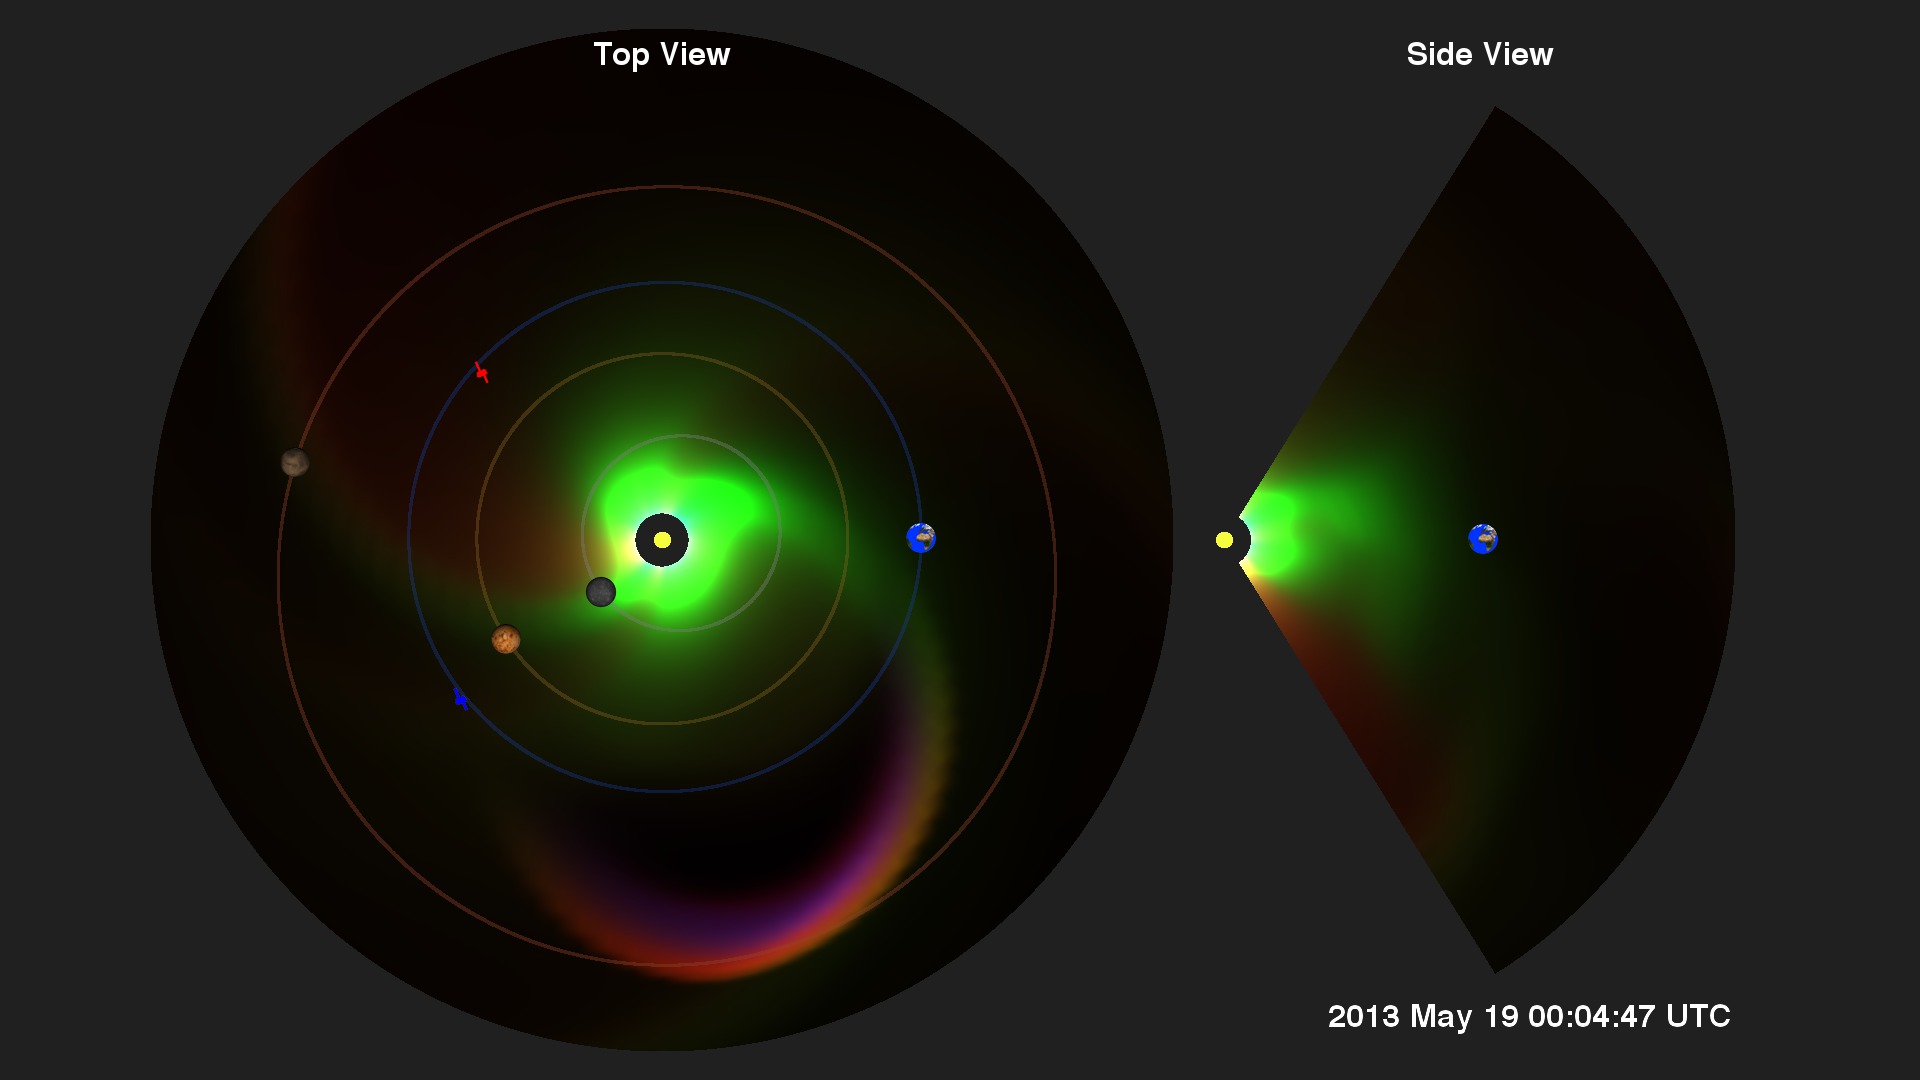
CMEpalooza - May 15, 2013
Go to this pageActive Region 11748 launches another big coronal mass ejection (CME) into the solar system along with X-class flares. See CMEpalooza - May 14, 2013 for the previous event. This is the forecast trajectory from the Community-Coordinated Modeling Center of the CME through the inner solar system. ||