A-Train visualizations
Overview
From Oct. 25-28, 2010, scientists from around the world gathered in New Orleans for the second-ever symposium on science born of NASA's "A-Train."
The Afternoon Train, or "A-Train," for short, is a constellation of satellites that travel along the same track as they orbit Earth. Four satellites currently fly in the A-Train - Aqua, CloudSat, CALIPSO, and Aura. Three more satellites -- Glory, GCOM-W1, and OCO-2 -- are scheduled to join the configuration in 2011, 2012, and 2013, respectively.
This page features a selection of some of the A-Train's "greatest hits" gathered into two sections. The first contains overview materials giving a big-picture look of the A-Train and NASA satellites. The second section contains mostly visualizations featuring a single instrument or instruments on A-Train satellites. (For the purposes of this page, each visual has been labeled with the A-Train data set it was produced from, but keep in mind, visuals are often the product of many data sets from many different satellites.)
For more about A-Train constellation science, visit: http://atrain.gsfc.nasa.gov/
And for more information on the symposium: http://a-train-neworleans2010.larc.nasa.gov/
Overview videos
- ID: 3437 Visualization
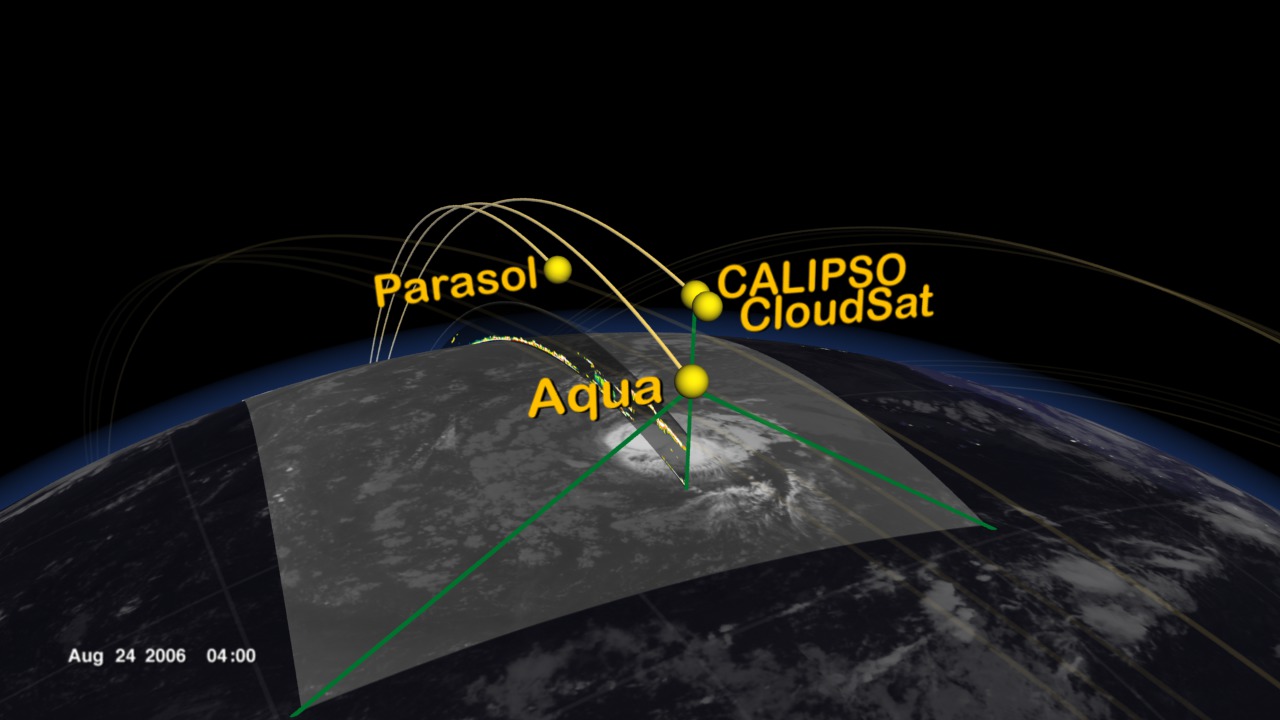
The A-Train Observes Tropical Storm Debby
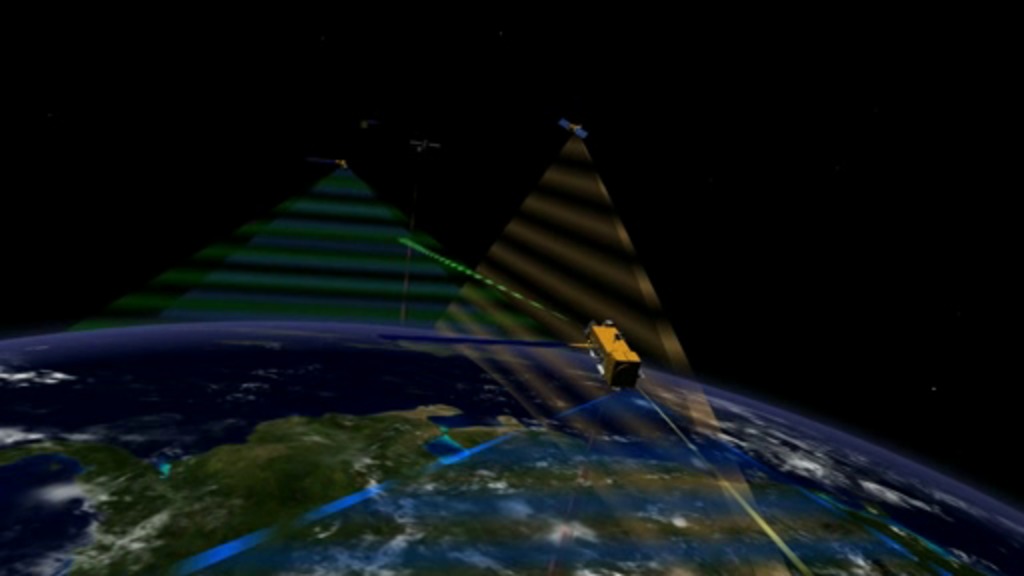
Go to this pageThe A-Train is a group of spacecraft flying in close formation allowing data taken by each instrument to be correlated to the other instruments providing data synergy. The A-Train includes Aqua, CloudSat, CALIPSO, Parasol, and Aura. The animation begins showing the Earth with moving clouds and with a day/night terminator. Time slows down, and A-train spacecraft orbits are added during a daytime pass. The orbits progress around the globe for 12 hours. During a night time pass the camera zooms into Tropical Storm Debby as the A-train flies over on August 24, 2006. Data sets from some of the A-train's spacecraft/instruments are shown including Aqua/MODIS, CloudSat, CALIPSO, and Aqua/AIRS. This visualization was created to support an A-Train session at the 2007 International Geoscience and Remote Sensing Symposium (IGARSS). ||
- ID: 3763 Visualization
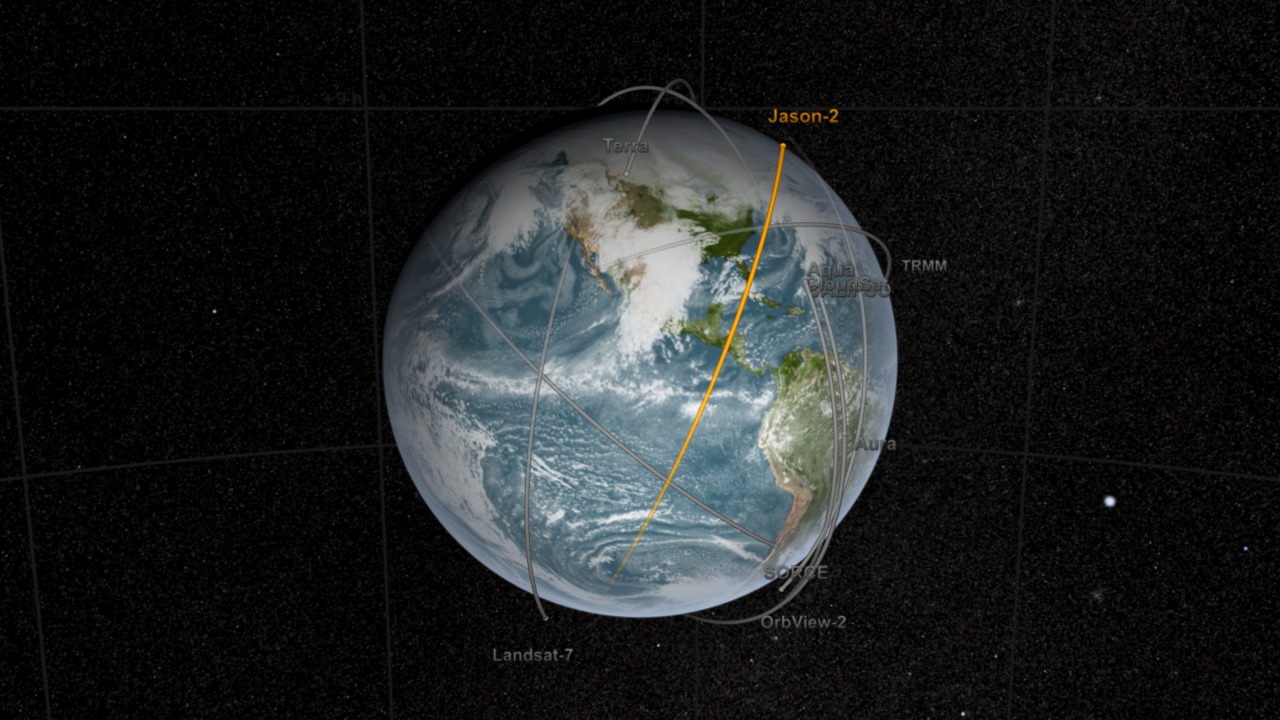
NASA's Orbiting Earth Observing Fleet (NASM 2010)
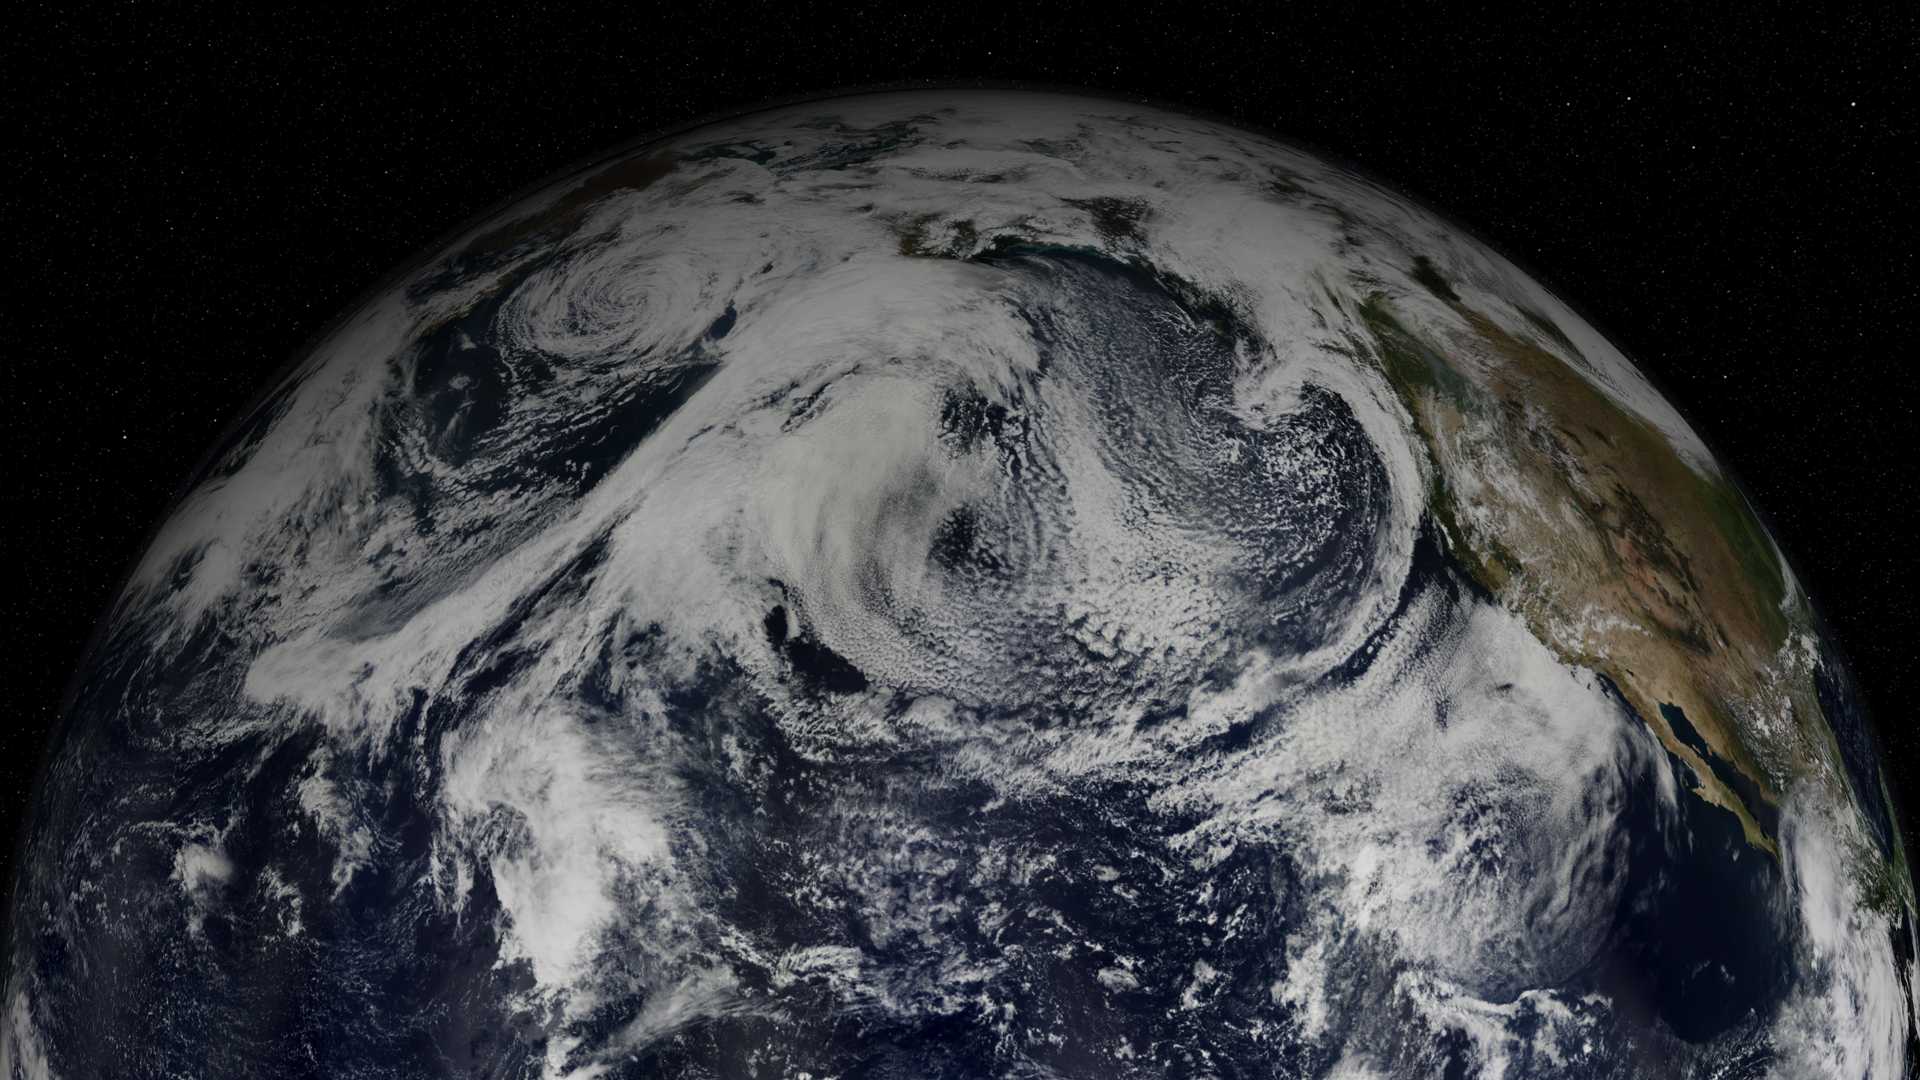
Go to this pageNASA's Earth Observing fleet of vehicles constitutes a major milestone in the history of Earth science, facilitating the kinds of wide scale and synergistic research endeavors that until the last decade have been impossible to even consider. Many of the techniques being employed around Earth are a direct offshoot of technological and scientific techniques developed on missions to other worlds. NASA's continued commitment to primary research about our home remains a top priority not only to the agency, but to the nation, and the world as a whole. This visualization shows the spacecraft in NASA's Earth Observing fleet. The relative altitudes, speeds, sun position, and clouds are correct during a portion of February 2010.This version of the orbital fleet was created for a talk by Piers Sellers at the National Air and Space Museum. About half-way through this visualization, the spacecraft that are beyond their designed lifetimes are faded to gray. The only spacraft still within its designed lifetime when this visualization was created was Jason-2. ||
- ID: 3436 Visualization
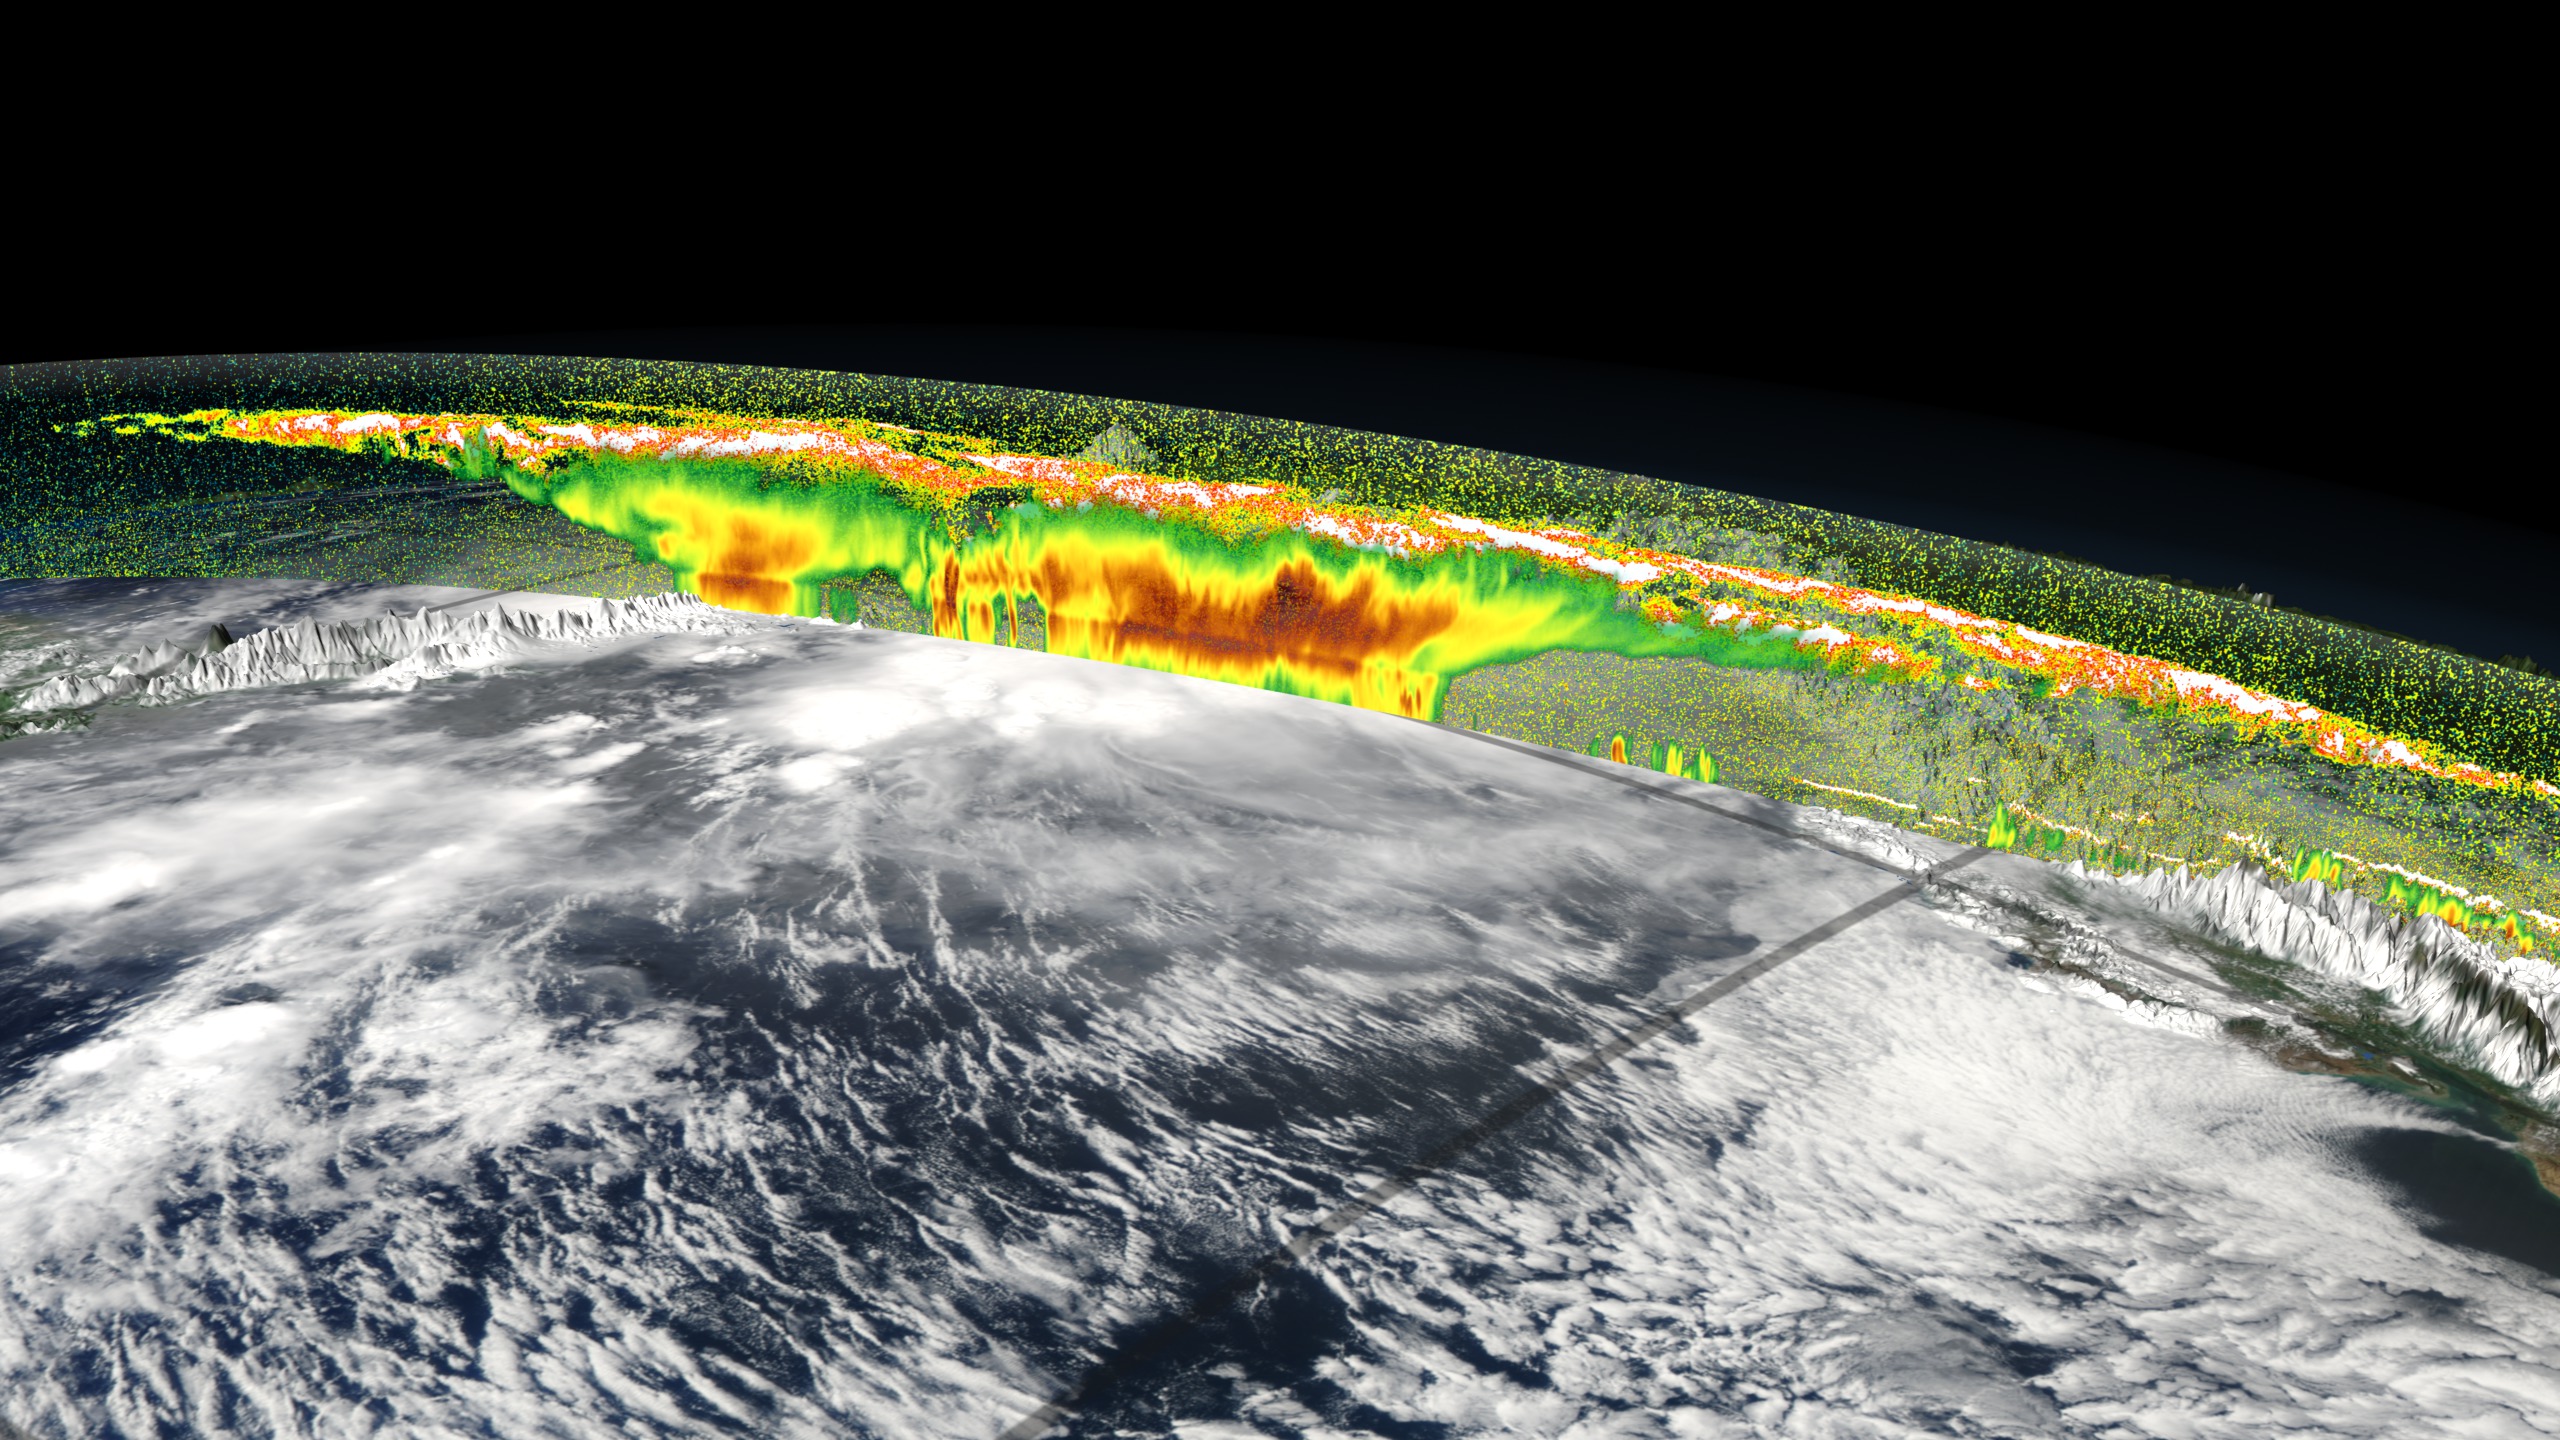
CloudSat, Calipso and MODIS over Central America
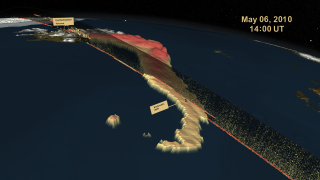
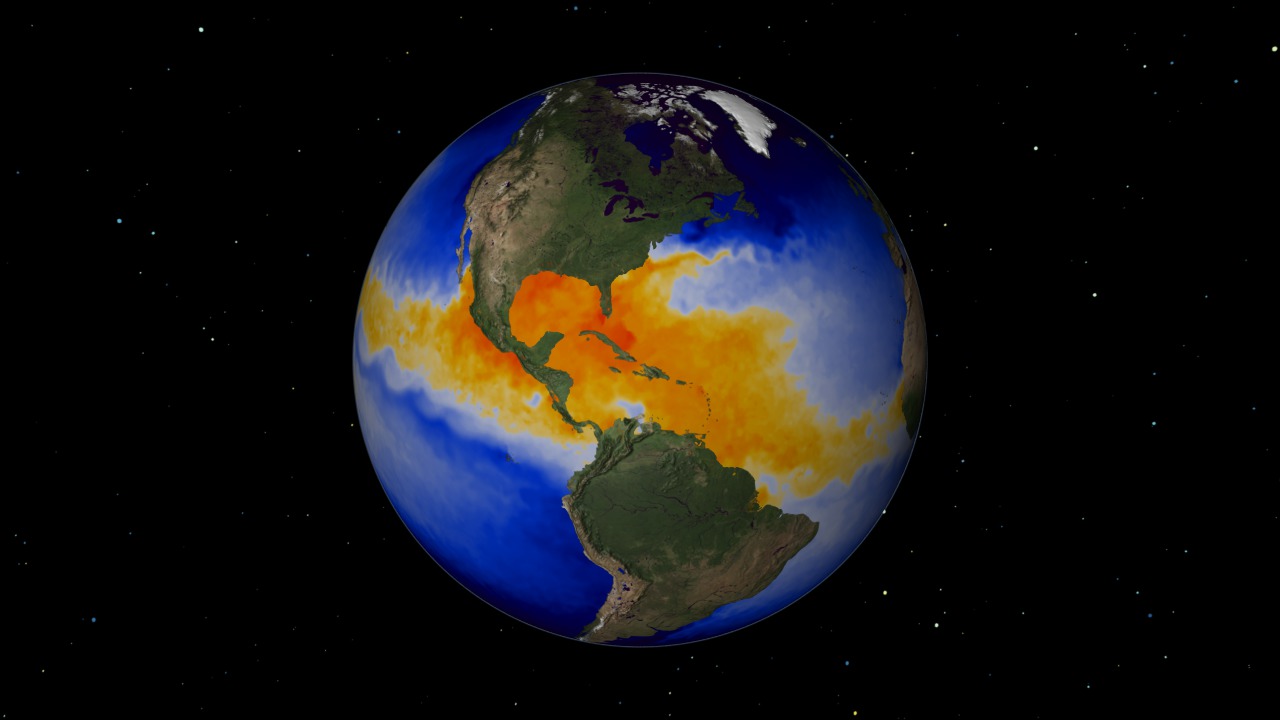
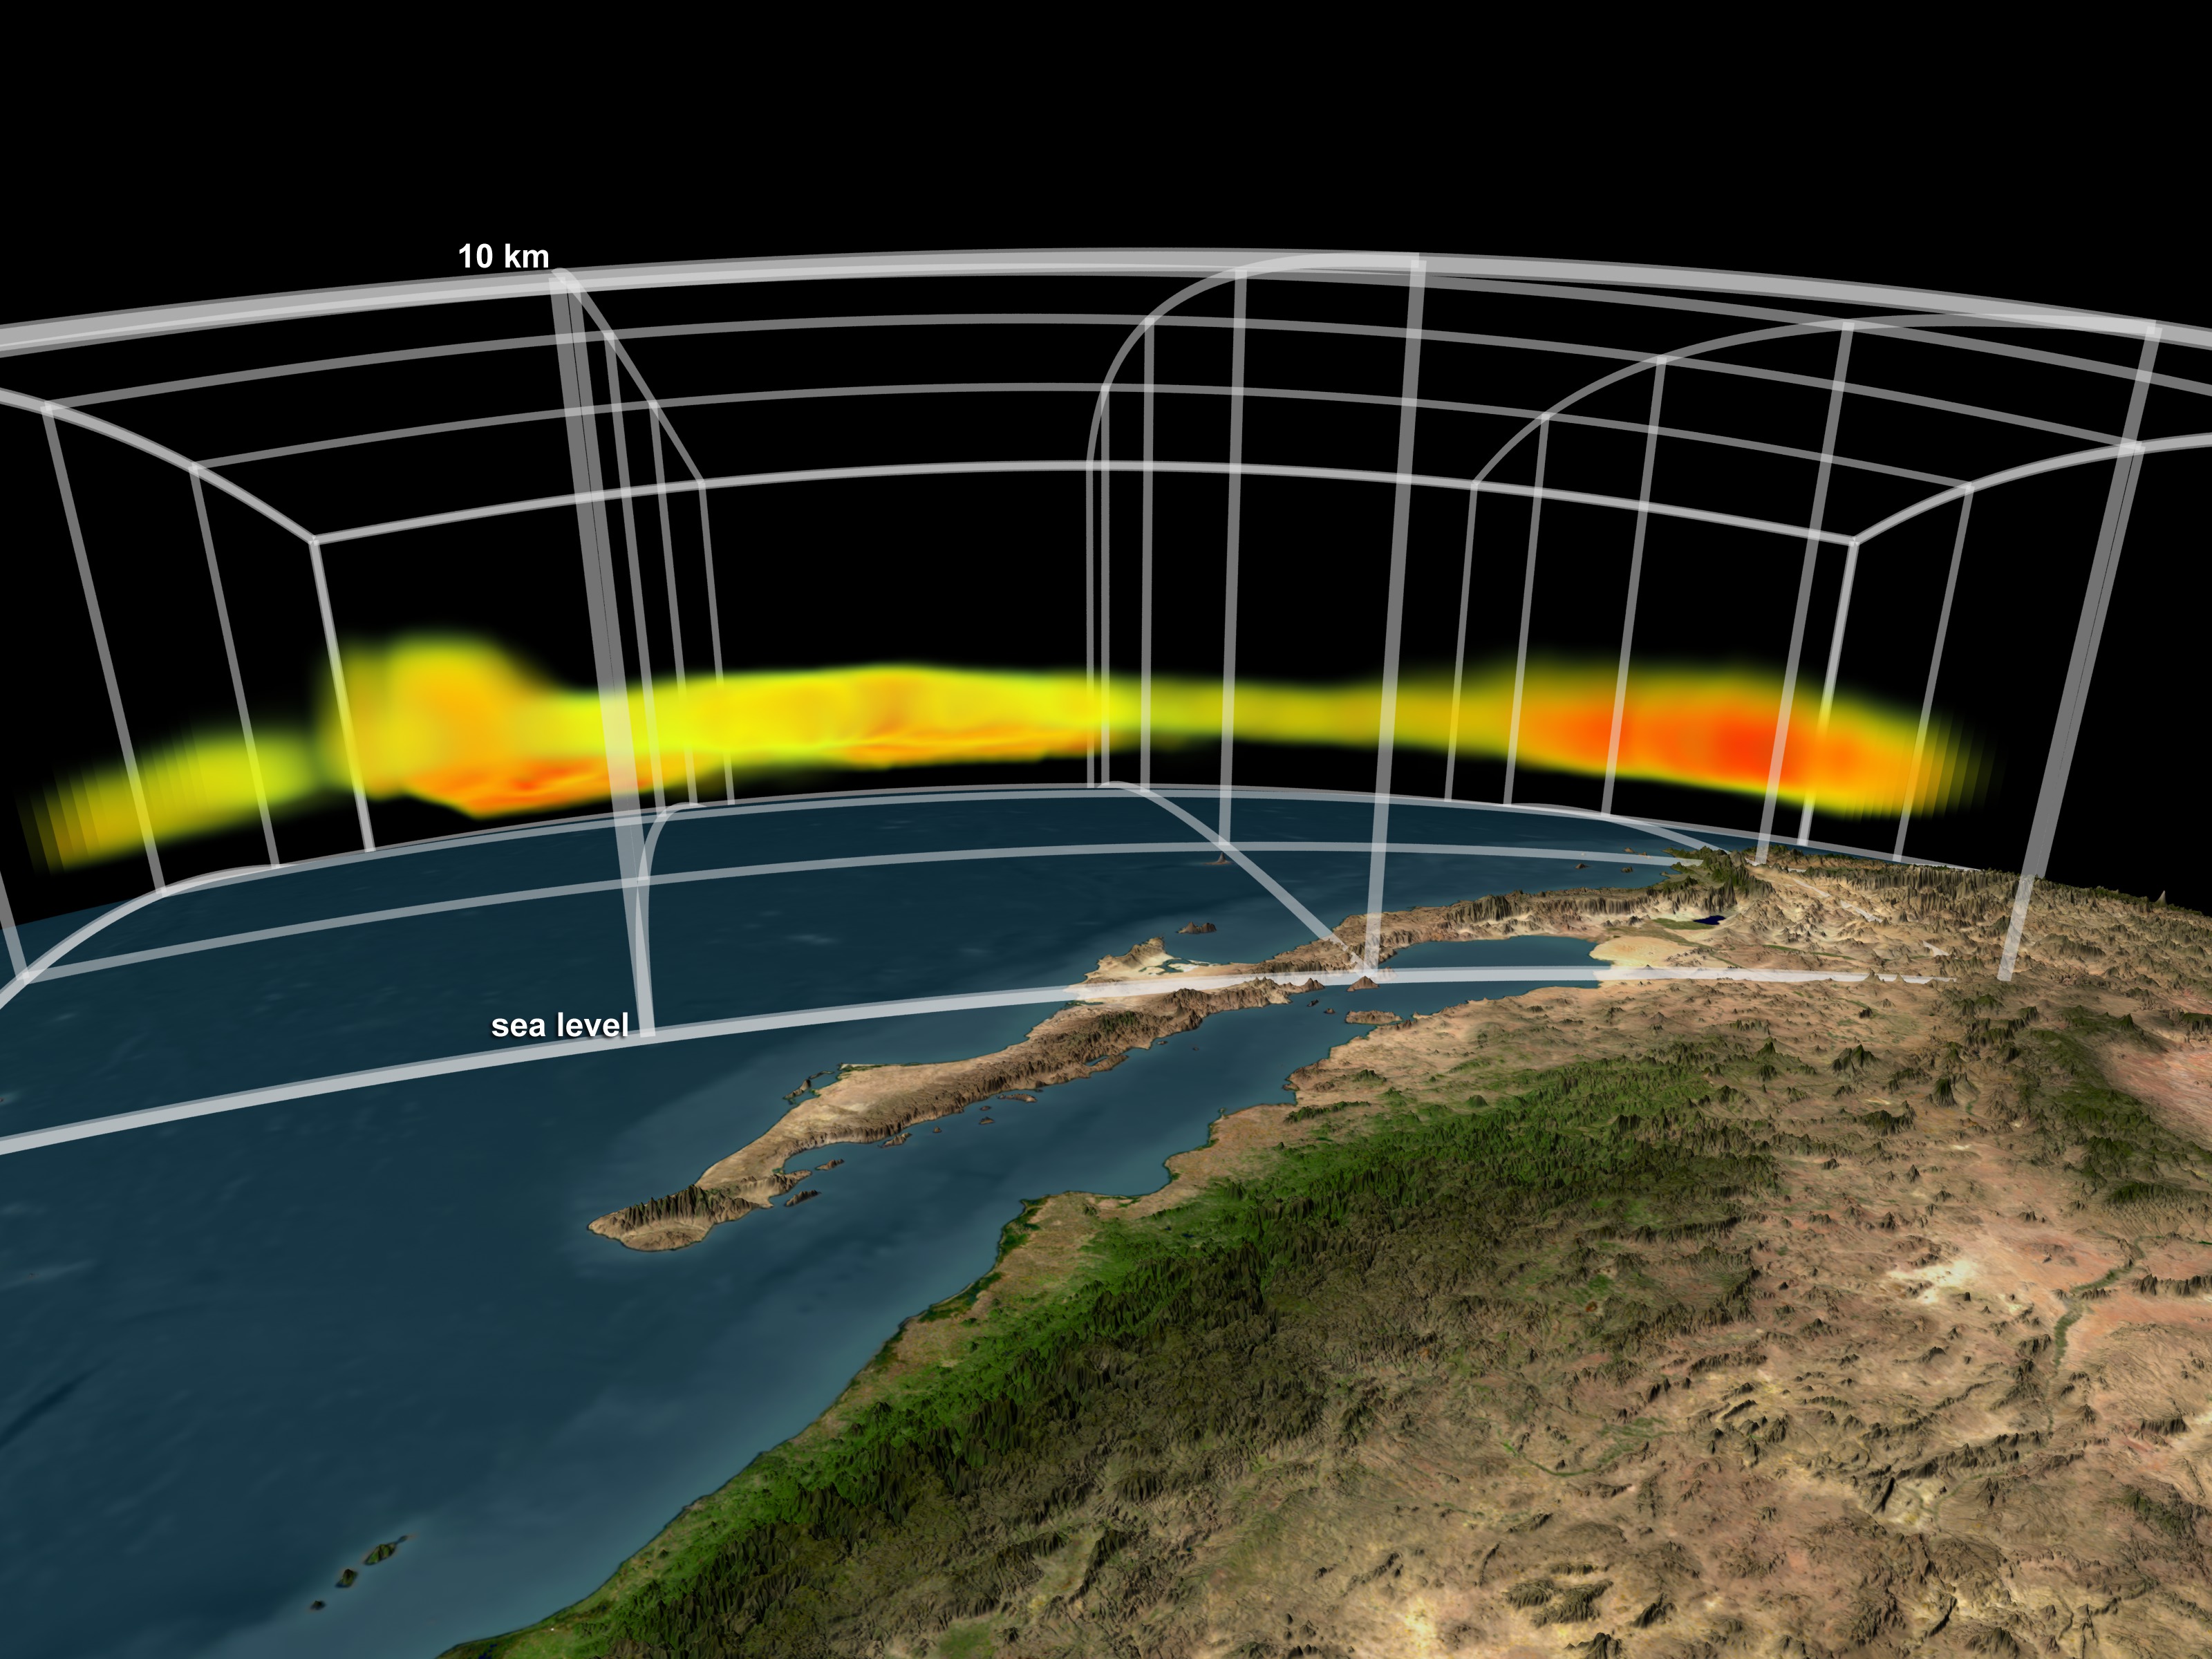
Go to this pageAssociated with tropical thunderstorms are broad fields of cirrus clouds that flow out of the tops of the vigorous storm systems that form over warm tropical oceans. These clouds play a role in how much infrared energy is trapped in Earth's atmosphere. NASA's Tropical Composition, Cloud and Climate Coupling (TC4) mission, which runs from July 16, 2007 through August 8, 2007, aims to document the full lifecycle of these clouds. Observations from four A-Train satellites flying in formation will complement the aircraft measurements with large-scale views of many different features of the atmosphere. Observations from this mission along with previous studies will improve our understanding of what effect a warming climate with rising ocean temperatures will have on these cloud systems. These images over Central America, produced in support of the TC4 mission, show a tropical storm system over Central and South America on August 2, 2006 as measured from multiple satellite sensors, including Aqua MODIS, CloudSat and CALIPSO. In this view from the Pacific Ocean, Panama is on the left and South America is shown on the right. In the following series of still images, each satellite's measurement is shown individually and in combination with the others from the same camera viewpoint. The profile showing CloudSat and CALIPSO data is truncated at a height of twenty kilometers and exaggerated ten times. The land topography is also exaggerated by a factor of ten. ||
- ID: 10340 Produced Video
Cross Calibration of the Afternoon Constellation's Instruments
Go to this pageThe name "A-Train" comes from the formation of international, Earth-observing satellites known as the Afternoon Constellation, which operate in a Sun-synchronous orbit at an altitude of 705 km. The close proximity of the different spacecraft within the A-Train allows for coincident observations between instruments on different spacecrafts, providing scientists additional capabilities in their pursuit of answers about the Earth and its climate. Upon joining the A-train, Glory will help researchers better understand two critical forcings of Earth's climate: atmospheric aerosols and total solar irradiance. ||
- ID: 3348 Visualization

Aqua Satellite and MODIS Swath
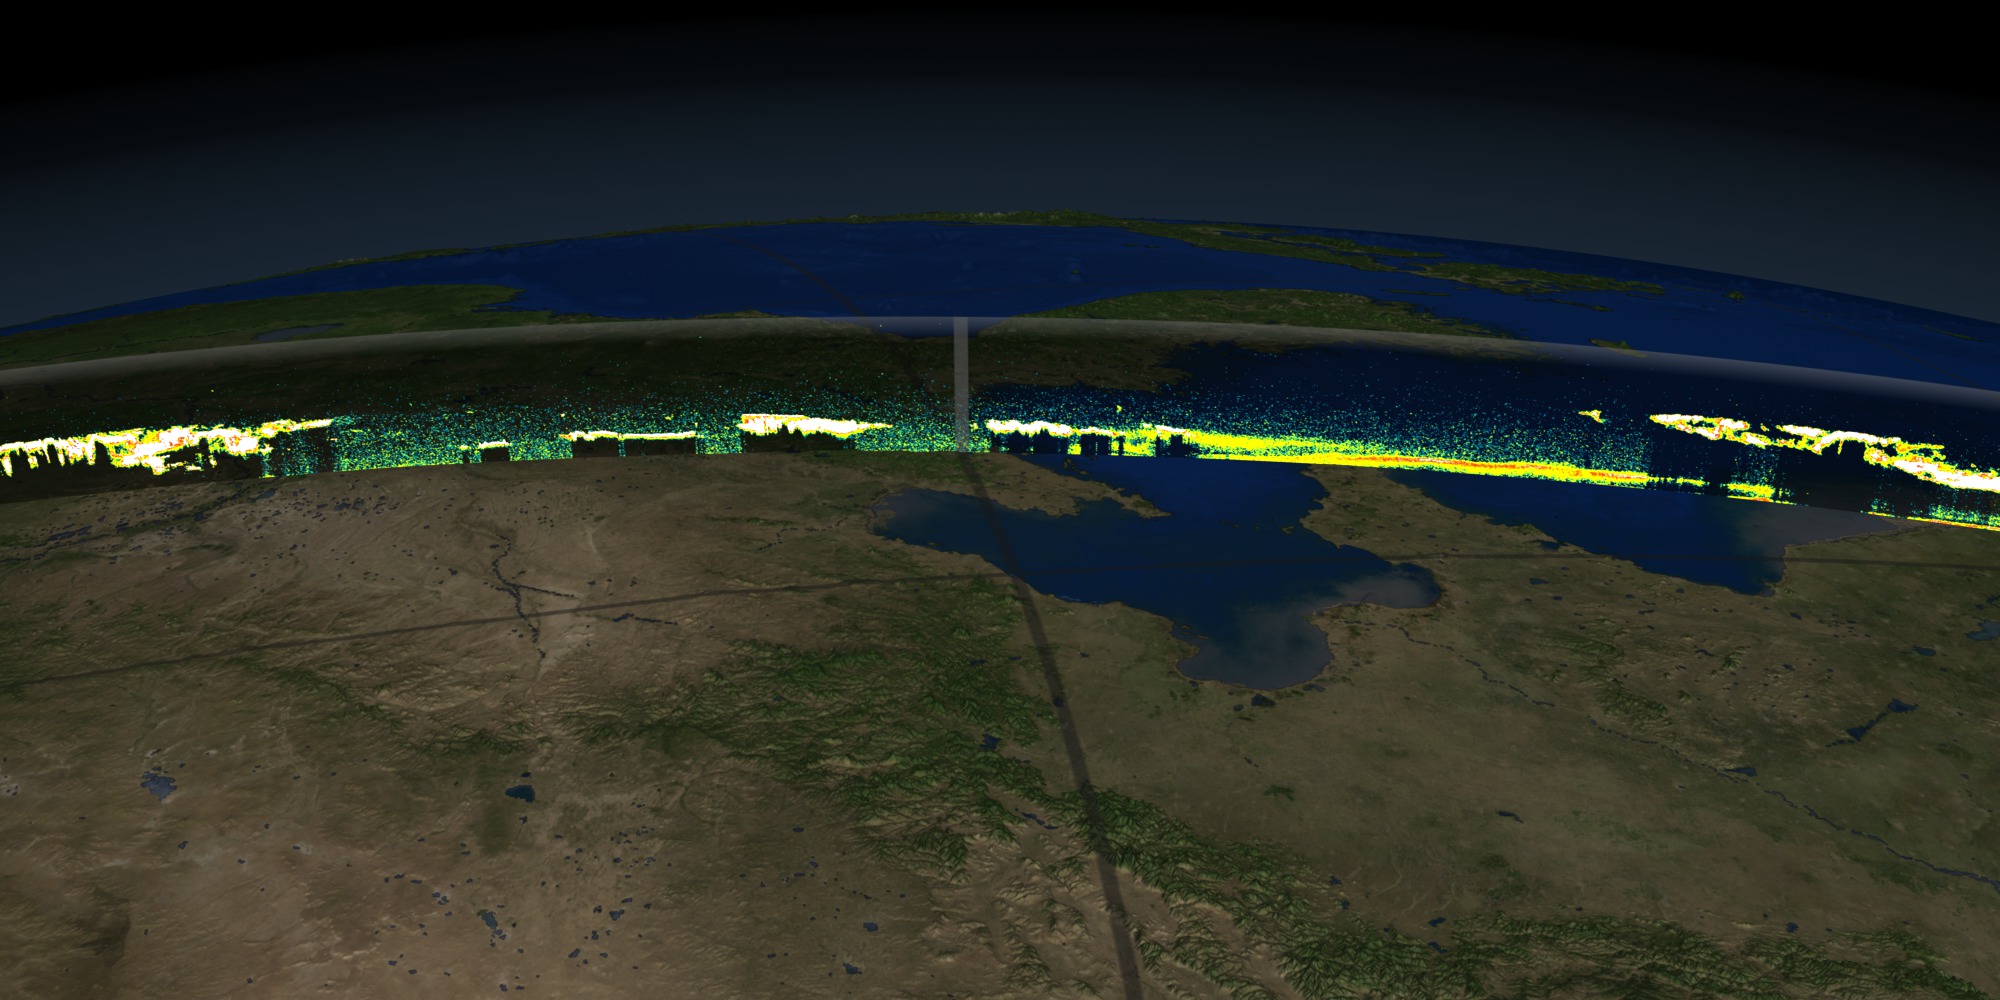
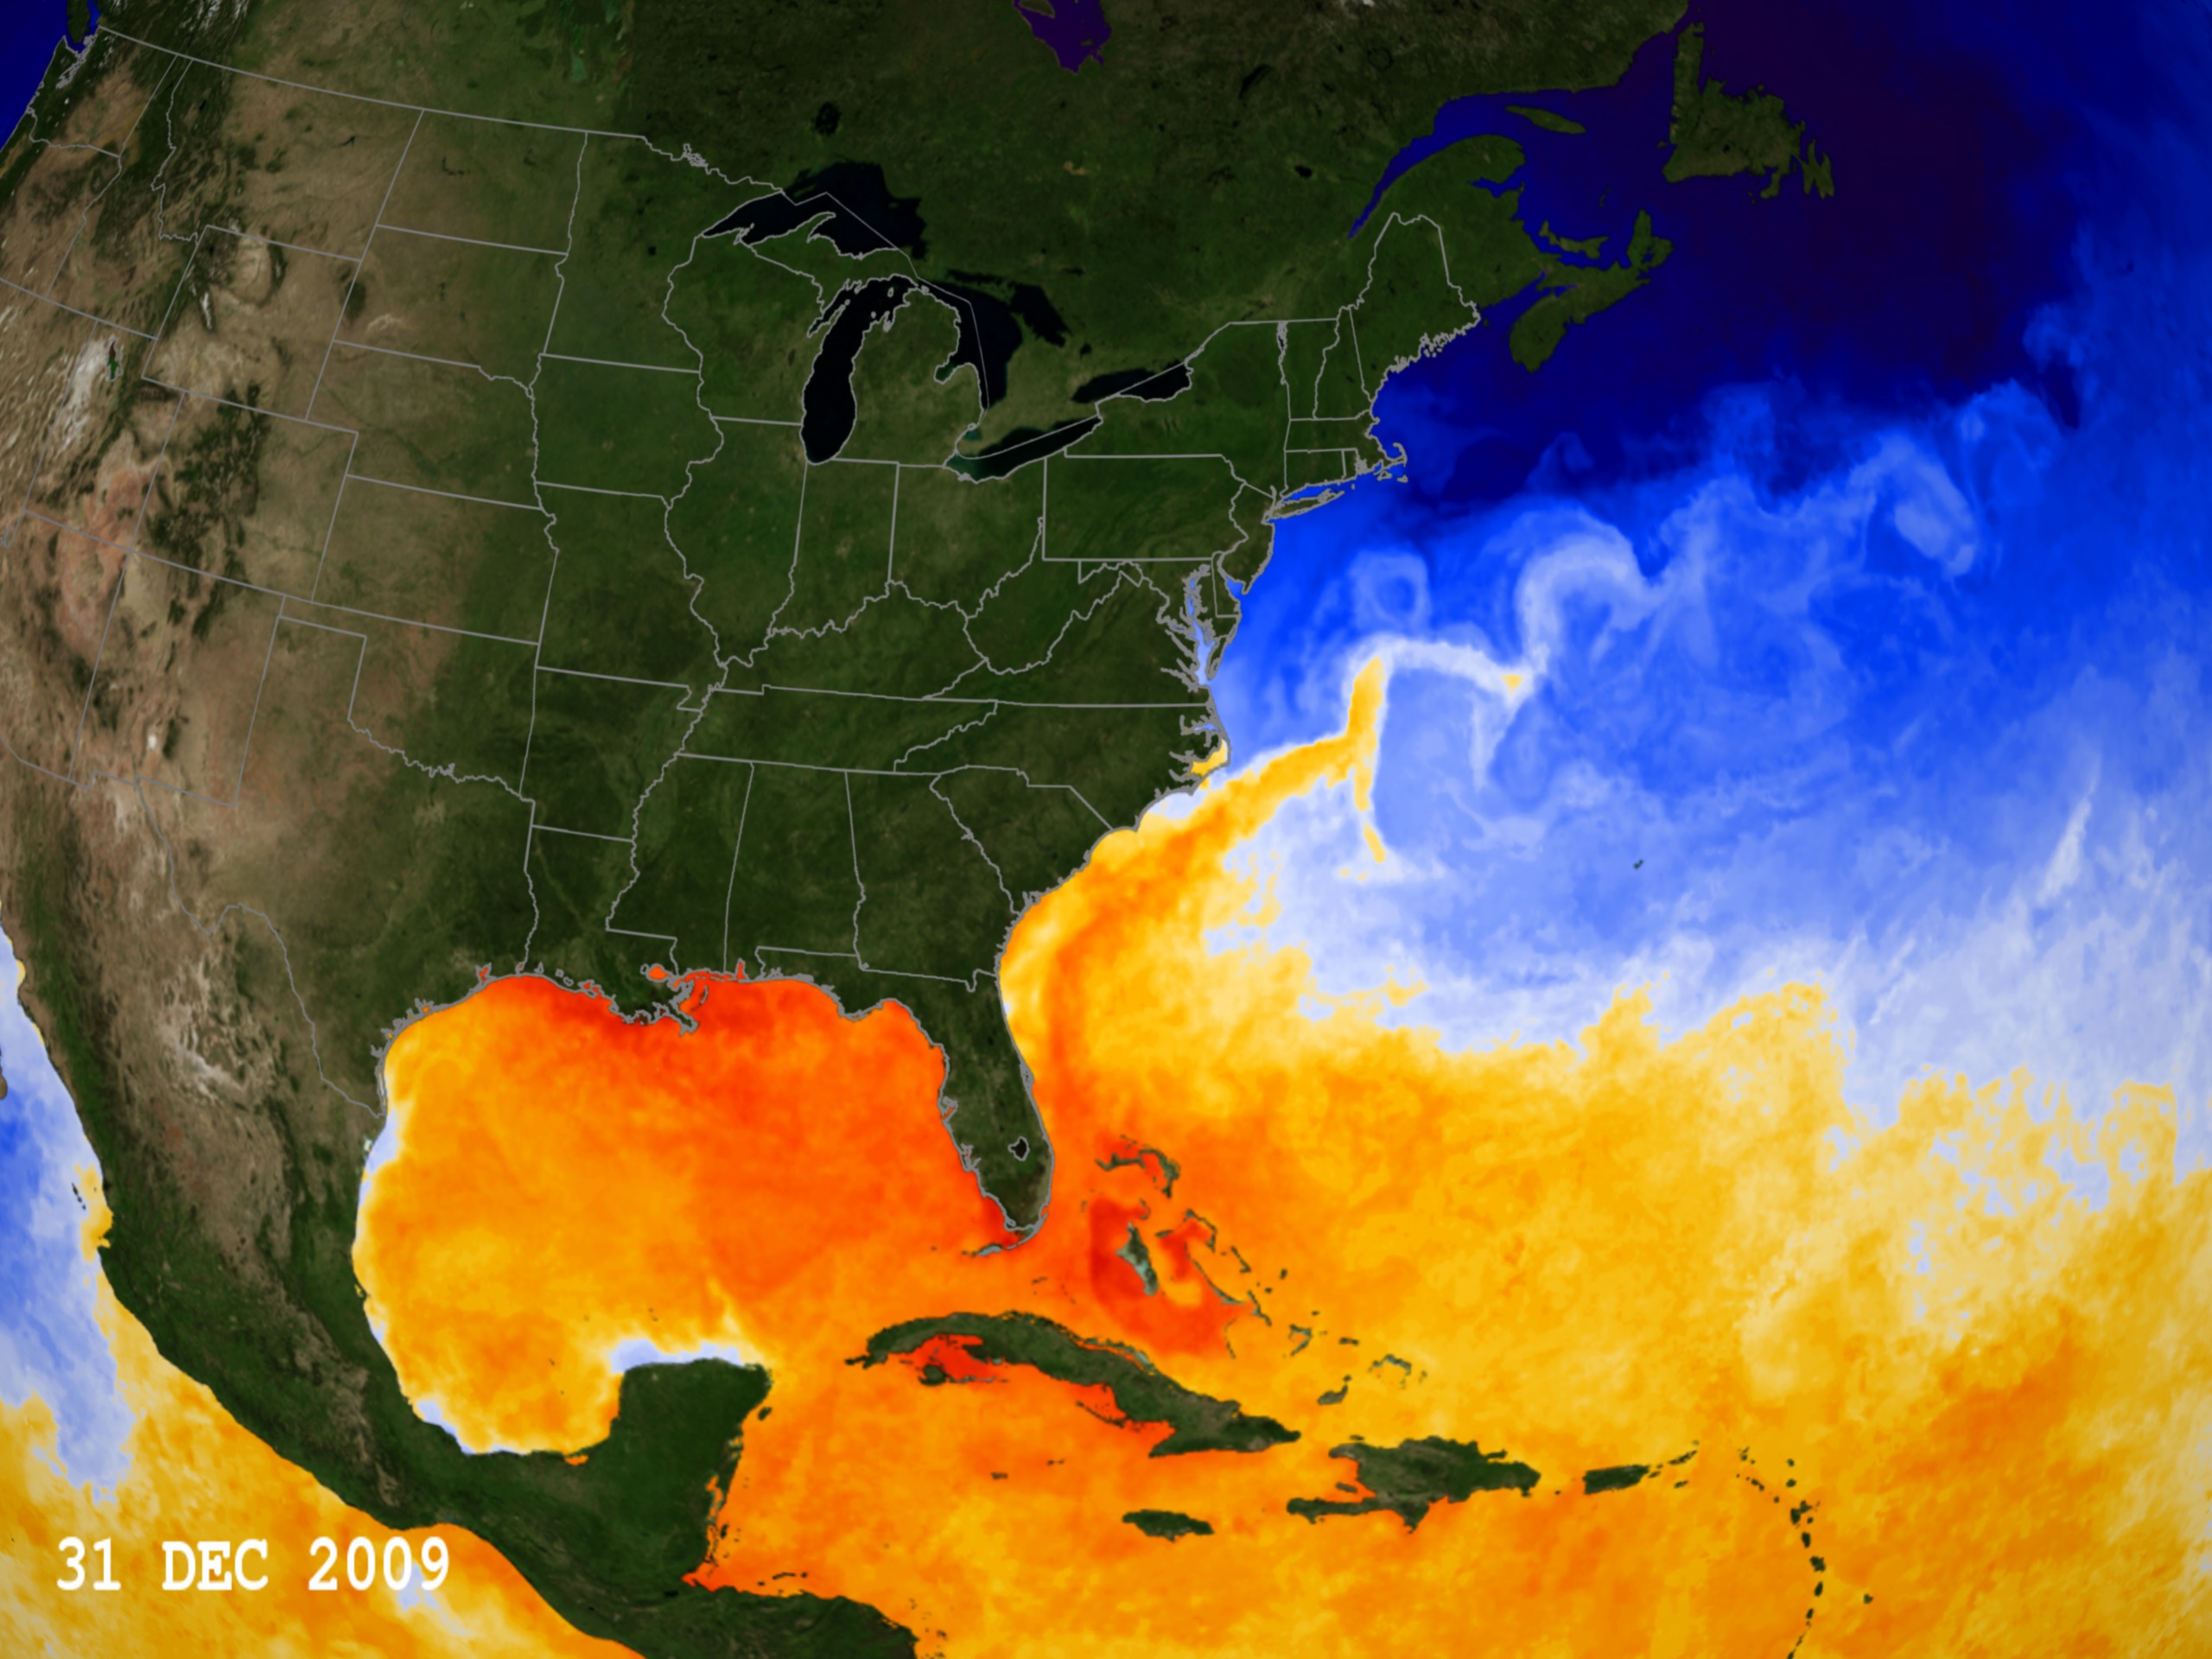
Go to this pageNASA's Aqua satellite was launched on May 4, 2002 with six Earth-observing instruments on board. Aqua circles the Earth every 99 minutes and is in a polar orbit, passing within ten degrees of each pole on every orbit. The orbit is sun-synchronous, meaning that the satellite always passes over a particular part of the Earth at about the same local time each day. Aqua always crosses the equator from south to north at about 1:30 PM local time. One of the instruments on Aqua, MODIS, measures 36 spectral frequencies of light reflected off the Earth in a 2300-kilometer wide swath along this orbit, so that MODIS measures almost the entire surface of the Earth every day.The first animation shows the Aqua satellite orbiting for one day, August 27, 2005, showing a set of MODIS measurements taken that day that have been processed to look like a a true-color image of the Earth. Notice that MODIS only takes data during the dayside part of the orbit because it measures reflected light from the Sun, and that there is a bright band of reflected sunlight in the center of swaths over the ocean. Also visible in this animation are Hurricane Katrina, just to the west of Florida in the Gulf of Mexico, and Typhoon Talim, in the western Pacific between Japan and New Guinea.The second animation spans five days of Aqua orbits, from August 27, 2005 through August 31, 2005. For this animation, the orbits and data are shown over an Earth image that shows the day and night parts of the Earth at each time of the animation. The daylight part of the Earth is a cloud-free MODIS composite, while the nighttime regions show the 'city lights', the Earth's stable light sources. During the first day, August 27, the Aqua satellite is shown with a red line indicating the orbit of the satellite. Since the Earth's surface is stationary in this animation, the satellite orbit moves westward with the sun. During the second day, August 28, the most recent observation swath is shown in addition to the satellite orbit line. In this way , the drift of th orbit relative to the observations is illustrated. Starting with the third day, August 29, the orbit line disappears and the observation swaths accumulate. The observations cover the Earth during the third day except for small gaps at the equator, which are filled in during the fourth day, August 30. The animation continues to show the MODIS observations through August 31, the fifth day.The third animation shows the same composition as the second one, but the point of view has changed to that of the Sun. In this animation, the Earth rotates and the orbit is stationary. At this date, the North Pole of the Earth is tilted towards the Sun and in daylight, while the South Pole is tilted away and is in darkness. ||

Data-driven visuals
- ID: 3783
- ID: 3757

- ID: 3586
- ID: 3685
- ID: 3767
 Visualization
 - ID: 3390
 Visualization
 - ID: 3256
 Visualization
 - ID: 3129
 Visualization
 - ID: 3365
 Visualization
 - ID: 3532
- ID: 3667
 Visualization
 - ID: 3737
 Visualization
Data Interfaces
 Link
LinkGiovanni
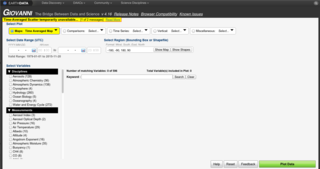
Giovanni is a Web-based application developed by the GES DISC that provides a simple and intuitive way to visualize, analyze, and access vast amounts of Earth science remote sensing data without having to download the data.
Go to this link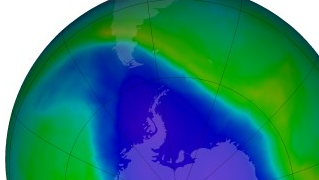 Link
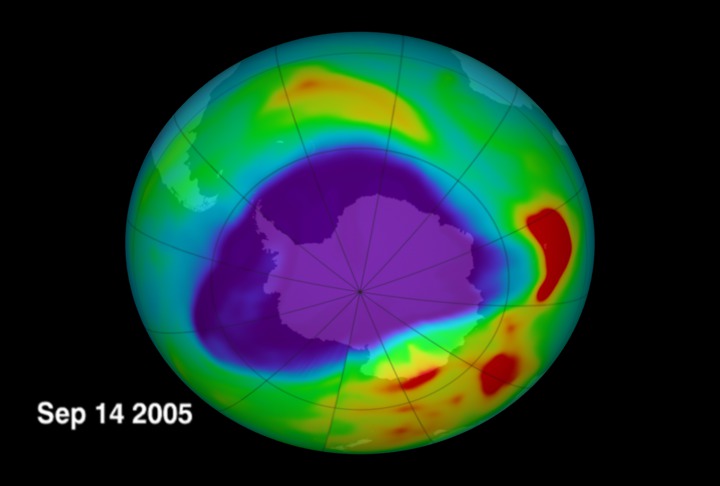
LinkOzone Watch
The Ozone Watch website shows a daily image of the Antarctic ozone hole.
Go to this link Link
LinkMODIS Rapid Response System
The MODIS Rapid Response System provides daily satellite images of the Earth's landmasses in near real time using data.
Go to this link