A Rotating False Color View of the Martian South Pole from MOLA: New Color Map
This is one of a series of visualizations showing false-colored renderings of the Martian topography measured by MOLA in the vicinity of the Mars Polar Lander landing site.
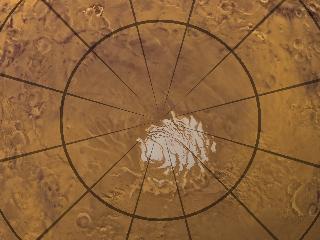
A rotating view of the Martian south pole using MOLA topography data. This animation uses a color table designed to highlight the topography at the south pole. White colors indicate elevations in excess of 3012 meters, red shows elevations between 2500 and 3012 meters, yellow shows elevations from 2450 to 2500 meters, dark cyan shows elevations from 2150 to 2450 meters, dark violet shows elevations from 320 to 2150 meters.

False color image of Mars from MOLA data, using a color map designed to emphasize south pole topography. White colors indicate elevations in excess of 3012 meters, red shows elevations between 2500 and 3012 meters, yellow shows elevations from 2450 to 2500 meters, dark cyan shows elevations from 2150 to 2450 meters, dark violet shows elevations from 320 to 2150 meters.
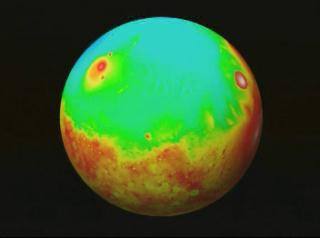
False color image of the southern hemisphere of Mars from MOLA data, using a color map designed to emphasize south pole topography. White colors indicate elevations in excess of 3012 meters, red shows elevations between 2500 and 3012 meters, yellow shows elevations from 2450 to 2500 meters, dark cyan shows elevations from 2150 to 2450 meters, dark violet shows elevations from 320 to 2150 meters.
For More Information
Credits
Please give credit for this item to:
NASA/Goddard Space Flight Center
Scientific Visualization Studio
-
Animators
- Tom Biddlecome (Raytheon)
-
Greg Shirah
(NASA/GSFC)

-
Scientist
- David Smith (NASA/GSFC)
Missions
This page is related to the following missions:Series
This page can be found in the following series:Datasets used
-
Topography [MGS: MOLA]
ID: 352
Note: While we identify the data sets used on this page, we do not store any further details, nor the data sets themselves on our site.
Alternate Versions
- ID: 769
 Visualization
 - ID: 770
Release date
This page was originally published on Monday, November 22, 1999.
This page was last updated on Wednesday, May 3, 2023 at 1:58 PM EDT.