Smoke from Record-Breaking Wildfires in Spain and France
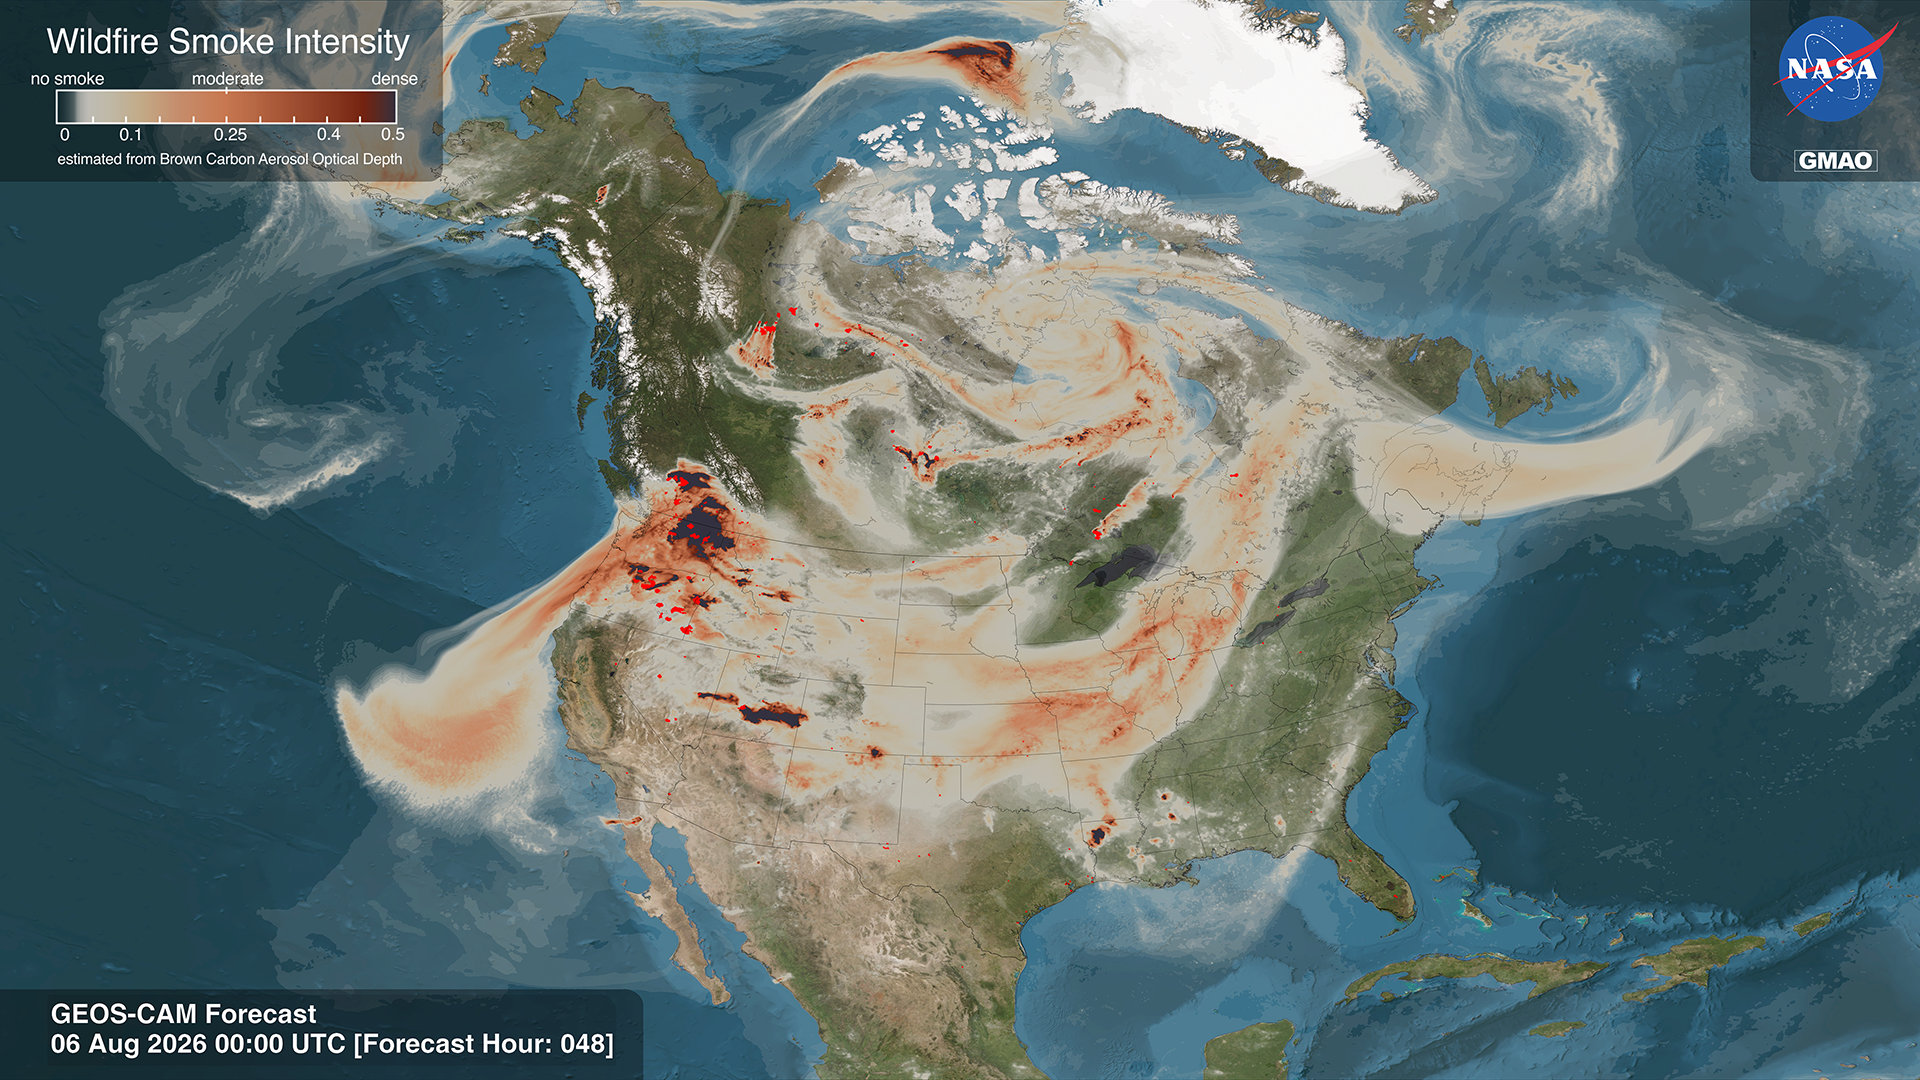
This visualization reveals the transport of smoke from the wildfires in Spain and France during July 2026. Tan to deep red colors represent Wildfire Smoke Intensity estimated by Brown Carbon Aerosol Optical Depth (AOD) from NASA's Goddard Earth Observing System Convection Allowing Model (GEOS-CAM), a 2km replay to the analysis from GEOS Forward Processing, developed by the Global Modeling and Assimilation Office (GMAO).
Extremely hot and dry conditions were prevalent across Europe and North America during June and July, which primed the land surface for dangerous wildfire conditions, in addition to the vast societal impacts from heat waves. Wildfires emit thick blankets of smoke containing toxic gases and fine particulate matter (PM2.5). PM2.5 aerosols are small enough to penetrate the lungs and enter the blood stream, thereby inducing and exacerbating pulmonary and cardiovascular health impacts. Though concentrations of PM2.5 are highest close to the wildfire source, smoke can travel thousands of miles to impact the air quality elsewhere. Although research has demonstrated that the overall number of wildfires has been decreasing globally, wildfires are becoming more intense in North America and Europe.
Models such as the Goddard Earth Observing System (GEOS), which blend meteorological observations with a numerical weather prediction model, are valuable tools for understanding and predicting where wildfire smoke will travel. The wildfire smoke intensity visualization uses the aerosol optical depth (AOD) from brown carbon within a high-resolution version of the GEOS model to demonstrate the local and remote impacts of smoke over Europe in late July 2026. AOD provides an indication of how much smoke is in the air. A brown color in the visualization indicates high values of AOD, and therefore denser plumes of smoke.
The western European region had already experienced intrusions of Saharan dust in late June, which reduced air quality and gave the skies a reddish hue. As seen in the visualization, smoke from Canadian wildfires reached Europe but unprecedented wildfires in Spain and France generated dense plumes of smoke with profound impacts on air quality within the region. Complementing this broad view of smoke transport, two additional visualizations highlight the ground-level impact by tracking the progression of active fire perimeters. Using data from the NASA Fire Event Data Suite (FEDS) these focus specifically on the rapid expansion of the severe blazes near Madrid, Spain, and Bordeaux, France. There were also notable wildfires along the northern coast of Algeria in response to the same weather conditions that impacted Europe. These fires further increased the amount of smoke over the Mediterranean.
This visualization shows the progression of fires near Bordeaux, France, from July 14–29, 2026, highlighting the rapid spread of wildfires near Bordeaux, France. The visualization uses fire perimeter data from the NASA Fire Event Data Suite (FEDS), which is constructed using VIIRS active fire detections from the Suomi-NPP, NOAA-20, and NOAA-21 satellites, provided by FIRMS. Fueled by high winds and low humidity, this time series highlights the often episodic nature of fire spread, where initial ignitions turn into dangerous, fast-moving runs when conditions align.
This visualization shows the progression of fires outside the city of Madrid, Spain, from July 14–28, 2026. The visualization uses fire perimeter data from the NASA Fire Event Data Suite (FEDS), which is constructed using VIIRS active fire detections from the Suomi-NPP, NOAA-20, and NOAA-21 satellites, provided by FIRMS. Fueled by high winds and low humidity, this time series highlights the often episodic nature of fire spread, where initial ignitions turn into dangerous, fast-moving runs when conditions align.

Following the rapid spread of the July 2026 wildfires, this image reveals the resulting burn scar near Bordeaux, France. It uses imagery from the Harmonized Landsat Sentinel-2 (HLS), with data provided by NASA FIRMS, to show the ground-level aftermath of the event.
Following the rapid spread of the July 2026 wildfires, this image reveals the resulting burn scar outside Madrid, Spain. It uses imagery from the Harmonized Landsat Sentinel-2 (HLS), with data provided by NASA FIRMS, to show the ground-level aftermath of the event.
Burn scars outside Madrid, Spain and Bordeaux, France, using imagery from the Harmonized Landsat Sentinel-2 (HLS). Data provided by NASA FIRMS, to show the ground-level aftermath of the event.
Credits
NASA's Scientific Visualization Studio, Global Modeling and Assimilation Office, FEDS and FIRMS
-
Visualizers
-
Helen-Nicole Kostis
(Science and Technology Corporation)

-
Joseph V. Ardizzone
(NASA/GSFC)
-
Zoey N. Armstrong
(Navteca, LLC.)
-
Helen-Nicole Kostis
(Science and Technology Corporation)
-
Scientists
-
Allison Collow
(University of Maryland Baltimore County)
-
Elijah Orland
(University of Maryland Baltimore County)
-
Tempest McCabe
(University of Maryland)
-
Doug C. Morton
(NASA/GSFC)
- Melanie Follette-Cook (NASA)
-
Allison Collow
(University of Maryland Baltimore County)
-
Technologist
- Zeb Becker (University of Maryland)
-
Support
- Ella Kaplan (ADNET Systems, Inc.)
-
Eric Sokolowsky
(ADNET Systems, Inc.)
- Laurence Schuler (ADNET Systems, Inc.)
- Ian Jones (ADNET Systems, Inc.)
Datasets used
-
GEOS-CAM (Goddard Earth Observing System Convection-Allowing Model framework)
ID: 1290Credit: NASA Global Modeling Assimilation Office (GMAO)
See all pages that use this dataset -
GEOS-FP 2Km Replay (GEOS Forward Processing 2Km Replay)
ID: 1258 -
FEDS (Fire Events Data Suite) [NOAA-20 and SUOMI-NPP: VIIRS]
ID: 1247Credit: Tempest McCabe, Douglas Morton, Melanie Follette-Cook, Elijah Orland, Zeb Becker, Yang Chen, Rebecca Scholten, Greg Corradini, Julia Signel, Alexey Shiklomanov, Kateria Sheronin, and Jim Randerson
This dataset can be found at: https://earth-information-system.github.io/fireatlas/docs/nrt.html
See all pages that use this dataset -
BMNG (Blue Marble: Next Generation) [Terra and Aqua: MODIS]
ID: 508Credit: The Blue Marble data is courtesy of Reto Stockli (NASA/GSFC).
This dataset can be found at: http://earthobservatory.nasa.gov/Newsroom/BlueMarble/
See all pages that use this dataset
Note: While we identify the data sets used on this page, we do not store any further details, nor the data sets themselves on our site.
Related
- ID: 5668
- ID: 5665

- ID: 5664

- ID: 5639

- ID: 5624
 Visualization
 - ID: 5631

- ID: 5601
 Visualization
 - ID: 5598
 Visualization
 - ID: 5597

- ID: 5594

- ID: 14894
 Produced Video
 - ID: 5557

- ID: 5568
 Visualization
 - ID: 5558

- ID: 14606
![Full 8K resolution. Optimized for Earth Information Center display.
Music credit: "Magical Moments by Liam Joseph Hennessy [ PRS ]" and “Strategy Meeting by Brice Davoli [ SACEM ]” from Universal Production MusicThis video can be freely shared and downloaded at https://svs.gsfc.nasa.gov/14606. While the video in its entirety can be shared without permission, the music and some individual imagery may have been obtained through permission and may not be excised or remixed in other products. Specific details on such imagery may be found here: https://svs.gsfc.nasa.gov/14606. For more information on NASA’s media guidelines, visit https://nasa.gov/multimedia/guidelines.](/vis/a010000/a014600/a014606/EIC_NASAandFire_Main_Image_4K.jpg) Produced Video
Produced Video - ID: 5315
 Visualization
Older Versions
Release date
This page was originally published on Thursday, July 30, 2026.
This page was last updated on Tuesday, August 25, 2026 at 3:32 PM EDT.