Long-range Transport of 2026 Canadian Wildfire Smoke into the United States (July 14-20, 2026)
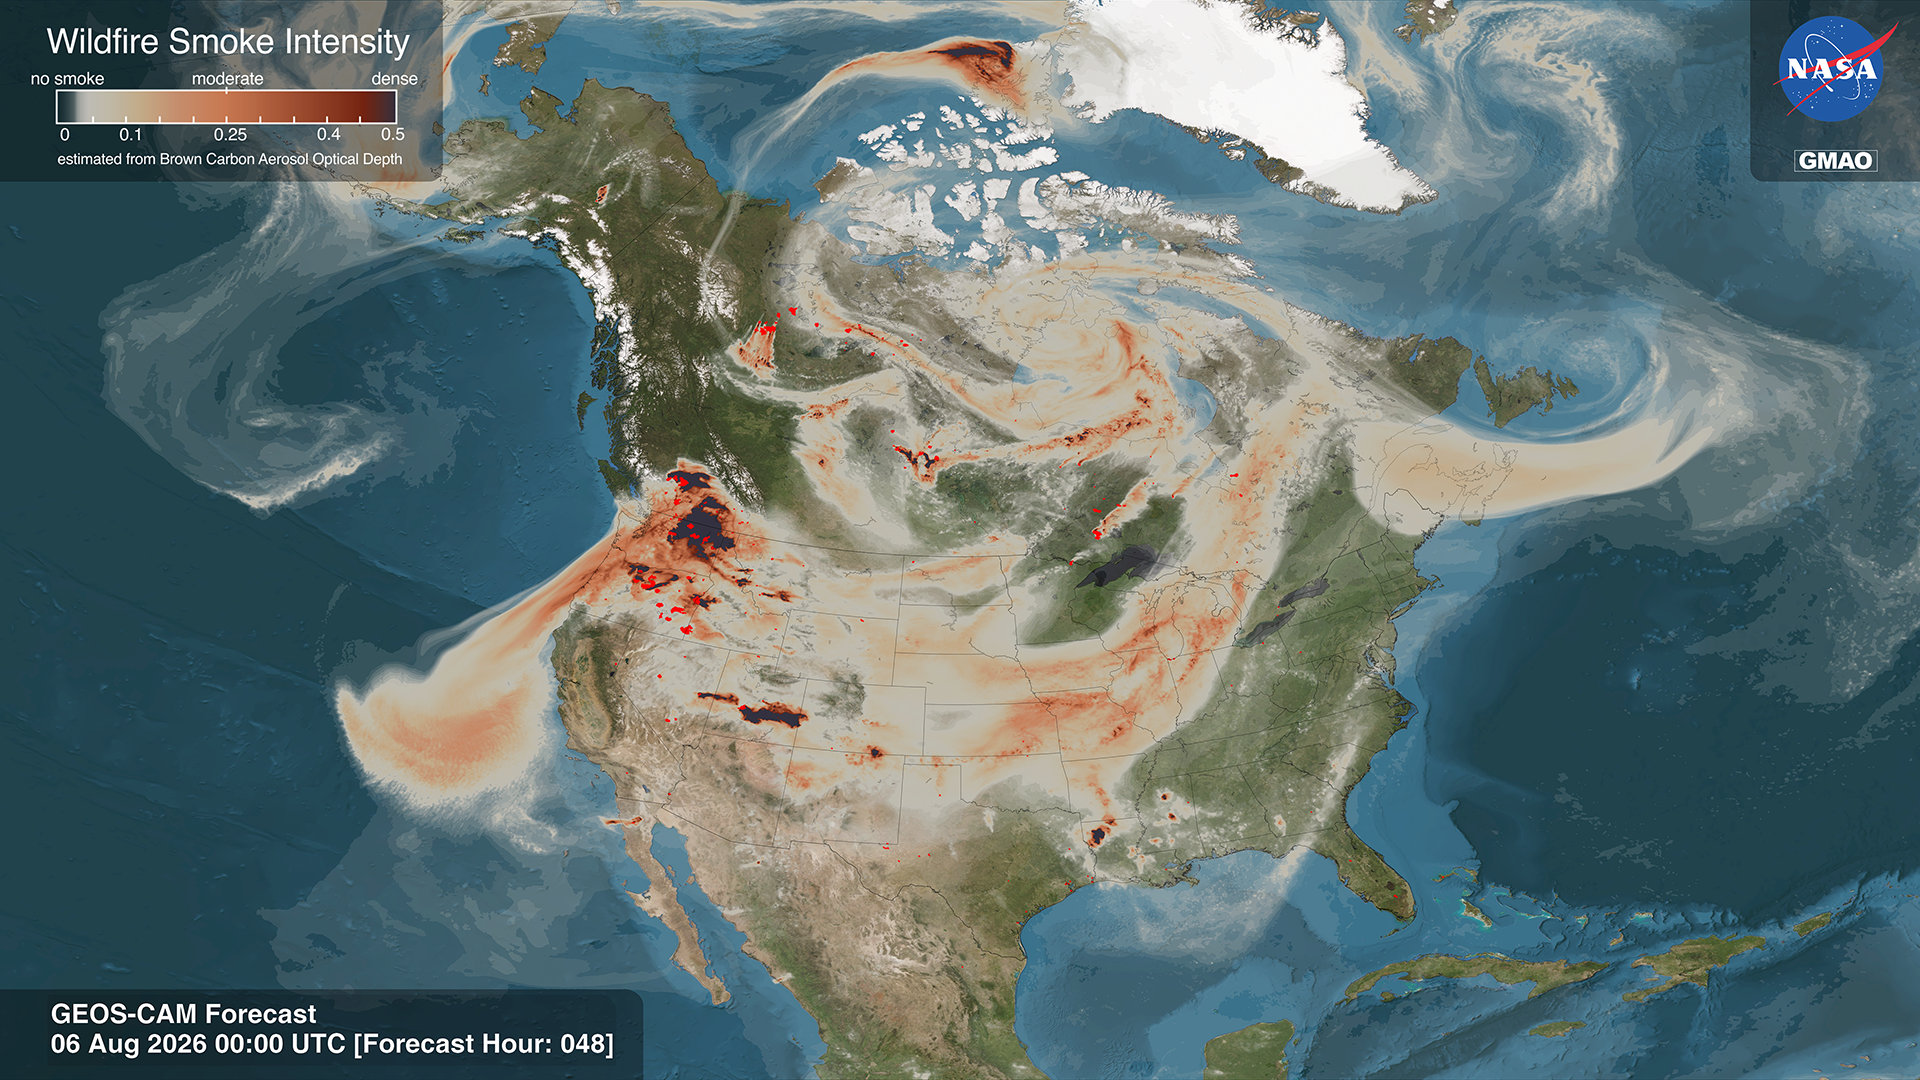
This visualization reveals the dramatic long-range transport of smoke from the Canadian wildfires during July 14-20, 2026. Active fire locations are marked by bright red dots. Tan to deep red colors represent Wildfire Smoke Intensity estimated by Brown Carbon Aerosol Optical Depth from NASA's Goddard Earth Observing System Convection Allowing Model (GEOS-CAM), a 2km replay to the analysis from GEOS Forward Processing, developed by the Global Modeling and Assimilation Office (GMAO). Smoke from wildfires in Canada is seen traveling thousands of miles, blanketing various regions of the United States and causing record-breaking poor air quality.
Despite a slow start to the 2026 biomass burning season across Canada, devastating wildfires erupted in central Canada in mid-July. The same heat dome that impacted the United States created hot and dry conditions over Ontario during the first week in July that primed the land surface for dangerous fire weather conditions. As is typically the case for the region, lightning strikes then ignited wildfires in the drought-ridden area of Ontario. Wildfires release plumes of smoke that contain toxic gases and fine particulate matter (PM2.5), both of which are harmful to human health. Wildfire smoke can travel hundreds of miles, causing widespread impacts well beyond the source of the smoke, as shown in the animation.
The animation demonstrates the transport of smoke within the GEOS model using the aerosol optical depth (AOD) for brown carbon. Brown carbon is an aerosol tracer representing the organic matter emitted by wildfires, which tends to absorb more sunlight than organic matter emitted by anthropogenic sources such as power plants. A larger value for AOD typically indicates a higher loading of aerosol particles. On July 14, a high-pressure system stationed over the central United States positioned the jet stream, or a fast-moving steering current for upper-level air flow, such that the smoke was able to travel from Ontario into the northeastern United States. Roughly two days later, ushered in by a frontal system, the smoke reached densely populated areas of the United States. The downward motion of the cold air behind the front kept the smoke near the surface rather than aloft.
The daily average concentrations of fine particulate matter (PM2.5) in the Baltimore-Washington, D.C. area on July 17, 2026, neared 200 micrograms per cubic meter (µg/m3), prompting Code Purple air quality alerts in the region. Smoke was still prevalent the following morning, creating a widespread haze due to increased relative humidity until the aerosol particles were washed out of the atmosphere by severe thunderstorms. With the wildfires still raging and a consistent upper-level flow, smoke continued to be transported into the northeastern United States. The meandering pattern of the jet stream resulted in waves of smoke oscillating latitudinally for the next few days.
This visualization shows the progression of fires using fire perimeter data from the Near Real Time Fire Event Data Suite (FEDS) OGC Application Programming Interface (API) from July 14–20, 2026.
This visualization reveals the dramatic long-range transport of smoke from the Canadian wildfires during July 14-20, 2026. Tan to deep red colors represent Wildfire Smoke Intensity estimated by Brown Carbon Aerosol Optical Depth from NASA's Goddard Earth Observing System Convection Allowing Model (GEOS-CAM), a 2km replay to the analysis from GEOS Forward Processing, developed by the Global Modeling and Assimilation Office (GMAO). Smoke from wildfires in Canada is seen traveling thousands of miles, blanketing various regions of the United States and impacting with record-breaking poor air quality.
Earlier Visualizations: Canadian Wildfire Smoke Transport (July 14-19, 2026)
This visualization reveals the dramatic long-range transport of smoke from the Canadian wildfires during July 14-19, 2026. Active fire locations are marked by bright red dots. Tan to deep red colors represent Wildfire Smoke Intensity estimated by Brown Carbon Aerosol Optical Depth from NASA's Goddard Earth Observing System Convection Allowing Model (GEOS-CAM), a 2km replay to the analysis from GEOS Forward Processing, developed by the Global Modeling and Assimilation Office (GMAO). Smoke from wildfires in Canada is seen traveling thousands of miles, blanketing various regions of the United States and causing record-breaking poor air quality.
This visualization reveals the dramatic long-range transport of smoke from the Canadian wildfires during July 14-19, 2026. Tan to deep red colors represent Wildfire Smoke Intensity estimated by Brown Carbon Aerosol Optical Depth from NASA's Goddard Earth Observing System Convection Allowing Model (GEOS-CAM), a 2km replay to the analysis from GEOS Forward Processing, developed by the Global Modeling and Assimilation Office (GMAO). Smoke from wildfires in Canada is seen traveling thousands of miles, blanketing various regions of the United States and impacting with record-breaking poor air quality.
Credits
NASA's Global Modeling and Assimilation Office and NASA's Scientific Visualization Studio
-
Visualizers
-
Joseph V. Ardizzone
(NASA/GSFC)

-
Helen-Nicole Kostis
(Science and Technology Corporation)
-
Zoey N. Armstrong
(Navteca, LLC.)
-
Joseph V. Ardizzone
(NASA/GSFC)
-
Scientists
-
Allison Collow
(University of Maryland Baltimore County)
-
Lesley Ott
(NASA/GSFC)
-
Allison Collow
(University of Maryland Baltimore County)
-
Support
- Ella Kaplan (ADNET Systems, Inc.)
- Laurence Schuler (ADNET Systems, Inc.)
- Ian Jones (ADNET Systems, Inc.)
Datasets used
-
GEOS-CAM (Goddard Earth Observing System Convection-Allowing Model framework)
ID: 1290Credit: NASA Global Modeling Assimilation Office (GMAO)
See all pages that use this dataset -
GEOS-FP 2Km Replay (GEOS Forward Processing 2Km Replay)
ID: 1258 -
FEDS OGC API
ID: 1254This dataset can be found at: https://earth-information-system.github.io/fireatlas/docs/nrt.html
See all pages that use this dataset -
FEDS (Fire Events Data Suite) [NOAA-20 and SUOMI-NPP: VIIRS]
ID: 1247Credit: Tempest McCabe, Douglas Morton, Melanie Follette-Cook, Elijah Orland, Zeb Becker, Yang Chen, Rebecca Scholten, Greg Corradini, Julia Signel, Alexey Shiklomanov, Kateria Sheronin, and Jim Randerson
This dataset can be found at: https://earth-information-system.github.io/fireatlas/docs/nrt.html
See all pages that use this dataset -
BMNG (Blue Marble: Next Generation) [Terra and Aqua: MODIS]
ID: 508Credit: The Blue Marble data is courtesy of Reto Stockli (NASA/GSFC).
This dataset can be found at: http://earthobservatory.nasa.gov/Newsroom/BlueMarble/
See all pages that use this dataset
Note: While we identify the data sets used on this page, we do not store any further details, nor the data sets themselves on our site.
Related
- ID: 5668
- ID: 5666
 Visualization
 - ID: 5639

- ID: 5624
 Visualization
 - ID: 5631

- ID: 5601
 Visualization
 - ID: 5598
 Visualization
 - ID: 5597

- ID: 5594

- ID: 14894
 Produced Video
 - ID: 5557

- ID: 5568
 Visualization
 - ID: 5558

- ID: 14606
![Full 8K resolution. Optimized for Earth Information Center display.
Music credit: "Magical Moments by Liam Joseph Hennessy [ PRS ]" and “Strategy Meeting by Brice Davoli [ SACEM ]” from Universal Production MusicThis video can be freely shared and downloaded at https://svs.gsfc.nasa.gov/14606. While the video in its entirety can be shared without permission, the music and some individual imagery may have been obtained through permission and may not be excised or remixed in other products. Specific details on such imagery may be found here: https://svs.gsfc.nasa.gov/14606. For more information on NASA’s media guidelines, visit https://nasa.gov/multimedia/guidelines.](/vis/a010000/a014600/a014606/EIC_NASAandFire_Main_Image_4K.jpg) Produced Video
Produced Video - ID: 5315
 Visualization
Older Versions

Release date
This page was originally published on Monday, July 20, 2026.
This page was last updated on Wednesday, July 22, 2026 at 11:17 AM EDT.