Global Nighttime Lights Change (2014–2022)
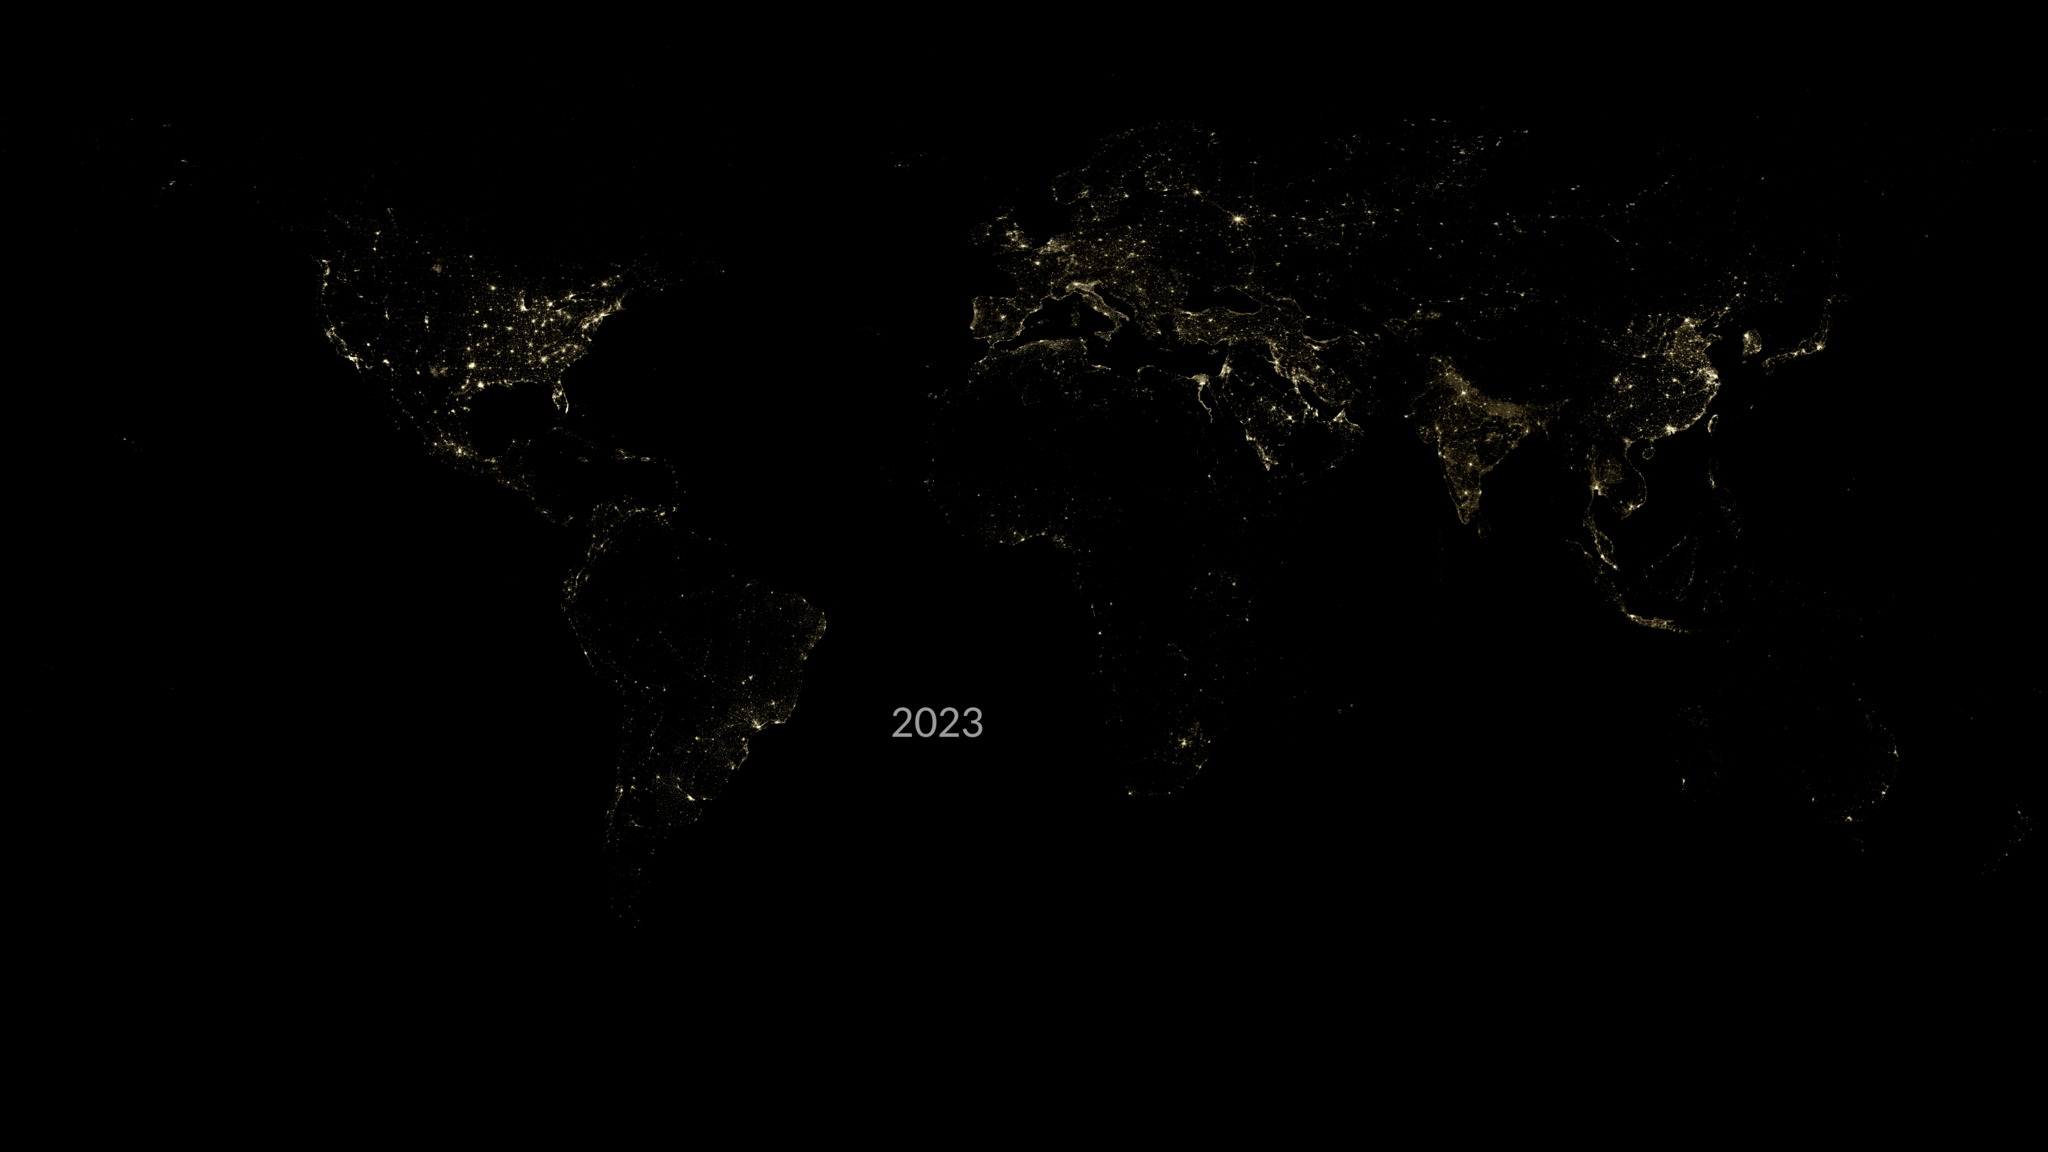
This visualization shows the accumulated (starting from 2014) nighttime light change area of Earth, capturing human activity of the planet through the emissions of artificial light. Derived from satellite imagery taken daily over the past decade, this study maps the dynamics of the human night-time activity, with golden areas experiencing brightening, purple areas featuring dimming, and white areas experiencing both.
This visualizations shows the annual nighttime light change area of Earth, capturing human activity of the planet through the emissions of artificial light. Derived from satellite imagery taken daily over the past decade, this study maps the dynamics of the human night-time activity, with golden areas experiencing brightening, purple areas featuring dimming, and white areas experiencing both.
This video shows the accumulated (starting from 2014) nighttime light change area of Earth, capturing human activity of the planet through the emissions of artificial light. Derived from satellite imagery taken daily over the past decade, this study maps the dynamics of the human night-time activity, with golden areas experiencing brightening, purple areas featuring dimming, and white areas. This version is in a vertical format.
This visualization shows the annual nighttime light change area of Earth, capturing human activity of the planet through the emissions of artificial light. Derived from satellite imagery taken daily over the past decade, this study maps the dynamics of the human night-time activity, with golden areas experiencing brightening, purple areas featuring dimming, and white areas experiencing both. This version is a vertical format.
Credits
-
Data visualizers
- Kel Elkins (Science and Technology Corporation)
- Michala Garrison (SSAI)
-
Scientists
Related
- ID: 5477
- ID: 5276
 Visualization
 - ID: 12616
 Produced Video
 - ID: 4658
Release date
This page was originally published on Wednesday, April 8, 2026.
This page was last updated on Wednesday, April 8, 2026 at 12:07 PM EDT.