ICESat-2 Land Ice Height Change (2020-2025)
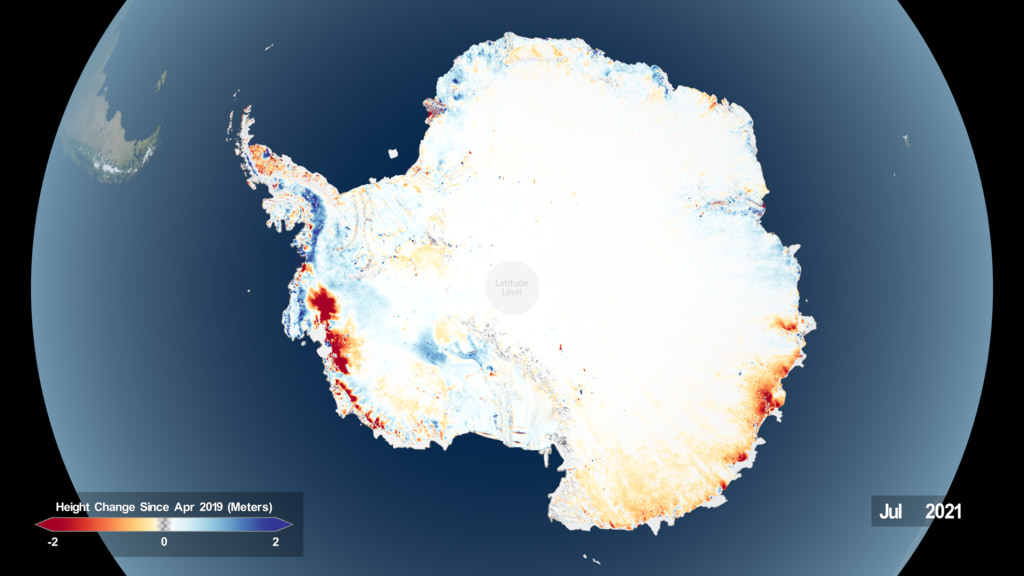
At the whole ice sheet scale, this visualization shows the continued thinning of the major outlet glaciers in West Antarctica and in parts of East Antarctica between January 2020 and April 2025. Some areas show hints of blue, indicating places where the ice sheet surface has gone up, reflecting either increased snowfall or changes in ice dynamics.
NASA’s ICESat-2 satellite measures the elevation of Earth’s surfaces – and two data products from the mission map the height of Antarctic and Greenland ice sheets, as well as how those ice sheets change over time. The ICESat-2 ATL14 data product provides a reference ice sheet surface corresponding to the ice sheet elevation in January 2020, while ATL15 provides elevation changes to that surface through time. These products are re-generated every 91 days, which is how long it takes ICESat-2 to complete its 1,387 unique orbits and collect a complete grid of measurements. Every time ATL14 and 15 are regenerated, all of the data over the life of the mission is used to improve the January 2020 standard, and best represent how the ice sheets are changing. ATL14 is posted at 100m resolution, and ATL15 is posted at 1 km resolution at three-month time resolution.
In Greenland, ICESat-2 data shows the loss of ice around the margins of the ice sheet between January 2020 and April 2025. Note that the color scale in Greenland spans from a loss of 6 meters (20 feet) to a gain of 6 meters (20 feet), showing that the losses greatly outweigh the gains.
Along the Siple Coast of West Antarctica, the Mercer, Whillans, and Kamb ice streams feed into the larger floating Ross Ice Shelf. This visualization of ICESat-2 data products shows that ice is thickening in this sector, due to the long-term slowdown of these ice streams, while small subglacial lakes are evident in bright contrast to the larger scale changes.
Zooming into Antarctica’s Pine Island Glacier, this visualization of the ICESat-2 elevation data reinforces the well-studied loss of ice in this sector. Pine Island is one of the fastest-retreating glaciers in the continent, as relatively warm water melts the base of the ice where it meets the ocean.
ICESat-2 ground tracks converge at the 88 degrees north and south latitudes. In Antarctica, some of the most subtle elevation changes are in the ice sheet interior, near 88 degrees south latitude. By aggregating data through time, ICESat-2 can resolve elevation changes to a fraction of an inch.
A detailed view of coastal terrain in Dronning Maud Land, East Antarctica shows height-change variability driven primarily by snow accumulation and compaction. The surface rises during periods of heavy snowfall, then sinks again as the fallen snow settles and compacts. The largest height changes are on eastern facing slopes that intercept the dominant storm tracks, in some places gaining as much as two meters during the ICESat-2 mission.
The ATL14 and 15 data products are also produced over the peripheral ice caps in the Arctic, such as these in Svalbard, Norway, and Russian islands. Here we see elevation losses of up to 20 meters between January 2020 and April 2025, visualizing the ongoing collapse of these smaller ice caps.
Credits
-
Visualizer
-
Kel Elkins
(USRA)

-
Kel Elkins
(USRA)
-
Producer
- Ryan Fitzgibbons (eMITS)
-
Scientists
- Benjamin E. Smith (University of Washington Applied Physics Lab Polar Science Center)
- Denis Felikson (NASA/GSFC)
- Thomas A. Neumann (NASA/GSFC)
Datasets used
-
Land Ice Height Change (ICESat-2 ATL15 Land Ice Height Change) [ICESat-2]
ID: 1259This dataset can be found at: https://nsidc.org/data/atl15/versions/5
See all pages that use this dataset
Note: While we identify the data sets used on this page, we do not store any further details, nor the data sets themselves on our site.
Older Versions
- ID: 4984
 Visualization
Release date
This page was originally published on Monday, December 29, 2025.
This page was last updated on Thursday, December 18, 2025 at 3:58 PM EST.