A newer version of this visualization is available.
Daily Visualizations of the Largest Wildfires in the United States: 2025
Wildland fires pose significant threats to ecosystems, property, and human lives. Leveraging NASA’s satellite data, advanced models, visualization capacity and computing power, we analyze fire events, monitor how weather conditions impact fires and how regional air quality affects communities.
What this Webpage Offers
Through this webpage we share daily updated visualizations of the two largest active wildfires events (labeled as Event 1 and Event 2 in this webpage) in the continental United States throughout fire season. Each event has a collection of five media assets. For each event these data-driven assets are:
- Fire Information (format: still image)
- GEOS Black Carbon (format: movie, duration: 30secs)
- GEOS Fire Monitor: Regional Air Quality (format: movie, duration: 30secs)
- GEOS Fire Monitor: Regional Weather (format: movie, duration: 30secs)
- Progression of Fire (format: movie, duration: 30secs)
Our media collections are designed to be modular and serve multiple purposes. They work together as a comprehensive display on Hyperwall systems (32:9 aspect ratio, 7680x2160 resolution) at Earth Information Center (earth.gov) exhibits, or as smaller collections, or each visual asset can be used independently. All assets are freely and openly available for public use, allowing for flexible implementation across different platforms, display sizes and production needs.
The daily assets for each event are archived and available for download below:
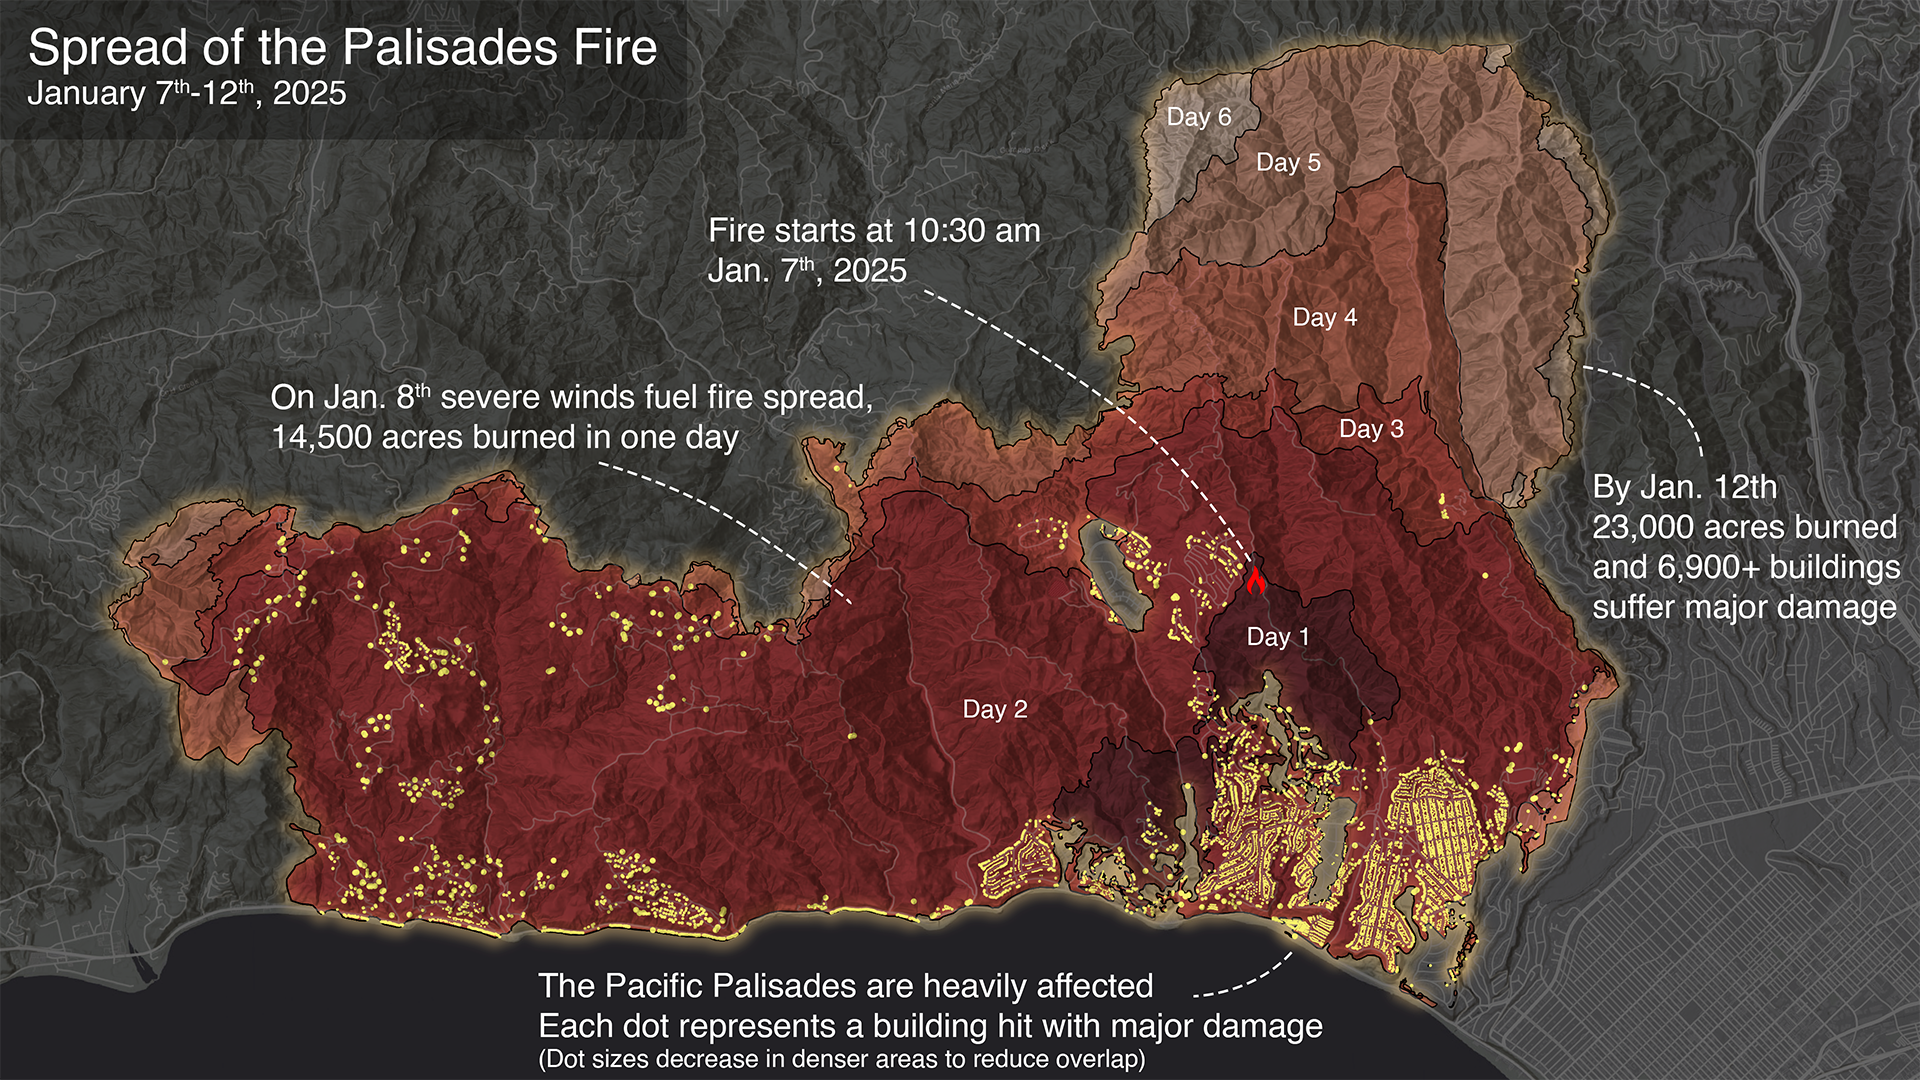
Event 1 - Fire Information

Still image with information about the fire event, such as the name, location, affected area and status of fire.
Event 1 - GEOS Black Carbon
Visualization of Black Carbon from NASA’s Goddard Earth Observing System (GEOS) model.

Legend overlay for the GEOS Black Carbon visualization.
Event 1 - GEOS Fire Monitor: Regional Air Quality
Visualization of regional air quality indicators from NASA’s Goddard Earth Observing System (GEOS) model.
Event 1 - GEOS Fire Monitor: Regional Weather
Visualization of regional weather indicators from NASA’s Goddard Earth Observing System (GEOS) model.
Event 1 - Progression of Fire
Visualization showing the progression of fire using fire perimeters data from the Near Real Time Fire Event Data Suite (FEDS) OGC Application Programming Interface (API).
Event 2 - Fire Information

Still image with information about the fire event, such as the name, location, affected area and status of fire.
Event 2 - GEOS Black Carbon
Visualization of Black Carbon from NASA’s Goddard Earth Observing System (GEOS) model.
Legend overlay for the GEOS Black Carbon visualization.
Event 2 - GEOS Fire Monitor: Regional Air Quality
Visualization of regional air quality indicators from NASA’s Goddard Earth Observing System (GEOS) model.
Event 2 - GEOS Fire Monitor: Regional Weather
Visualization of regional weather indicators from NASA’s Goddard Earth Observing System (GEOS) model.
Event 2 - Progression of Fire
Visualization showing the progression of fire using fire perimeters data from the Near Real Time Fire Event Data Suite (FEDS) OGC Application Programming Interface (API).
Process Overview
Our data-driven workflow creates comprehensive wildfire visualizations through these steps:
Fire Identification: We query the Earth Observatory Natural Event Tracker (EONET) API to identify the two largest active fires, gathering essential data like fire name, affected area and precise location. The EONET API filters fire events from the Integrated Reporting of Wildland Fire Information (IRWIN) database, which is an “end-to-end” data management and reporting capability by the Wildland Fire Information Portal
Fire Progression: Through the Fire Events Data Suite (FEDS) OGC API, we access fire perimeter data from the previous two weeks to create visualizations showing how each fire has evolved over time.
Regional Analysis of fire events: Leveraging NASA’s Goddard Earth Observing System (GEOS) model, we target the precise locations of the two largest active fire events and generate visualizations on NASA’s Discover supercomputer that illustrate:
- Black carbon dispersal from the fire.
- Regional meteorological conditions affecting fire behavior.
- Regional air quality indicators for surrounding communities.
Acknowledgements & Additional Information
This visualization capacity was developed collaboratively by the Scientific Visualization Studio and NASA’s Global Modeling Assimilation Office (GMAO) with contributions, support and scientific guidance from multiple teams across NASA. To learn more about the contributing teams and technologies behind this resource, please see below:
Goddard Earth Observing System (GEOS)
NASA’s GEOS is a complex modeling and data assimilation system that creates global analyses of the Earth System. GEOS integrates satellite observations, in situ measurements, and approximately one million weather observations collected hourly to inform its models. GEOS data products are created by NASA’s Global Modeling and Assimilation Office (GMAO).
The GEOS visualizations provided in this webpage incorporate data from the following products:
- GEOS-FP: Regional weather analysis for 2-meter Temperature (T2m), 10-meter Wind Speed (W10m), Relative Humidity (RH), Soil Moisture (SM), and regional air quality analysis for Particulate Matter 2.5 (PM2.5) concentrations.
- GEOS-CF: Regional air quality concentrations for Nitrogen Dioxide (NO2), Carbon Monoxide (CO), and Ozone (O3).
- GEOS-FP 2KM Replay: Black carbon dispersal from the fire.
Fire Events Data Suite (FEDS) OGC API
The Fire Events Data Suite (FEDS) algorithm tracks the growth and intensity of individual fires every 12 hours using active fire detections from the Visible Infrared Imaging Radiometer Suite (VIIRS) sensors onboard the Suomi National Polar-Orbiting Partnership (Suomi NPP) and NOAA-20 satellites. FEDS provides a spatially explicit estimate of a fire’s perimeter, the actively burning portion of the perimeter, and bulk statistics associated with each time step. FEDS fire tracking information is publicly available in near real-time for the contiguous United States, Canada, and Alaska. Near real time data are available through the OGC Application Programming Interface (API).
Earth Observatory Natural Event Tracker (EONET)
The open-source EONET Application Programmer Interface (API) is built to provide a curated reference of continuously updated, near real-time, natural event metadata. The metadata data are accessible via web services that link natural events to thematically-related image sources. EONET is managed and maintained by the Web Strategy and Communications Team, Earth Science Data Systems Program.
Special thanks for the support and scientific guidance from the NASA Fires Program, NASA FIRMS, the U.S. Forest Service, Lesley Ott (NASA GMAO), Doug Morton (NASA), and Robert Field (NASA GISS).

View of the Earth Information Center Wildland Fires Data Dashboard showing the layout and presentation of data visualization assets offered in this page. This still image features visualization assets from the Red Canyon wildfire in Hot Springs, Wyoming, as of August 21, 2025.
Credits
Scientific Visualization Studio (SVS), Global Modeling Assimilation Office (GMAO) and Web Strategy and Communications Team, Earth Science Data Systems Program
-
Visualizers
-
Helen-Nicole Kostis
(USRA)

-
Joseph V. Ardizzone
(NASA/GSFC)
-
Zoey N. Armstrong
(Navteca, LLC.)
-
Helen-Nicole Kostis
(USRA)
-
Scientists
-
Lesley Ott
(NASA/GSFC)
-
Doug C. Morton
(NASA/GSFC)
-
Tempest McCabe
(University of Maryland)
-
Elijah Orland
(University of Maryland Baltimore County)
-
Lesley Ott
(NASA/GSFC)
-
Technologist
- Zeb Becker (University of Maryland)
-
Eonet team
- Paul Przyborski (SSAI)
- Teddie Gelabert (SSAI)
- Andi Thomas (SSAI)
- Vipool Rathad (ADNET Systems Inc.)
-
Support
-
Alex Gurvich
(NASA/GSFC)
- Ella Kaplan (Global Science and Technology, Inc.)
- Laurence Schuler (ADNET Systems, Inc.)
- Ian Jones (ADNET Systems, Inc.)
-
Alex Gurvich
(NASA/GSFC)
Related papers
Chen, Y., Hantson, S., Andela, N. et al. California wildfire spread derived using VIIRS satellite observations and an object-based tracking system. Sci Data 9, 249 (2022). https://doi.org/10.1038/s41597-022-01343-0
Datasets used
-
GEOS Atmospheric Model
ID: 665 -
GEOS-FP 2Km Replay (GEOS Forward Processing 2Km Replay)
ID: 1258 -
GEOS-CF (GEOS Composition Forecast)
ID: 1253This dataset can be found at: https://gmao.gsfc.nasa.gov/gmao-products/geos-cf/
See all pages that use this dataset -
GEOS-FP
ID: 1196Documentation: Lucchesi, R., 2018: File Specification for GEOS FP. GMAO Office Note No. 4 (Version 1.2), 61 pp, available from https://gmao.gsfc.nasa.gov/pubs/docs/Lucchesi1203.pdf
This dataset can be found at: https://fluid.nccs.nasa.gov/weather/
See all pages that use this dataset -
FEDS (Fire Events Data Suite) [NOAA-20 and SUOMI-NPP: VIIRS]
ID: 1247Credit: Tempest McCabe, Douglas Morton, Melanie Follette-Cook, Elijah Orland, Zeb Becker, Yang Chen, Rebecca Scholten, Greg Corradini, Julia Signel, Alexey Shiklomanov, Kateria Sheronin, and Jim Randerson
This dataset can be found at: https://earth-information-system.github.io/fireatlas/docs/nrt.html
See all pages that use this dataset -
FEDS OGC API
ID: 1254This dataset can be found at: https://earth-information-system.github.io/fireatlas/docs/nrt.html
See all pages that use this dataset -
QFED (Quick Fire Emissions Dataset) [MODIS]
ID: 1255This dataset can be found at: https://ntrs.nasa.gov/citations/20180005253
See all pages that use this dataset -
EONET API (Earth Observatory Natural Event Tracker API)
ID: 1256Credit: Web Strategy and Communications Team, Earth Science Data Systems Program
This dataset can be found at: https://eonet.gsfc.nasa.gov/
See all pages that use this dataset -
IRWIN (Integrated Reporting of Wildfire Information)
ID: 1257This dataset can be found at: https://www.wildfire.gov/application/irwin-integrated-reporting-wildfire-information
See all pages that use this dataset
Note: While we identify the data sets used on this page, we do not store any further details, nor the data sets themselves on our site.
Citing this page
Related
- ID: 5665

- ID: 5664

- ID: 5624
 Visualization
 - ID: 5631

- ID: 5601
 Visualization
 - ID: 5598
 Visualization
 - ID: 5597

- ID: 14894
 Produced Video
 - ID: 5568
 Visualization
 - ID: 5558

- ID: 5315
 Visualization
Newer Versions
- ID: 5639

Release date
This page was originally published on Monday, September 8, 2025.
This page was last updated on Thursday, March 12, 2026 at 3:19 PM EDT.