Air Quality Model Runs
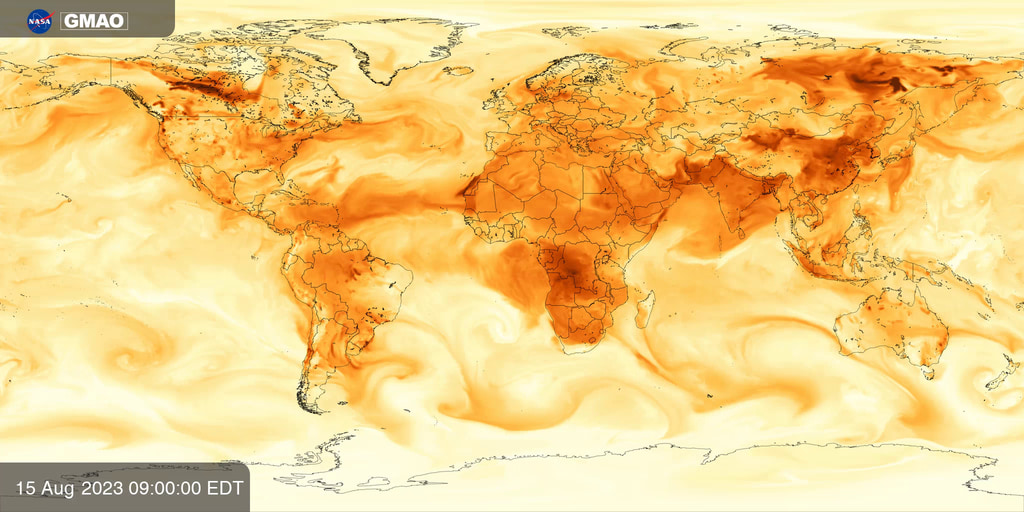
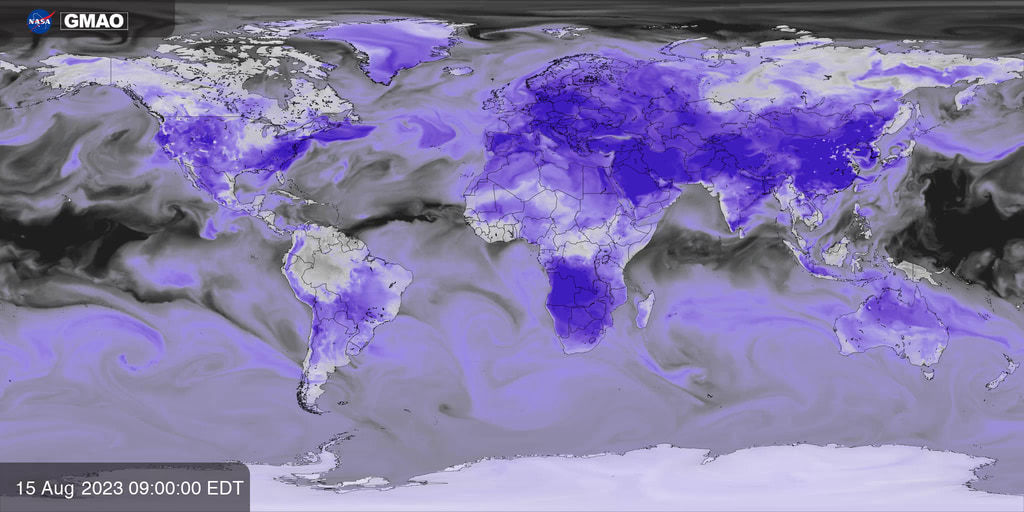
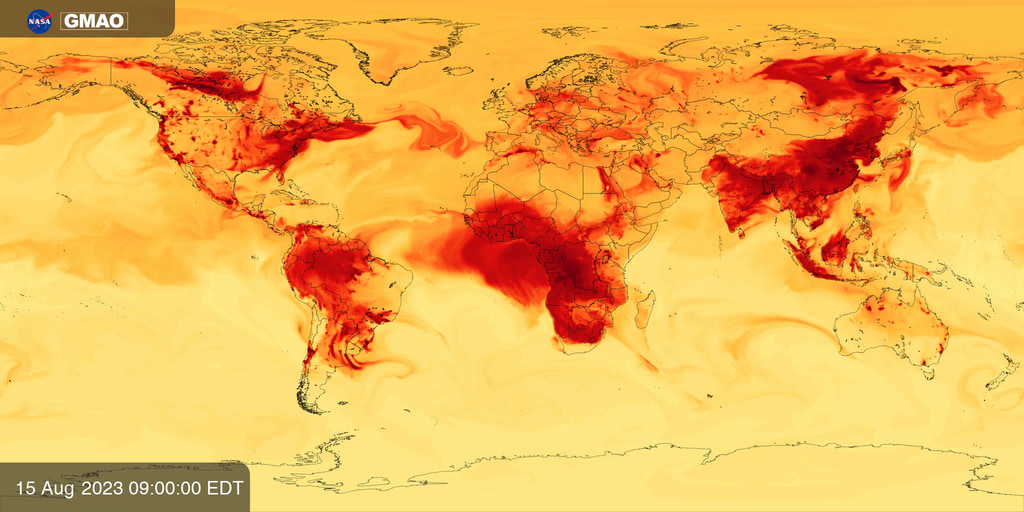
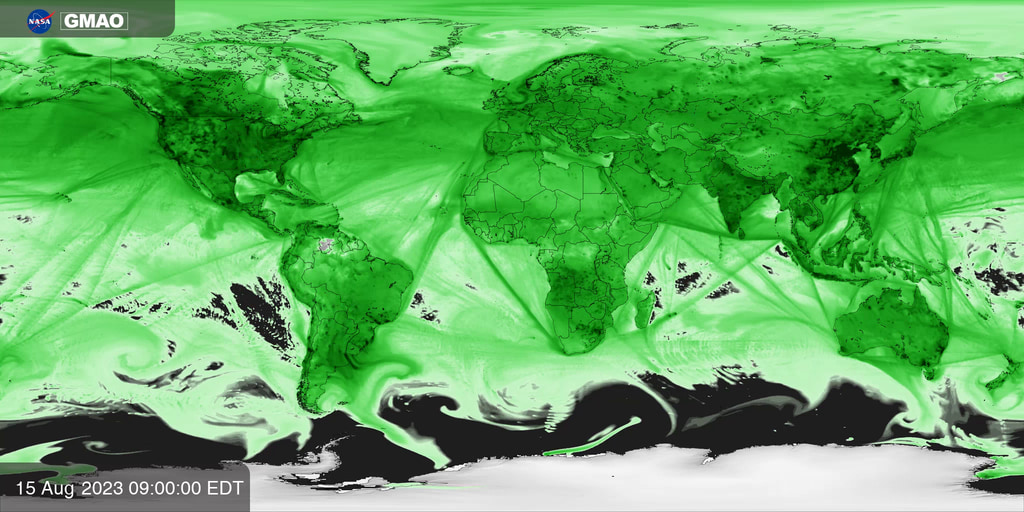
Visualization showcasing the transport of Carbon Monoxide (CO), Particulate Matter (PM 2.5), Ozone (O3) and Nitrous Oxides (NOx) during July-August 2024, which was an active fire season in Northern America. This visualization is rendered on a rotating Earth and is provided in 5760x3240 pixels (16:9 aspect ratio).
NASA utilizes satellite instruments and models to monitor sources of air pollutants and their movement through the atmosphere. This visualization shows concentrations of air pollutants, such as Particulate Matter (PM2.5, fine particles smaller than 2.5 micrometers), Ozone (O3), Carbon Monoxide (CO), and Nitrogen Oxides (NOx) as they are tracked from NASA's Goddard Earth Observing System Composition Forecasting (GEOS-CF) system. This data is used around the world to develop new methods for improving local air quality predictions, to understand the impact of pollution on human health, and to improve the quality of NASA satellite datasets.
Predictions of air pollution are created using complex models that combine information about weather and the emissions, transformation, and transport of chemical species and particles. The Goddard Earth Observing System Composition Forecasting (GEOS-CF) system is a research model maintained by NASA’s Global Modeling and Assimilation Office to help scientists understand the causes and impact of air pollution. It is one of the highest resolution and most detailed models of its kind in the world, made possible through ongoing collaborations between NASA and university scientists. GEOS-CF tracks the concentrations of hundreds of gas phase chemical species and dozens of types of particles characterized by their composition and size. It is used by a wide variety of stakeholders around the world to develop new methods for improving local predictions, understanding the impact of pollution on human health, and improving the quality of NASA satellite datasets. Images for this visualization were created by NASA’s Global Modeling and Assimilation Office (GMAO) and produced by NASA's Scientific Visualization Studio (SVS).
This page offers content in 16:9 and 32:9 aspect ratios.
Visualization showcasing the transport of Carbon Monoxide (CO), Particulate Matter (PM 2.5), Ozone (O3) and Nitrous Oxides (NOx) during July-August 2024, which was an active fire season in Northern America. This visualization is provided in 5760x3240 pixels (16:9 aspect ratio).
Visualization showcasing the transport of Carbon Monoxide (CO), Particulate Matter (PM 2.5), Ozone (O3) and Nitrous Oxides (NOx) during July-August 2024, which was an active fire season in Northern America. This longer version (1min 41secs) is rendered on a rotating Earth and is provided in 5760x3240 pixels (16:9 aspect ratio).
Earth Information Center Version for the Hyperwall (32:9 Aspect ratio, 7680x2160 pixels resolution)
Visualization showcasing the transport of Carbon Monoxide (CO), Particulate Matter (PM 2.5), Ozone (O3) and Nitrous Oxides (NOx) during July-August 2024, which was an active fire season in Northern America.
For More Information
Credits
NASA's Scientific Visualization Studio and NASA's Global Modeling and Assimilation Office
-
Data visualizers
-
Helen-Nicole Kostis
(USRA)

- Joseph V. Ardizzone (NASA/GSFC)
-
Helen-Nicole Kostis
(USRA)
-
Scientist
-
Lesley Ott
(NASA/GSFC)
-
Lesley Ott
(NASA/GSFC)
-
Technical support
- Laurence Schuler (ADNET Systems, Inc.)
- Ian Jones (ADNET Systems, Inc.)
- Ella Kaplan (Global Science and Technology, Inc.)
Related papers
Description of the NASA GEOS composition forecast modeling system GEOS-CF v1.0
Keller, C. A., Knowland, K. E., Duncan, B. N., Liu, J., Anderson, D. C., Das, S., Lucchesi, R. A., Lundgren, E. W., Nicely, J. M., Nielsen, E., Ott, L. E., Saunders, E., Strode, S. A., Wales, P. A., Jacob. D. J., and Pawson, S. (2021). Description of the NASA GEOS composition forecast modeling system GEOS-CF v1.0. Journal of Advances in Modeling Earth Systems, 13, e2020MS002413. 10.1029/2020MS002413.
DOI: 10.1029/2020MS002413
This paper can be found at: https://agupubs.onlinelibrary.wiley.com/doi/10.1029/2020MS002413
NASA GEOS Composition Forecast Modeling System GEOS-CF v1.0: Stratospheric composition
Knowland, K. E., C. A. Keller, P. A. Wales, K. Wargan, L. Coy, M. S. Johnson, J. Liu, R. A. Lucchesi, S. D. Eastham, E. Fleming, Q. Liang, T. Leblanc, N. J. Livesey, K. A. Walker, L. E. Ott, and S. Pawson. (2022). NASA GEOS Composition Forecast Modeling System GEOS-CF v1.0: Stratospheric composition. Journal of Advances in Modeling Earth Systems, 14, e2021MS002852. 10.1029/2021MS002852
DOI: 10.1029/2021MS002852
This paper can be found at: https://agupubs.onlinelibrary.wiley.com/doi/10.1029/2021MS002852
Datasets used
-
GEOS-CF
ID: 1197Knowland, K.E., C.A. Keller, and R. Lucchesi, 2022: File Specification for GEOS-CF Products. GMAO Office Note No. 17 (Version 1.3), 54 pp, available from https://gmao.gsfc.nasa.gov/pubs/docs/Knowland1446.pdf
This dataset can be found at: https://portal.nccs.nasa.gov/datashare/gmao/geos-cf/v2/
See all pages that use this dataset
Note: While we identify the data sets used on this page, we do not store any further details, nor the data sets themselves on our site.
Citing this page
Related
- ID: 5151
 Visualization
 - ID: 5152
 Visualization
 - ID: 5153
 Visualization
 - ID: 5154
 Visualization
Alternate Versions
- ID: 5518
 Visualization
Release date
This page was originally published on Monday, May 5, 2025.
This page was last updated on Wednesday, January 28, 2026 at 5:21 PM EST.