ESCAPADE Theoretical Flight Through Active Mars Magnetosphere
NASA's Escape and Plasma Acceleration Dynamics Explorers mission, or ESCAPADE, aims to study Mars' real-time response to the solar wind and how the Martian magnetosphere changes over time, helping us better understand Mars' climate history.
In this data visualization, we use the September 13, 2017 solar storm that arrived at Mars as an example of a storm that the twin ESCAPADE spacecraft might study.
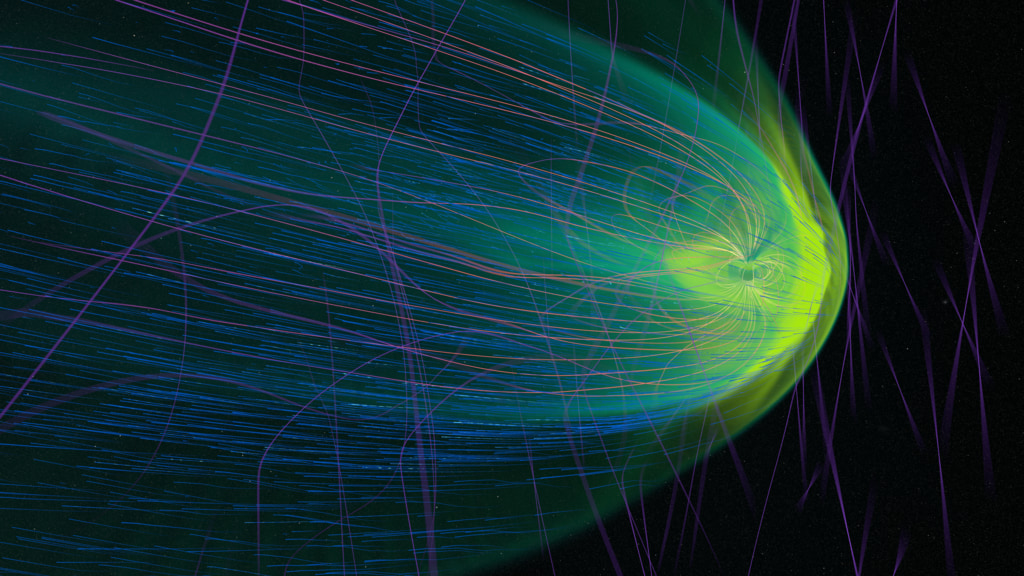
The solar wind from that storm induced currents (green colors) and magnetic fields (pink lines), which combined with Mars' relatively weak and irregular native crustal magnetic fields to contribute to Mars’ "hybrid" magnetosphere. The visualization demonstrates how in the hours before and during the storm, Mars’ magnetosphere changes as the planet rotates to show a constantly changing magnetic "face" to the solar wind. Earth's magnetosphere, in comparison, is much stronger and more stable thanks to liquid metal moving inside our planet's core, so currents induced by the planet’s crust or solar activity are less significant components of the magnetic activity around Earth.
Mars's magnetosphere experienced a strong solar wind storm on September 13, 2017. The induced magnetic field, generated by the storm's plasma interacting with the Martian ionosphere, was significantly stronger than usual and exceeded Mars' crustal magnetic field present in many localized regions of the planet.
This data visualization shows time passing at 30 data simulation minutes per animation second.
The solar storm can be seen contacting the Martian magnetosphere at 0:17 in the movie. The green current density shows where magnetic current is strong. Lines tracing out the magnetic field are purple in regions of weaker magnetism, and orange-yellow where the magnetic field is strongest.
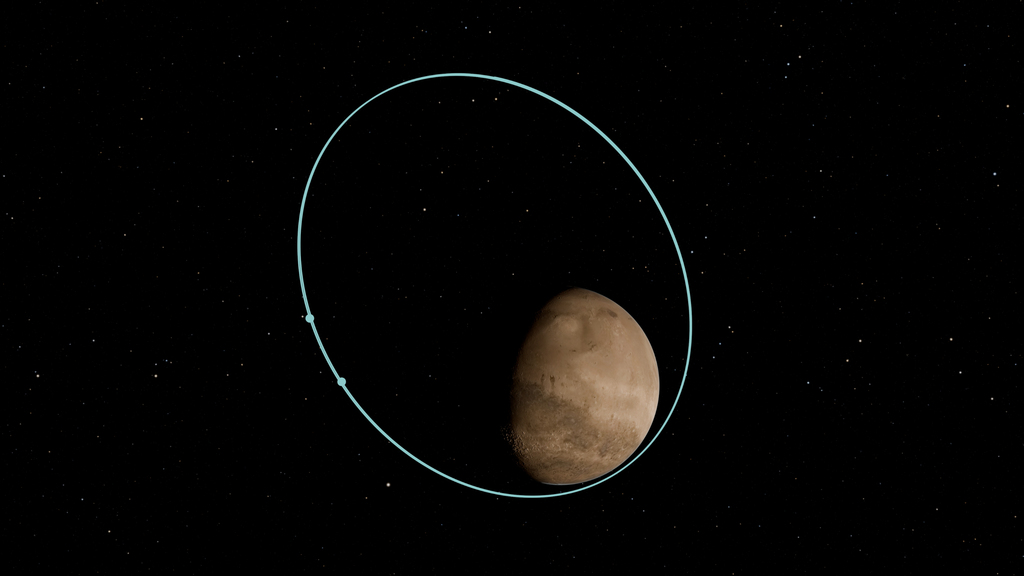
Cyan lines indicate the expected path of the ESCAPADE spacecraft during the first part of its mission, when the two spacecraft fly in tandem with one closely following the other.
An alternate version of the data visualization with a sun-pointing arrow is available in the Download menu.
This data visualization features the same data as above, but with a fixed side-on view.
An alternate version of the visualization with a sun-pointing arrow is available in the Download menu.
This data visualization shows Mars' magnetosphere in the hour before the storm begins. The data driving this visualization is at a much higher time resolution, so the visualization appears to be moving in slow motion. This makes it easier to analyze certain dynamics in Mars' magnetosphere. The viewpoint is side-on and does not change.
Cyan lines indicate the expected path of the ESCAPADE spacecraft during the first part of its mission, when the two spacecraft fly in tandem with one closely following the other.
An alternate version of this data visualization with a sun-pointing arrow is available in the Download menu.
This data visualization is the same as above, except the locations of the spacecraft are changed.
Cyan lines indicate the expected path of the ESCAPADE spacecraft during the second part of its mission, when the two spacecraft fly apart on different parts of the Martian globe.
The green current density shows where magnetic current is strong. Lines tracing out the magnetic field are purple in regions of weaker magnetism, and orange-yellow where the magnetic field is strongest.
An alternate version of this data visualization with a sun-pointing arrow is available in the Download menu.
This data visualization features the same data as above, but with a fixed side-on view.
An alternate version of the visualization with a sun-pointing arrow is available in the Download menu.
This data visualization shows Mars' magnetosphere for exactly 1 hour before the storm begins. The data driving this visualization is 6 times more frequent, at 5 data simulation minutes per animation second, so the visualization appears to be moving in slow motion. This makes it easier to analyze certain dynamics in Mars' magnetosphere. The viewpoint is side-on and does not change.
Cyan lines indicate the expected path of the ESCAPADE spacecraft during the second part of its mission, when the two spacecraft fly apart on different parts of the Martian globe.
An alternate version of the visualization with a sun-pointing arrow is available in the Download menu.
Credits
Please give credit for this item to:
NASA's Scientific Visualization Studio
-
Visualizer
-
AJ Christensen
(SSAI)

-
AJ Christensen
(SSAI)
-
Producer
- Joy Ng (eMITS)
-
Scientists
- Yingjuan Ma (UCLA)
- Robert Lillis (University of California, Berkeley)
Related papers
Ma, Y., Fang, X., Halekas, J. S., Xu, S., Russell, C. T., Luhmann, J. G., et al. (2018). The impact and solar wind proxy of the 2017 September ICME event at Mars. Geophysical Research Letters, 45, 7248–7256. https://doi.org/10.1029/2018GL077707
Datasets used
-
BATS-R-US (Block Adaptive Tree Solar-wind Roe Upwind Scheme)
ID: 1236BATS-R-US was designed using the Message Passing Interface (MPI) and the Fortran90 standard and executes on a massively parallel computer system. The BATS-R-US code solves 3D MHD equations in finite volume form using numerical methods related to Roe's Approximate Riemann Solver. BATS-R-US uses an adaptive grid composed of rectangular blocks arranged in varying degrees of spatial refinement levels. It is part of the Space Weather Modeling Framework.
Credit: What Sustained Multi-Disciplinary Research Can Achieve: The Space Weather Modeling Framework
This dataset can be found at: https://clasp.engin.umich.edu/research/theory-computational-methods/space-weather-modeling-framework/swmf-downloadable-software/
See all pages that use this dataset
Note: While we identify the data sets used on this page, we do not store any further details, nor the data sets themselves on our site.
Related
- ID: 5617
 Visualization
 - ID: 14915
 Produced Video
 - ID: 5502
 Visualization
 - ID: 5193
 Visualization
Release date
This page was originally published on Wednesday, November 19, 2025.
This page was last updated on Tuesday, November 18, 2025 at 5:17 PM EST.