The Different Sources of Atmospheric Methane
This data visualization shows methane data (CH₄) in the Earth's atmosphere during 2021. The colors represent contributions from different sources: agriculture and waste (fuchsia), industry (blue), wetlands (green), wildfires and cropland fires (yellow), and other natural sources (gray). Advanced computer modeling techniques at NASA's Global Modeling and Assimilation Office (GMAO) allow us to visualize how methane from these different sources is blown around by the wind, and how changes in atmospheric methane are determined by these sources, atmospheric circulation, and the atmospheric chemical sink.
As the visualization shows, different sources have different patterns in space and time. For example, industrial sources are concentrated near areas of human habitation and change little throughout the year. In contrast, wetland and fire sources are seasonal. Amazonian wetlands slow down as the dry season approaches in July-August, only to have fire emissions pick up. Boreal wetlands in Northern Canada, on the other hand, are quite dormant for most of the year and release most of their emissions at the end of summer in July-September. In Africa, large fires south of the Equator are seen to pick up in July-August, while north of the Equator the sub-Saharan grassland fires burn mostly November to January. Studying these patterns, and how they change from year to year, help us understand the primary drivers behind each of these emission sources, whether they be natural or anthropogenic.
Americas (All Sources)
This data visualization shows the different sources of methane (CH₄) in the Earth’s atmosphere over the course of the year 2021. This view highlights North and South America. The colors represent contributions from different sources: agriculture and waste (fuchsia), industry (blue), wetlands (green), wildfires and cropland fires (yellow), and other natural sources (gray).
Europe, Middle East and Africa (All Sources)
This data visualization shows the different sources of methane (CH₄) in the Earth’s atmosphere over the course of the year 2021. This view highlights Europe, Middle East and Africa. The colors represent contributions from different sources: agriculture and waste (fuchsia), industry (blue), wetlands (green), wildfires and cropland fires (yellow), and other natural sources (gray).
Asia Pacific (All Sources)
This data visualization shows the different sources of methane (CH₄) in the Earth’s atmosphere over the course of the year 2021. This view highlights Asia-Pacific. The colors represent contributions from different sources: agriculture and waste (fuchsia), industry (blue), wetlands (green), wildfires and cropland fires (yellow), and other natural sources (gray).
Tagged Methane Composite
This data visualization shows methane (CH₄) in the Earth’s atmosphere over the course of the year 2021. This composite visualization showcases different sources for all regions. The colors represent contributions from different sources: agriculture and waste (fuchsia), industry (blue), wetlands (green), wildfires and cropland fires (yellow), and other natural sources (gray).
Agriculture & Waste
This visualization shows agriculture and waste sources of methane (CH₄) across the Americas during 2021 (shown in fuchsia).
This visualization shows agriculture and waste sources of methane (CH₄) in Europe, the Middle East and Africa during 2021 (shown in fuchsia).
This visualization shows agriculture and waste sources of methane (CH₄) across Asia-Pacific during 2021 (shown in fuchsia).
Industry
This visualization shows industry contributions to methane (CH₄) across the Americas during 2021 (shown in blue).
This visualization shows industry contributions to methane (CH₄) across Europe, the Middle East and Africa during 2021 (shown in blue).
This visualization shows industry contributions to methane (CH₄) across Asia-Pacific during 2021 (shown in blue).
Wetlands
This visualization shows wetland contributions to methane (CH₄) across the Americas during 2021 (shown in green).
This visualization shows wetland contributions to methane (CH₄) across Europe, the Middle East and Africa during 2021 (shown in green).
This visualization shows wetland contributions to methane (CH₄) across Asia-Pacific during 2021 (shown in green).
Fires
This visualization shows wildfires and croplland fires contributions to methane (CH₄) across the Americas during 2021 (shown in yellow).
This visualization shows wildfires and croplland fires contributions to methane (CH₄) across Europe, the Middle East and Africa during 2021 (shown in yellow).
This visualization shows wildfires and croplland fires contributions to methane (CH₄) across Asia-Pacific during 2021 (shown in yellow).
Other Natural
This visualization shows other natural contributions to methane (CH₄) across the Americas during 2021 (shown in gray).
This visualization shows other natural contributions to methane (CH₄) across Europe, the Middle East and Africa during 2021 (shown in gray).
This visualization shows other natural contributions to methane (CH₄) across Asia-Pacific during 2021 (shown in gray).
Methane Accounting Plot
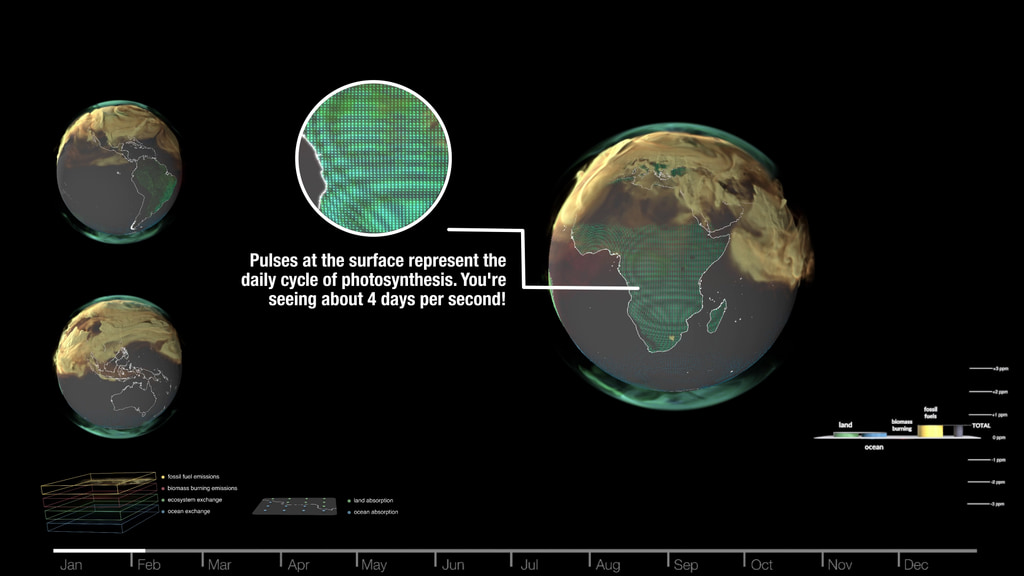
This accounting plot shows the different global contributors of atmospheric methane over the course of the year, and how they contribute to the net methane added to the atmosphere as the year progresses.
This timeline is synchronized with the visualizations above to show temporal progress across the year.
Colorbars

Agriculture & Waste colorbar

Industry colorbar

Wetlands colorbar

Fires colorbar

Other natural sources colorbar

Tagged Methane (CH4) legend
Credits
Please give credit for this item to:
NASA's Scientific Visualization Studio
-
Visualizers
-
AJ Christensen
(SSAI)
-
Mark SubbaRao
(NASA/GSFC)
-
Helen-Nicole Kostis
(USRA)
-
Greg Shirah
(NASA/GSFC)
-
AJ Christensen
(SSAI)
-
Scientists
-
Lesley Ott
(NASA/GSFC)
-
Sourish Basu
(University of Maryland, College Park)
-
Lesley Ott
(NASA/GSFC)
-
Technical support
- Laurence Schuler (ADNET Systems, Inc.)
- Ian Jones (ADNET Systems, Inc.)
Datasets used
-
GMAO GEOS Atmospheric Methane (GMAO GEOS Atmospheric Methane)
ID: 1066
Note: While we identify the data sets used on this page, we do not store any further details, nor the data sets themselves on our site.
Citing this page
Release date
This page was originally published on Monday, September 22, 2025.
This page was last updated on Thursday, September 18, 2025 at 10:55 AM EDT.


