A newer version of this visualization is available.
Map of the October 2, 2024 Annular Solar Eclipse

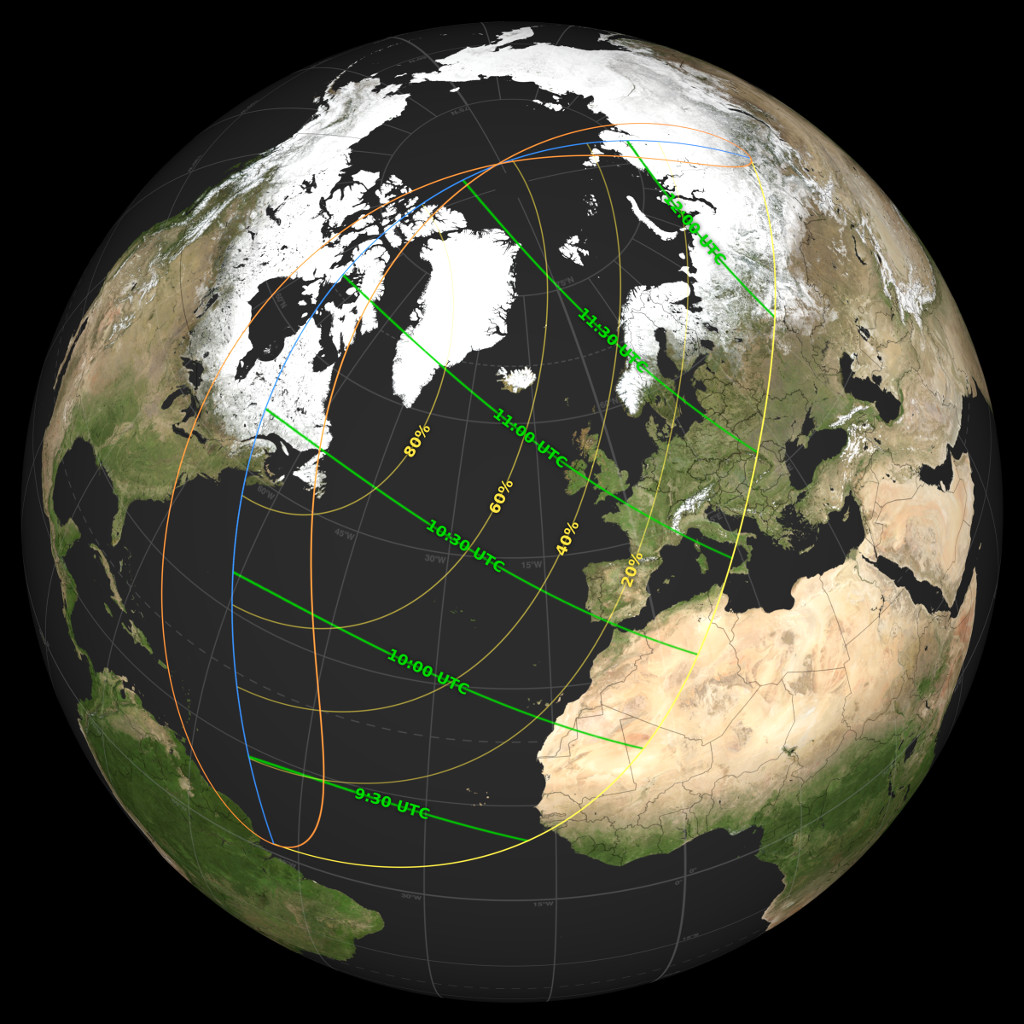
A global map of the shadow path for the October 2, 2024 annular solar eclipse.
On Wednesday, October 2, 2024, the Moon passes in front of the Sun, casting its shadow across the Pacific Ocean. Observers on Rapa Nui (Easter Island) and in far southern Chile and Argentina are in the path of the annular eclipse. Hawai'i, parts of Antarctica, and the southern half of South America see a partial eclipse.
This is an annular ("ring") eclipse – not to be confused with "annual." At the time of the eclipse, the Moon is too far away from the Earth, and therefore too small in the sky, to completely cover the Sun. The central part of the shadow, where the silhouette of the Moon is completely surrounded by a ring of sunlight, is called the antumbra. Observers within the antumbra experience annularity. The part of the shadow outside the antumbra, where observers see a partial eclipse, is the penumbra.
The annular eclipse occurs within the red path across the center of the map. The antumbra is drawn at 15-minute intervals along this path. The yellow curves parallel to the antumbra path trace the extent of the partial eclipse. Percentages on each of these curves give the maximum area of the Sun covered by the Moon during the eclipse. The green lines that cross the antumbra and partial paths show the progress of the eclipse over time. The times on each line indicate when maximum eclipse arrives at that line.
The times are written in UTC or Coordinated Universal Time, successor to the former Greenwich Mean Time (GMT) standard. To find the local time, add the location's time zone offset from UTC. Eastern Daylight Time (EDT) is 4 hours behind UTC, for example, so 18:30 UTC is 14:30 EDT, or 2:30 p.m.
The orange loops at either end of the path are the sunrise and sunset lines. The loop at the western (left) end is the sunrise line. The left half of that loop is the line at which the eclipse ends at sunrise. The right half of the western loop is the line at which the eclipse begins at sunrise. On the eastern loop, the left side is the line at which the eclipse ends at sunset, and the right half is where the eclipse begins at sunset. The blue lines bisecting these loops are where maximum eclipse occurs at sunrise or sunset. All of these lines are based on an idealized model of the eclipse geometry. The true situation at the ends of the shadow path is much messier. The apparent positions of the Sun and Moon relative to the horizon are affected by local terrain and atmospheric refraction.
Two aspects of eclipse mapping can be particularly confusing. The first is the difference between obscuration (the area of the Sun covered by the Moon) and magnitude (the diameter of the Sun covered). The partial eclipse contours on this map show the obscuration, while some other maps show magnitude contours. The contour for a given partial percentage will lie in different places for these two metrics because they measure somewhat different things, but they are both valid.
Second, many people are puzzled by the eclipse shadow's motion from west to east, opposite the apparent motion of the Sun and the rest of the sky from east to west. The direction of the shadow's motion is determined by the orbital motion of the Moon, which is in the same direction as the Earth's rotation but over twice as fast. The Moon is moving at roughly 2300 miles per hour (3700 km/hr) from west to east, while a spot on the Earth's equator is traveling only a little over 1000 mph (1600 km/hr). And because of the Earth's curvature, the speed of the shadow on the ground is even faster than this difference implies.
Although the Moon rises and sets like everything else in the sky, it is also moving from west to east relative to the background stars. You can easily verify this by tracking its position relative to the stars over the course of the night. It moves east (backwards
) by roughly its own diameter (half a degree) each hour.
Credits
Please give credit for this item to:
NASA's Scientific Visualization Studio
-
Visualizer
-
Ernie Wright
(USRA)

-
Ernie Wright
(USRA)
-
Technical support
- Laurence Schuler (ADNET Systems, Inc.)
- Ian Jones (ADNET Systems, Inc.)
-
Producer
- Abbey A. Interrante (ADNET Systems, Inc.)
Datasets used
-
BMNG (Blue Marble: Next Generation) [Terra and Aqua: MODIS]
ID: 508Credit: The Blue Marble data is courtesy of Reto Stockli (NASA/GSFC).
This dataset can be found at: http://earthobservatory.nasa.gov/Newsroom/BlueMarble/
See all pages that use this dataset -
DE421 (JPL DE421)
ID: 752Planetary ephemerides
This dataset can be found at: http://ssd.jpl.nasa.gov/?ephemerides#planets
See all pages that use this dataset
Note: While we identify the data sets used on this page, we do not store any further details, nor the data sets themselves on our site.
Newer Versions
- ID: 5510
 Visualization
Release date
This page was originally published on Saturday, September 7, 2024.
This page was last updated on Tuesday, February 25, 2025 at 5:01 PM EST.