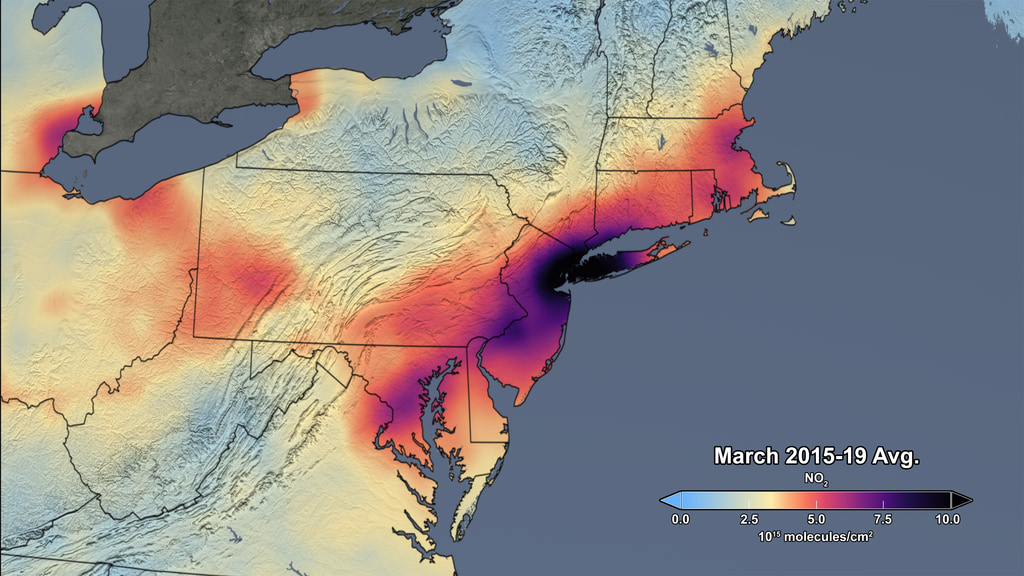
Tropspheric NO2 Column over Eastern United States, 2015-2023
Tropspheric NO2 column over Eastern United States, 2015-2023
This animation is an update to svs.gsfc.nasa.gov/4810, extending the visualization of OMI nitrogen dioxide data through 2023.
Credits
Please give credit for this item to:
NASA's Scientific Visualization Studio
-
Visualizer
- Trent L. Schindler (USRA)
-
Scientists
- Bryan Duncan (NASA/GSFC)
- Lok Lamsal (USRA)
-
Technical support
- Ian Jones (ADNET Systems, Inc.)
- Laurence Schuler (ADNET Systems, Inc.)
Datasets used
-
[Aura: OMI]
ID: 147 -
Ozone [Aura: OMI]
ID: 264 -
BMNG (Blue Marble: Next Generation) [Terra and Aqua: MODIS]
ID: 508Credit: The Blue Marble data is courtesy of Reto Stockli (NASA/GSFC).
This dataset can be found at: http://earthobservatory.nasa.gov/Newsroom/BlueMarble/
See all pages that use this dataset
Note: While we identify the data sets used on this page, we do not store any further details, nor the data sets themselves on our site.
Related
- ID: 31225
 Hyperwall Visual
 - ID: 4912

Used as a Source In
- ID: 13814
 Produced Video
 - ID: 13753
 Produced Video
 - ID: 31142
 Hyperwall Visual
Release date
This page was originally published on Wednesday, June 19, 2024.
This page was last updated on Sunday, January 19, 2025 at 11:10 PM EST.