5000 Years of Total Solar Eclipses: The Movie
An animated heatmap showing the accumulation of total solar eclipse paths over the 5000 years from 2000 BCE to 3000 CE.
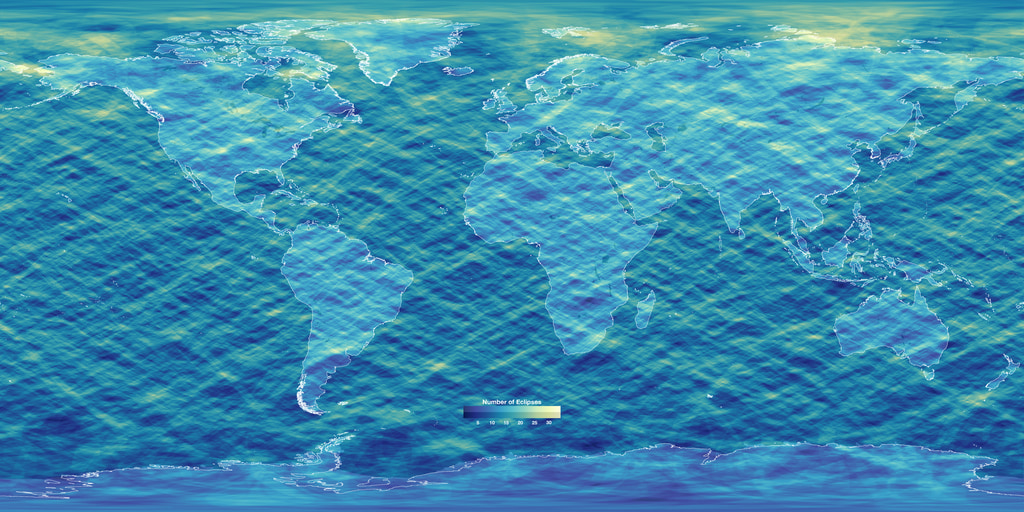
This is an animated heatmap showing the density of solar eclipse paths over the Earth during the 5000-year period between 2000 BCE and 3000 CE. It uses the eclipses calculated by Fred Espenak and Jean Meeus and published in 2006 as the Five Millennium Canon of Solar Eclipses. The paths of the 3742 eclipses classified in the Canon as either T
(total) or H
(hybrid or total-annular) were drawn into a global map. The pixels count the eclipse paths as they are drawn.
See the still image version of this heatmap for more details about the data behind this visualization, including a cautionary note about longitudes. Something pointed out there is that every pixel in the map is eventually painted by at least one shadow path. The animated version can tell us exactly how long that takes: 99% of the pixels are visited as of 91 BCE, 99.9% by 753 CE, and 100% by the year 2577. It takes 19 centuries to fill almost all the pixels but another 27 to catch the stragglers!
An animated heatmap showing the accumulation of total solar eclipse paths over the 5000 years from 2000 BCE to 3000 CE. This version is formatted for Science on a Sphere.
The date key as a sequence of PNG files with transparency.
For More Information
Credits
Please give credit for this item to:
NASA's Scientific Visualization Studio
-
Visualizer
-
Ernie Wright
(USRA)

-
Ernie Wright
(USRA)
-
Technical support
- Laurence Schuler (ADNET Systems, Inc.)
- Ian Jones (ADNET Systems, Inc.)
Related papers
Datasets used
-
Five Millennium Canon of Solar Eclipses (Five Millennium Canon of Solar Eclipses)
ID: 1204Compilation of every solar eclipse occurring between 2000 BCE and 3000 CE
Credit: Fred Espenak and Jean Meeus, 2006. NASA Technical Publication TP-2006-214141
This dataset can be found at: https://eclipse.gsfc.nasa.gov/SEpubs/5MCSE.html
See all pages that use this dataset -
DE441 (DE441)
ID: 120530,000-year solar system ephemeris
Credit: Navigation and Ancillary Information Facility, NASA Jet Propulsion Laboratory
This dataset can be found at: https://naif.jpl.nasa.gov/naif/data_generic.html
See all pages that use this dataset
Note: While we identify the data sets used on this page, we do not store any further details, nor the data sets themselves on our site.
Related
- ID: 5222
 Visualization
Release date
This page was originally published on Wednesday, March 13, 2024.
This page was last updated on Friday, March 22, 2024 at 1:01 PM EDT.