5000 Years of Total Solar Eclipses

A heatmap showing the frequency of total solar eclipses over the 5000 years from 2000 BCE to 3000 CE. Includes versions without the color key and without the continent outlines.
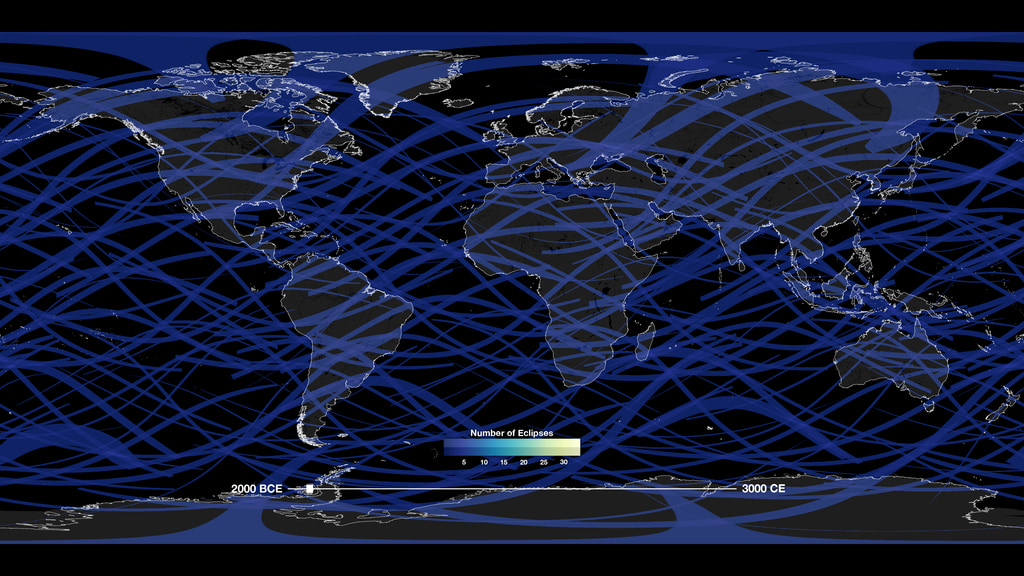
This is a heatmap showing the density of solar eclipse paths over the Earth during the 5000-year period between 2000 BCE and 3000 CE. It uses the list of eclipses calculated by Fred Espenak and Jean Meeus and published in 2006 as the Five Millennium Canon of Solar Eclipses. The paths of the 3742 eclipses classified in the Canon as either T
(total) or H
(hybrid or total-annular) were drawn into a global map with a pixel resolution of 4 minutes (1/15 of a degree) of latitude and longitude. The pixels counted the eclipse paths as they were drawn, and each pixel location ended up experiencing anywhere from one to 35 eclipses.
It's tempting to make statements about particular locations based on the map, but that wouldn't be valid. Because the rotation speed of the Earth isn't perfectly uniform, the longitudes of the paths are increasingly uncertain for times farther in the future and the distant past. Rather than trying to estimate the longitude corrections, the map (and the Canon) use Terrestrial Time, a uniform astronomical timescale that ignores the variable rotation of the Earth. Thus, the latitude and shape of each path is true, while the longitude is only accurate on a fictitious Earth that turns with the perfection of an atomic clock at sea level.
What we can do is draw a number of statistical inferences about the geographical distribution of total eclipses. For example, more total eclipses happen in the northern hemisphere than in the southern, which is mostly the result of the Earth's slightly lopsided elliptical orbit around the Sun. Eclipses are more likely in the summer, just because the Sun is up longer then. Summer in the northern hemisphere happens when the Earth is near aphelion, its farthest distance from the Sun for the year, and this makes the Sun a bit smaller in the sky, giving the Moon a better chance of covering it completely. This latitude bias is shown clearly in the graph below.
It's evident from the heatmap that a total solar eclipse can happen absolutely anywhere on Earth. In fact, there isn't a single pixel in the map that isn't visited by at least one eclipse – not a single goose egg in any of the 14.6 million points sampled by the map.
The map can also be used to estimate, on average, the time between two total eclipses at particular places. Across the entire map, the average number of eclipses seen by a pixel is 13.66. Dividing 5000 years by this figure produces an average of 366 years between eclipses. This number is almost exactly halfway between the estimates of 360 by Russel et al. in their 1926 astronomy textbook and 375 by Jean Meeus in a 1982 paper published in the Journal of the British Astronomical Association.
A graph of the average number of total eclipses experienced at each latitude in the eclipse frequency heatmap. The average was calculated for each scanline of the heatmap.
A grayscale version of the heatmap showing the frequency of total solar eclipses over the 5000 years from 2000 BCE to 3000 CE. The floating-point image contains the actual count of eclipse paths crossing each pixel. Fractional counts indicate the edge of a path passed through only part of the pixel. The 8-bit image stretches the count over the full 0 to 255 range of pixel levels. Divide each pixel level by 34.216 to match the floating-point levels.
The color key for the heatmap.
For More Information
Credits
Please give credit for this item to:
NASA's Scientific Visualization Studio
-
Visualizer
-
Ernie Wright
(USRA)

-
Ernie Wright
(USRA)
-
Technical support
- Laurence Schuler (ADNET Systems, Inc.)
- Ian Jones (ADNET Systems, Inc.)
Related papers
Jean Meeus, The Frequency of Total and Annular Solar Eclipses for a Given Place, JBAA 92, 3 (April 1982), pp 124-126
Datasets used
-
Five Millennium Canon of Solar Eclipses (Five Millennium Canon of Solar Eclipses)
ID: 1204Compilation of every solar eclipse occurring between 2000 BCE and 3000 CE
Credit: Fred Espenak and Jean Meeus, 2006. NASA Technical Publication TP-2006-214141
This dataset can be found at: https://eclipse.gsfc.nasa.gov/SEpubs/5MCSE.html
See all pages that use this dataset -
DE441 (DE441)
ID: 120530,000-year solar system ephemeris
Credit: Navigation and Ancillary Information Facility, NASA Jet Propulsion Laboratory
This dataset can be found at: https://naif.jpl.nasa.gov/naif/data_generic.html
See all pages that use this dataset
Note: While we identify the data sets used on this page, we do not store any further details, nor the data sets themselves on our site.
Related
- ID: 5236
 Visualization
Release date
This page was originally published on Tuesday, February 20, 2024.
This page was last updated on Monday, February 19, 2024 at 12:41 PM EST.