GEOS-FP Near-Surface Humidity
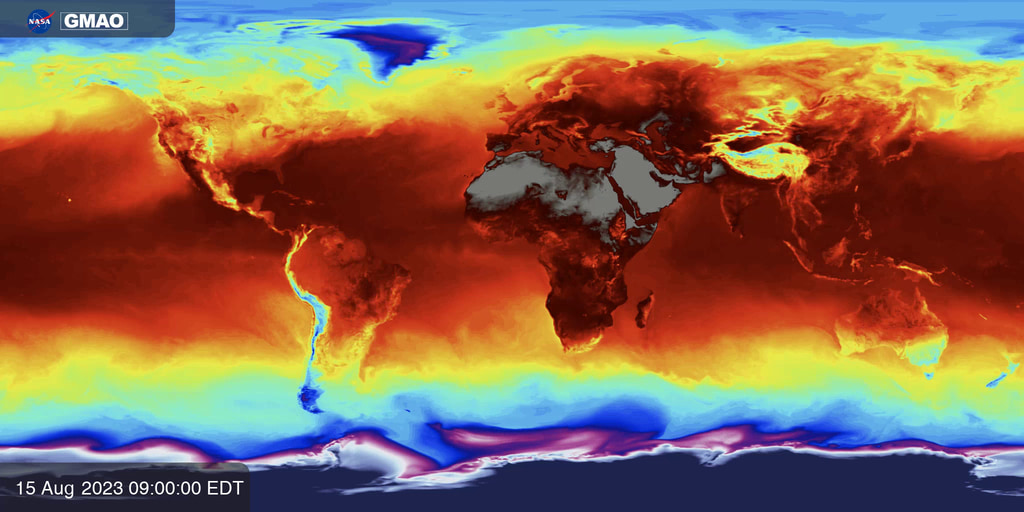
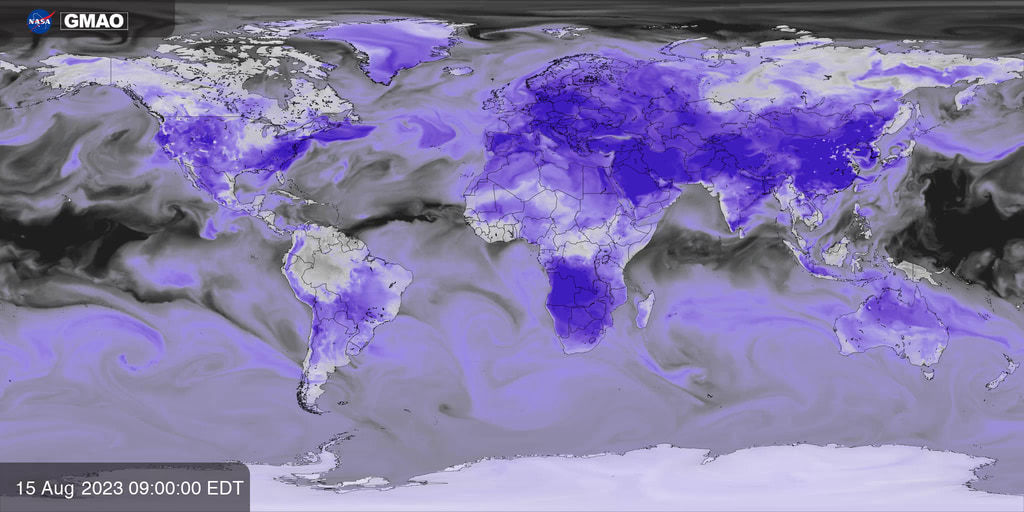
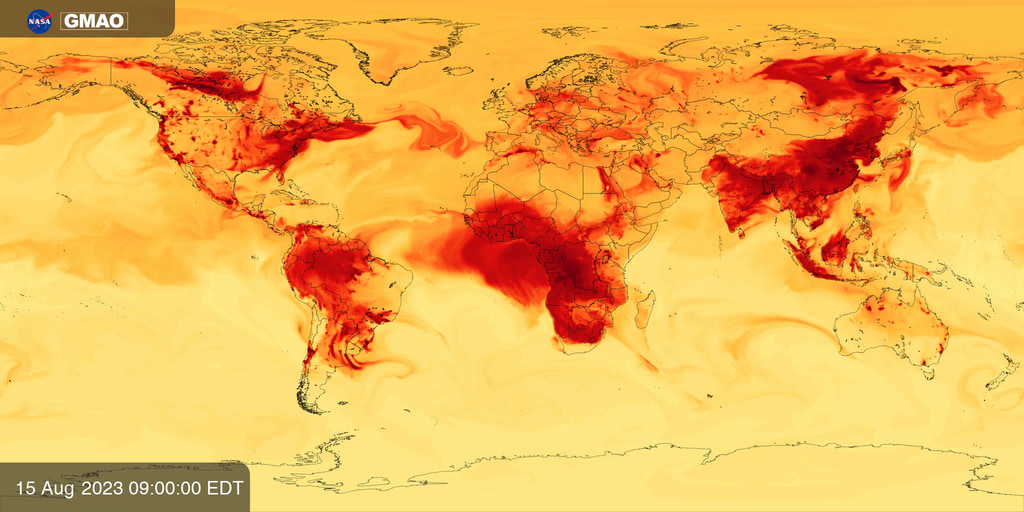
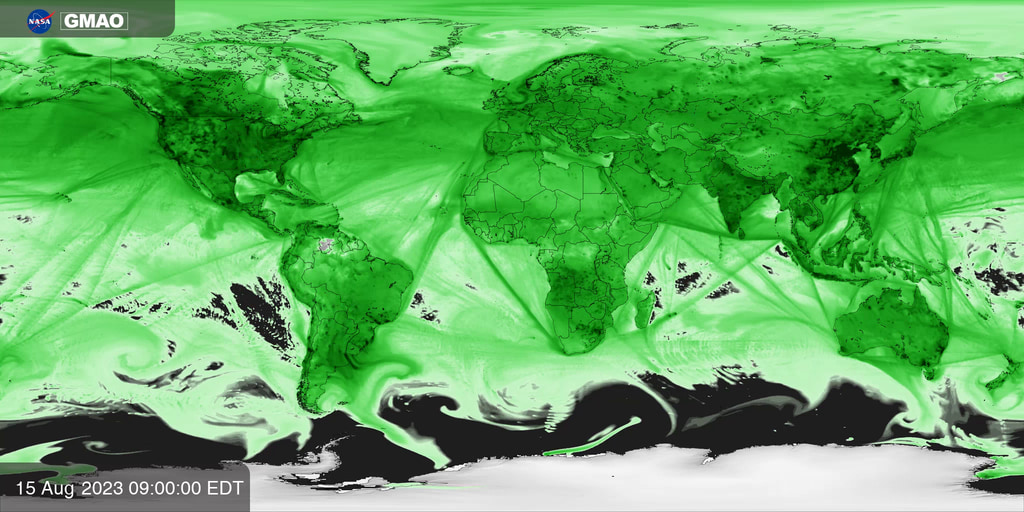
Near-surface Humidity, also known as specific humidity (Q2M) from NASA’s GEOS-FP system. GEOS-FP combines millions of weather observations with a predictive model to create a global best estimate of weather conditions that are used to begin a forecast.
This daily-updated visualization shows near-surface humidity data from the last two weeks through the present day. Weather models begin their forecasts by integrating observations from ground stations, aircraft, balloons, and a growing constellation of Earth observing satellites to estimate the most realistic atmospheric state. The Goddard Earth Observing System Forward Processing (GEOS-FP) system is a research model maintained by NASA’s Global Modeling and Assimilation Office to demonstrate innovative new ways to use satellite data to improve predictions of weather, air quality, and greenhouse gases and to help NASA collect new observations of our home planet.
Near-surface humidity, also known as specific humidity (Q2M), measures the actual amount of water vapor present in the air near Earth's surface. This measurement tells us the exact mass of water vapor per unit of air mass, typically measured in grams per kilogram (g/kg). It is calculated using atmospheric temperature and pressure data and remains relatively constant even as temperature changes throughout the day. Near-surface Humidity patterns reveal how moisture moves through the atmosphere via weather systems, ocean evaporation, and land surface processes. Understanding near-surface humidity is crucial for predicting weather patterns, agricultural conditions, and air quality, as it directly influences cloud formation, precipitation development, and the transport of atmospheric pollutants.

Near-Surface Humidity (Q2M) colorbar with semi-transparent background, optimized for Earth Information Center content.

Near-Surface Humidity (Q2M) colorbar.
For More Information
Credits
Please give credit for this item to:
NASA's Global Modeling and Assimilation Office and NASA's Scientific Visualization Studio
-
Visualizers
- Joseph V. Ardizzone (NASA/GSFC)
-
Helen-Nicole Kostis
(Science and Technology Corporation)

Series
This page can be found in the following series:Datasets used
-
GEOS-FP
ID: 1196Documentation: Lucchesi, R., 2018: File Specification for GEOS FP. GMAO Office Note No. 4 (Version 1.2), 61 pp, available from https://gmao.gsfc.nasa.gov/pubs/docs/Lucchesi1203.pdf
This dataset can be found at: https://fluid.nccs.nasa.gov/weather/
See all pages that use this dataset
Note: While we identify the data sets used on this page, we do not store any further details, nor the data sets themselves on our site.
Related
- ID: 5147
 Visualization
 - ID: 5148
 Visualization
 - ID: 5149
 Visualization
 - ID: 5151
 Visualization
 - ID: 5152
 Visualization
 - ID: 5153
 Visualization
 - ID: 5154
 Visualization
Release date
This page was originally published on Tuesday, September 26, 2023.
This page was last updated on Sunday, March 15, 2026 at 2:00 AM EDT.